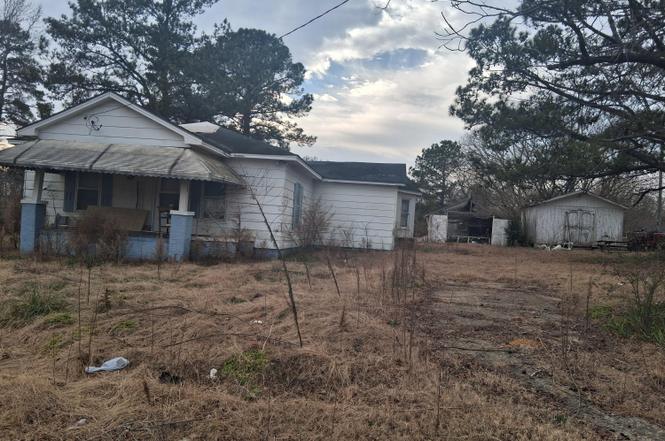
149 Fox Trot Way · Wilson's Mills, NC
Flood risk 1/10 · Minimal
- FEMA flood zone
- X (unshaded)
- Chance of flooding over 30 yrs
- 0.0%
- Est. flood insurance / yr
- $507 – $1,088
Fire risk 4/10 · Minor
- Est. fire insurance / yr
- $906 – $1,684
Heat risk 6/10 · Moderate
- Hot days now (above 106°F)
- 7 days/yr
- Hot days in 30 yrs
- 17 days/yr
Wind risk 6/10 · Moderate
- Chance of severe wind over 30 yrs
- 67.0%
Air-quality risk 2/10 · Minimal
- Unhealthy air days now
- 1 days/yr
- Unhealthy air days in 30 yrs
- 2 days/yr
Risk factors via First Street. Map © Google.
Why this score? — see what drove the C grade
The composite is a weighted blend of 9 inputs, each scored 0–100. Each bar is that input's sub-score; the figure is the points it added to the 100-point composite (weight × sub-score).
- Cash flow +22.3/30.0
- ARV discount +15.0/15.0
- DSCR +7.1/10.0
- 1% rule +5.8/10.0
- Schools +3.5/10.0
- Livability +2.5/5.0
- Rent growth +2.2/5.0
- Condition / age +1.0/5.0
- Appreciation +0.0/10.0
$159,900
🖨 Deal sheet (PDF) 📄 Offer letter ✓ Due diligence
Listing remarks
PRICE REDUCED! Investment Opportunity OR Renovate and Live In! Located on 'Room To Run' ACRE Lot! The BEAUTIFUL lot is currently overgrown but has great value by itself. The home NEEDS MUCH WORK but features a front porch, living room, kitchen/breakfast area, two bedrooms, add'l room, laundry area and detached storage building! NO records for septic tank or septic system! MAY have recent tap or hook up for county water! Appears to have a private well too! The tractor and other vehicles DO NOT convey with the property! Property is Selling in AS/IS Where Is Condition; No Repairs By The Seller!
Key facts
- Private well
- Front porch
- Living room
Tags
Property features AI
Finance
- Other: Approximately 0.99-acre lot; Zoned MU-2
- HOA & community: No homeowners association; Not a senior community
Exterior
- Parking: Driveway
- Utilities: Septic tank sewer; Other/see remarks water source
- Home design: One-story site-built home; Facing direction not specified
- Construction: Masonite and other exterior materials; Brick/mortar foundation; Shingle roof; Built on site
- Exterior features: Front porch; Easement road frontage; Private maintained road; Dirt road surface
Interior
- Bedrooms: Two bedrooms (both on the main level)
- Flooring: Carpet; Vinyl; Other
- Bathrooms: One full bathroom; One half bathroom
- Heating & cooling: Gas pack heating; Central air conditioning; Ceiling fans
- Interior features: Fixer condition; Carpet and vinyl flooring with other floor types
Neighborhood map
What this means for you Summary
Snapshot
- This is a 2-bed/1.5-bath single-family listed at $160k. Condition is rated poor.
Deal economics
- At list price, monthly cash flow is $262 ($3k/yr) — positive.
- The deal already cash-flows at list — no discount required.
- Meets the 1% rule at list price ($2k rent vs $160k).
- Recommended offer: $146k (9.0% below list) — sets the bar for market timing.
- Cap rate 8.3% vs local median 4.0% in Wilson's Mills — top-decile yield for the area; either an underpriced asset or a hidden risk that comps aren't pricing in. Stress-test before assuming the spread holds.
Location & tenants
- Location reads: area grade C — affects rentability + tenant quality, not the cash-flow math above.
- Johnston County Public Schools (rural): math 39% / reading 42% proficiency, ranked #105 of 178 in NC (top 59%) — families likely to look elsewhere, expect single-tenant / working-renter base with shorter leases.
- Zoned schools: Wilson'S Mills Elementary (math 22% / reading 23%, grade F, #1,175 of 1,410 statewide, top 84%, 503 students, 82% FRL); Smithfield Middle (math 20% / reading 32%, grade F, #385 of 475 statewide, top 81%, 501 students, 99% FRL); Smithfield-Selma High (math 25% / reading 37%, grade F, #454 of 535 statewide, top 85%, 1,503 students, 69% FRL) — zoned schools average 84% FRL vs 41% district-wide (43 pts higher); higher-poverty schools than district average — tighter screening recommended.
- Zoned-school proficiency averages 26% at this address vs 40% district-wide (-14 pts) — the specific schools serving this property underperform the Johnston County Public Schools average; the district grade overstates school quality for this exact location.
- Market conditions: Rents soft (-1.1%/yr); 407 active listings in the ZIP; 4 comparable units currently listed for rent nearby; rentals leasing fast (median 14d on market — plan ~1-2 weeks tenant-placement turnaround); 2,783 units permitted in Johnston County in 2024 (6 in 5+ unit buildings).
- This rent runs 33% of the median local income ($63k/yr) — at the standard rent-burdened threshold; future hikes will face affordability resistance.
Forward outlook
- Local home prices are declining (-3.0%/yr); year-one equity from $1k of loan paydown is wiped out by about $5k of value loss. Plan a longer hold.
- Johnston County population projected at +37% by 2050 — long-run rental-demand tailwind backs the buy-and-hold thesis.
Negotiation context
- It's been on market 116 days — a 9% lower offer ($146k) is reasonable based on typical stale-listing flexibility.
Risks & watch-outs
- Watch-outs: built in 1930 — expect roof / HVAC / electrical / plumbing capex.
- Climate carrying-cost: major wind risk, 67% chance of damaging wind over 30y; extreme-heat days projected 7→17/yr by 2055 (HVAC capex compounding) — expect insurance premiums to compound above CPI over the hold.
Questions for the listing agent
- It's been on market 116 days. Have you received any prior offers? Is the seller open to a 9% concession, seller financing, or rate buy-down credit?
- Have any recent inspections been done? Can we get a copy of the seller's disclosures and any deferred-maintenance estimates?
- Built in 1930 — when were the roof, HVAC, electrical panel, plumbing, and water heater last replaced?
- Why hasn't it sold? Are there any deal-killer items the seller is aware of (foundation, flood, title, zoning, code violations)?
- Is there a deadline driving the sale (1031 exchange, divorce, estate, relocation)? That informs how much negotiation room exists.
- What's the average days-on-market for RENTAL listings here right now (not sales)? A rising rental-DOM trend means longer vacancies and softer asking-rent achievability than the comps imply.
- What's the recent tenant-quality profile in this submarket — average credit score on applications, eviction rate, late-payment / NSF rate, and stable-employment percentage? A property-management company in the area should have these aggregated.
- How much new for-sale + rental construction is in the pipeline within 1–3 miles? Heavy new supply typically softens prices + rents 12–24 months out; constrained supply supports both.
Investment metrics
- 1% rule
- 1.08% ✓
- Cap rate
- 8.26%
- Cash-on-cash
- 7.02%
- DSCR
- 1.31
- GRM
- 7.7
CMA / ARV
- ARV (on-the-fly)
- $282,240
- Comps found
- 9
Show comp detail 9 sales within ~0.75 mi
| Address | Dist | Beds/Ba | Sqft | Sold | Price | $/sf | Match |
|---|---|---|---|---|---|---|---|
| 101 Copper Stone St | 0.30mi | 3/2.0 (+1) | 1,188 (-6%) | 2mo | $264,900 | $223 | 68 |
| 144 Yellow Stone Ln | 0.23mi | 3/2.0 (+1) | 1,157 (-8%) | 6mo | $256,000 | $221 | 64 |
| 253 Holton St | 0.14mi | 3/2.0 (+1) | 1,183 (-6%) | 15mo | $289,900 | $245 | 64 |
| 237 Holton St | 0.13mi | 3/2.0 (+1) | 1,183 (-6%) | 16mo | $290,900 | $246 | 64 |
| 119 Yellow Stone Ln | 0.23mi | 3/2.0 (+1) | 1,233 (-2%) | 20mo | $250,000 | $203 | 62 |
| 109 Stone Ridge Dr | 0.34mi | 3/2.0 (+1) | 1,119 (-11%) | 12mo | $256,000 | $229 | 48 |
| 118 Norris Creek Dr | 0.67mi | 3/2.0 (+1) | 1,347 (+7%) | 3mo | $307,000 | $228 | 47 |
| 140 Rivercamp St | 0.72mi | 3/2.0 (+1) | 1,338 (+6%) | 4mo | $295,000 | $220 | 45 |
| 107 Shearin Rd | 0.59mi | 3/2.0 (+1) | 1,342 (+6%) | 24mo | $300,000 | $224 | 35 |
Match score weights: distance 35% · size 25% · config 20% · recency 20%. Top-matched comps best support the ARV.
Projected returns pro-forma
-3.0% appreciation · 0.0% rent growth · sell at horizon
- IRR
- -9.0%
- Equity multiple
- 0.68×
- Total profit
- $-14,271
- Equity at exit
- $23,842
- IRR
- -4.1%
- Equity multiple
- 0.77×
- Total profit
- $-10,434
- Equity at exit
- $13,825
Cash invested: $44,772 (down + closing). Projections, not guarantees.
Landlord ↔ Tenant lean methodology
- Overall (STATE)
- 85 Strongly Landlord-Friendly
- State North Carolina
- 85 Strongly Landlord-Friendly · R+3
- County
- — inherits STATE
- City
- — inherits STATE
ZIP-level market 27577
- Home prices YoY
- -23.7%
- Rents YoY
- -1.1%
- Active inventory
- 407
- Price-to-rent
- 7.7×
Monthly cashflow live
- Estimated rent
- $1,730 medium interval (Pro) →
- Mortgage (P&I)
- −$839
- Tax est. 1.5%
- −$200 /mo · $2,398/yr
- Insurance
- −$67
- HOA
- −$0
- Vacancy / Maint / Mgmt
- −$363
- Net cashflow
- $262
Break-even live
Sensitivity live
| Price | -10% $372 | -5% $317 | +0% $262 | +5% $207 | +10% $151 |
|---|---|---|---|---|---|
| Rent | -10% $125 | -5% $194 | +0% $262 | +5% $330 | +10% $399 |
| Rate | -1.0pp $342 | -0.5pp $303 | base $262 | +0.5pp $221 | +1.0pp $178 |
UW: 25.0% down · 7.5% · 30yr · 1.5% tax · 5.0% vac · 8.0% maint · 8.0% mgmt
Financing live
Cash to close
- Down payment
- $39,975
- Closing costs
- $4,797
- Reserves months
- —
- Total cash needed
- —
Loan-product check · same deal, 3 products live
Conventional
25% down · 7.5% · 30yr
- Down + closing
- —
- Monthly P&I
- —
- Monthly cashflow
- —
- DSCR
- —
- Eligible?
- —
Personal DTI + credit; lowest rate.
DSCR
20% down · 8.5% · 30yr
- Down + closing
- —
- Monthly P&I
- —
- Monthly cashflow
- —
- DSCR
- —
- Eligible?
- —
No personal income docs; deal must DSCR.
Hard money
10% down · 12.0% · 12mo
- Down + closing
- —
- Monthly P&I
- —
- Monthly cashflow
- —
- DSCR
- —
- Eligible?
- —
Short-term bridge; refi at stabilization.
Rent comps 4 comps
| Address | Beds | Baths | Sqft | Rent | $/sqft | DOM | Units | Dist |
|---|---|---|---|---|---|---|---|---|
| 131 S Meyers CT Clayton, NC | 3.0 | 2.5 | 1368 | $1,800 | $1.32 | 4d | 1 | 0.45mi |
| 138 Johnston Farms Dr Smithfield, NC | 3.0 | 2.0 | 1181 | $1,730 | $1.46 | 4d | 1 | 0.76mi |
| 89 Forest Island Ave Smithfield, NC | 3.0 | 2.0 | 1148 | $1,595 | $1.39 | 13d | 1 | 1.00mi |
| 179 Maple Tree Ln Clayton, NC | 3.0 | 2.5 | 1832 | $1,895 | $1.03 | 25d | 1 | 1.47mi |
Listing history 17 events
-
2026-06-21days on market $159,900 Active 116 DOM
-
2026-06-18days on market $159,900 Active 113 DOM
-
2026-06-17days on market $159,900 Active 112 DOM
-
2026-06-16days on market $159,900 Active 111 DOM
-
2026-06-15days on market $159,900 Active 110 DOM
-
2026-06-13days on market $159,900 Active 108 DOM
-
2026-06-13days on market $159,900 Active 107 DOM
-
2026-06-09days on market $159,900 Active 104 DOM
-
2026-06-08days on market $159,900 Active 103 DOM
-
2026-06-07days on market $159,900 Active 102 DOM
-
2026-06-05days on market $159,900 Active 99 DOM
-
2026-06-03days on market $159,900 Active 98 DOM
-
2026-06-02days on market $159,900 Active 97 DOM
-
2026-06-01days on market $159,900 Active 96 DOM
-
2026-05-31days on market $159,900 Active 95 DOM
-
2026-04-20price $159,900
-
2026-02-25$169,900 Active
ⓘ Source: listings_history table (triggers on properties + properties_extension) + one-shot
backfill from property_details.listing_events for pre-trigger history.
Climate risk First Street
- Flood 1/10 Low FEMA zone X (unshaded) · 0% chance over 30 yrs
- Wildfire 4/10 Moderate
- Heat 6/10 Major 7 d/yr ≥106°F today · 17 d/yr by 30 yrs out
- Wind 6/10 Major 67% chance of damaging wind over 30 yrs
- Air quality 2/10 Low 1 unhealthy d/yr today · 2 by 30 yrs out
Nearby sold comps map
Loading sold comps map…
Walkable amenities ~0.75 mi
Loading nearby amenities…
Taxation est. · year 1
- Rental income
- $20,765
- − Mortgage interest
- −$8,957
- − Property taxes
- −$2,398
- − Insurance
- −$800
- − Repairs & maintenance
- −$1,661
- − Management
- −$1,661
- − Depreciation
- −$4,652
- Taxable income
- $636
- Est. tax owed @ 24.0%
- −$153
- After-tax cash flow
- $2,991/yr
For passive investors: Depreciation is non-cash, so a rental often shows a tax loss while cash-flowing — sheltering income. Rental losses are passive: they offset passive income freely, and up to $25,000/yr can offset ordinary (W-2) income if you actively participate and your MAGI is under $100k (phasing out to $0 by $150k); unused losses carry forward. On sale, claimed depreciation is recaptured at up to 25%, and gains may owe capital-gains tax (a 1031 exchange can defer both). Figures are a year-1 estimate at your 24.0% rate — not tax advice; consult a CPA.
Condition & rehab AI · 13 photos
This property requires extensive repairs and renovations to improve its condition and increase its value for resale and rental.
Repairs flagged
- Major roof — The roof appears to be in poor condition, with visible wear and tear.
- Major exterior siding — The exterior siding is peeling and in poor condition.
- Major flooring — The flooring in the interior appears to be carpeted and in poor condition.
- Major interior walls — The interior walls are painted in a light green color and appear to be in poor condition.
- Major HVAC system — The HVAC system appears to be in poor condition, with visible wear and tear.
Value-add opportunities
- Both repair and replace roof — A new roof will improve the home's appearance and increase its value for both resale and rental.
- Both repair and paint exterior siding — A new exterior siding will improve the home's appearance and increase its value for both resale and rental.
- Both repair and replace HVAC system — A new HVAC system will improve the home's comfort and energy efficiency, increasing its value for both resale and rental.
Renovation cost estimate screening
| Repair item | Severity | Est. cost |
|---|---|---|
| roof · The roof appears to be in poor condition, with visible wear and tear. | Major | $15,000–50,000 |
| exterior siding · The exterior siding is peeling and in poor condition. | Major | $15,000–50,000 |
| flooring · The flooring in the interior appears to be carpeted and in poor condition. | Major | $15,000–50,000 |
| interior walls · The interior walls are painted in a light green color and appear to be in poor condition. | Major | $15,000–50,000 |
| HVAC system · The HVAC system appears to be in poor condition, with visible wear and tear. | Major | $15,000–50,000 |
| Total estimated repair cost · 5 items | $75,000–250,000 |
Value-add ROI direction
- Both repair and replace roof — A new roof will improve the home's appearance and increase its value for both resale and rental. ↑
- Both repair and paint exterior siding — A new exterior siding will improve the home's appearance and increase its value for both resale and rental. ↑
- Both repair and replace HVAC system — A new HVAC system will improve the home's comfort and energy efficiency, increasing its value for both resale and rental. ↑
ⓘ Cost ranges are severity-bucket heuristics (US national rule-of-thumb). Get contractor quotes + a written scope before underwriting a rehab budget.
Schools (NCES district)
- District
- Johnston County Public Schools
- NCES district ID
- 3702370
- Math proficiency
- 39% ▲ 4.00%
- Reading proficiency
- 42% ▲ 2.00%
- Median HH income
- $50,912
- Composite
- 34.99/100
- National rank
- #5052
- State rank
- #105 of 178 in NC
Livability — Wilson's Mills
No livability data for this city. (Only ~50 U.S. cities are tracked.)
Census & demographics
- Census place
- Wilson's Mills, NC
- County
- Johnston County · 175,441 people
- Metro
- Raleigh-Cary, NC
- Population (ZIP)
- 28,354
- Household income
- $62,758
- Rent vs Own
- Severe rent burden
- 919.0
Population outlook (Johnston County) Hauer SSP2
- Today (2025)
- 222,440 people
- By 2030
- 240,227 · +8.0%
- By 2040
- 274,616 · +23.5%
- By 2050
- 304,915 · +37.1%
- By 2075
- 369,507 · +66.1%
- By 2100
- 406,280 · +82.6%
Race, ethnicity, and origin ACS 2023
- Neighborhood character
- Diverse neighborhood (Simpson 0.60)
- Race & ethnicity
- White 57% Hispanic / Latino 21% Black 19% Two or more races 7% Asian 1%
- Hispanic origin (detail)
- Mexican 13% Puerto Rican 2% Dominican 1%
- Common ancestry
- Lithuanian 2% Serbian 2% Slovak 1%
- Foreign-born
- 12% · Canada, Jamaica, South Korea
- Languages at home
- 80% English-only · Spanish 19%
Political lean MEDSL · Johnston
- 2024 margin
- Strong R (+21.5) · D 38.7% · R 60.2% · Other 1.1%
- 2008→2024 swing
- +2.2pp toward D · 2008: -23.7pp · 2024: -21.5pp
- All cycles
- 2024: R+21.5 2020: R+24.3 2016: R+30.7 2012: R+27.8 2008: R+23.7
Not yet ingested
- Civics
- —
Market trends
- HPI YoY
- ▼ -72.11%
- Current HPI
- 232.1552
- Rent YoY
- ▼ -1.05%
- Metro
- Raleigh-Cary, NC
- State GDP YoY
- ▲ 3.28%
- F500 in state
- 26
Industry mix (Fortune 500 HQ in NC)
| Industry | F500 HQs | Revenue |
|---|---|---|
| Financial Services | 2 | $213B |
|
||
| Retail | 2 | $95B |
|
||
| Industrial Conglomerate | 1 | $38B |
|
||
| Metals / Steel | 1 | $35B |
|
||
| Utilities | 1 | $30B |
|
||
| Industrial Machinery | 1 | $19B |
|
||
Price history
-5.9% since first listed2 events — show timeline
- 2026-04-20 Price Changed $159,900 TMLS
- 2026-02-25 Listed $169,900 TMLS
Cash-flow waterfall
monthlySold comps — $/sqft
last 12 mo · ≤1 miLoading sold comps…