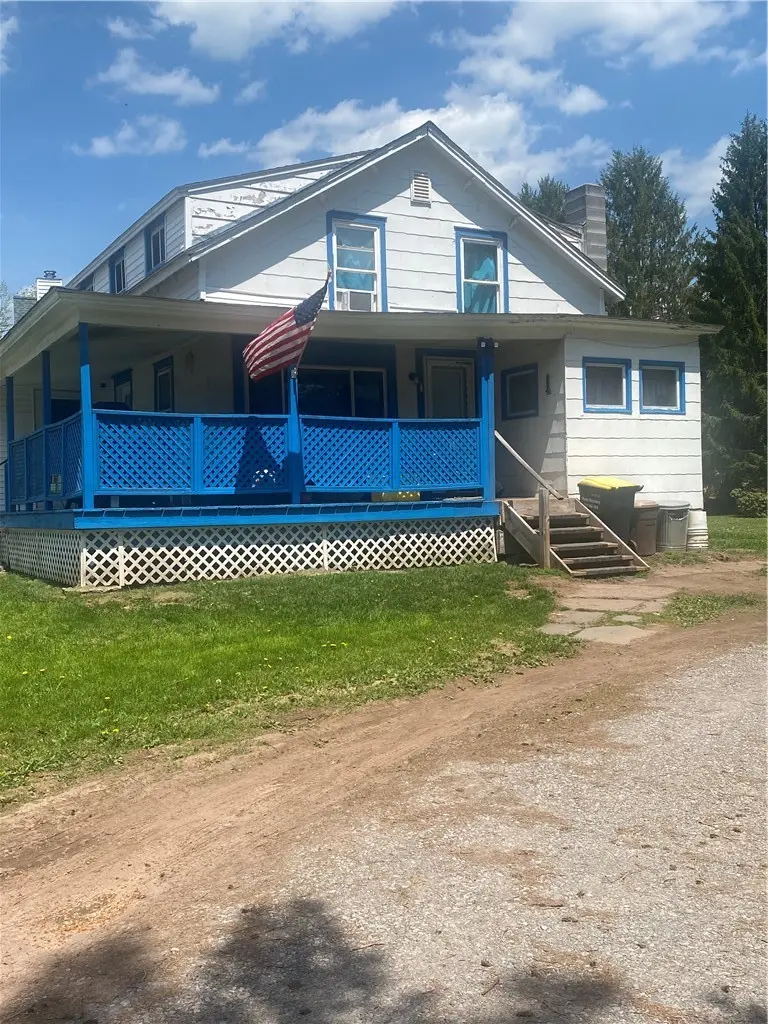
54 River St · Stamford, NY
Flood risk 6/10 · Moderate
- FEMA flood zone
- X (unshaded)
- Chance of flooding over 30 yrs
- 0.72%
- Est. flood insurance / yr
- $473 – $860
Fire risk 2/10 · Minimal
- Est. fire insurance / yr
- $691 – $1,283
Heat risk 1/10 · Minimal
- Hot days now (above 87°F)
- 8 days/yr
- Hot days in 30 yrs
- 18 days/yr
Wind risk 2/10 · Minimal
- Chance of severe wind over 30 yrs
- 2.0%
Air-quality risk 1/10 · Minimal
- Unhealthy air days now
- 0 days/yr
- Unhealthy air days in 30 yrs
- 0 days/yr
Risk factors via First Street. Map © Google.
Why this score? — see what drove the B grade
The composite is a weighted blend of 9 inputs, each scored 0–100. Each bar is that input's sub-score; the figure is the points it added to the 100-point composite (weight × sub-score).
- Cash flow +30.0/30.0
- 1% rule +10.0/10.0
- DSCR +10.0/10.0
- Appreciation +7.6/10.0
- ARV discount +5.0/15.0
- Schools +3.4/10.0
- Livability +3.4/5.0
- Rent growth +2.5/5.0
- Condition / age +2.5/5.0
$215,000
🖨 Deal sheet 📄 Offer letter ✓ Due diligence
Listing remarks MLS
QUAINT VILLAGE CAPE. .. This warm & inviting 3 bedroom, 1 3/4 bath home has a formal dining room, solid oak Kraftmade kitchen cabinets w/ breakfast nook, large living room and a charming wraparound covered porch. A full basement with a managable yard that's a short walk to the school, markets and cafes.
Key facts
- Large yard
- Wrap around deck
- Access to town pool
Tags
Property features AI
Exterior
- Parking: No garage
- Utilities: Public water connected; Sewer connected
- Home design: 2-story house; Resale property
- Construction: Frame construction; Block foundation; Attic/crawl hatchway(s) insulated
- Exterior features: Dirt driveway; Rectangular residential lot (77 x 169)
Interior
- Kitchen: Electric oven; Electric range; Microwave; Refrigerator
- Bedrooms: One main-level bedroom
- Flooring: Carpet; Laminate; Varies
- Bathrooms: One full bathroom; One half bathroom; One main-level bathroom
- Heating & cooling: Oil forced-air heating
- Interior features: Separate/formal living room; Country kitchen; Bedroom on main level; Partial basement
- Laundry & utility: Main-level laundry; Washer; Dryer; Electric water heater
Neighborhood map
What this means for you Summary
Snapshot
- This is a 3-bed/1.5-bath single-family listed at $215k.
Deal economics
- At list price, monthly cash flow is $1k ($17k/yr) — positive.
- The deal already cash-flows at list — no discount required.
- Meets the 1% rule at list price ($4k rent vs $215k).
- Recommended offer: $212k (1.5% below list) — sets the bar for market timing.
- Cap rate 14.4% vs local median 5.3% in Stamford — top-decile yield for the area; either an underpriced asset or a hidden risk that comps aren't pricing in. Stress-test before assuming the spread holds.
Location & tenants
- Location reads 67/100 on livability (#574 in NY) — a middle-class / working-renter tenant base. Strengths: housing A+, cost of living A, crime A-; Watch: employment C-, schools D-, amenities F.
- Stamford Central School District (rural): math 40% / reading 35% proficiency, ranked #675 of 755 in NY (top 89%) — families likely to look elsewhere, expect single-tenant / working-renter base with shorter leases.
- Market conditions: 36 active listings in the ZIP; 66 units permitted in Delaware County in 2024 (0 in 5+ unit buildings).
Forward outlook
- In year one you build about $13k of equity ($1k loan paydown + $11k appreciation (5.2% local appreciation)).
- Delaware County population projected at -27% by 2050 — secular population decline; favor cash flow + early exit over multi-decade hold.
- At projected returns (5.2% appreciation + 3.0% rent growth), your $60k cash investment doubles in ~2 years — after that, you're playing with house money.
- By year 3, paydown + projected appreciation supports a ~$31k cash-out refi (75% LTV) — recoverable capital for the next deal without selling this one.
Negotiation context
- It's been on market 23 days — a 2% lower offer ($212k) is reasonable based on typical stale-listing flexibility.
- 3 sale attempts since 16y ago with the ask held roughly flat each time — persistent listings suggest the price (not the market) is what's stuck; bring a comps-based counter.
- Current owner paid $72k; list at $215k implies a 199% gain — meaningful room to come down on a strong offer.
Risks & watch-outs
- Watch-outs: built in 1920 — expect roof / HVAC / electrical / plumbing capex.
- Climate carrying-cost: major flood risk — expect insurance premiums to compound above CPI over the hold.
Questions for the listing agent
- Built in 1920 — when were the roof, HVAC, electrical panel, plumbing, and water heater last replaced?
- Is there a deadline driving the sale (1031 exchange, divorce, estate, relocation)? That informs how much negotiation room exists.
- Schools are D-rated, which usually means shorter tenancies and higher turnover. Who's the typical renter profile here, and what's been the actual vacancy rate?
- What's the average days-on-market for RENTAL listings here right now (not sales)? A rising rental-DOM trend means longer vacancies and softer asking-rent achievability than the comps imply.
- What's the recent tenant-quality profile in this submarket — average credit score on applications, eviction rate, late-payment / NSF rate, and stable-employment percentage? A property-management company in the area should have these aggregated.
- How much new for-sale + rental construction is in the pipeline within 1–3 miles? Heavy new supply typically softens prices + rents 12–24 months out; constrained supply supports both.
Investment metrics
- 1% rule
- 1.71% ✓
- Cap rate
- 14.37%
- Cash-on-cash
- 28.86%
- DSCR
- 2.28
- GRM
- 4.9
CMA / ARV
- ARV (on-the-fly)
- $203,870
- Comps found
- 7
Show comp detail 7 sales within ~0.75 mi
| Address | Dist | Beds/Ba | Sqft | Sold | Price | $/sf | Match |
|---|---|---|---|---|---|---|---|
| 6 Van Dyke Ave | 0.28mi | 3/1.5 | 1,500 (+7%) | 5mo | $325,000 | $217 | 71 |
| 29 River St | 0.09mi | 4/1.5 (+1) | 1,603 (+14%) | 1mo | $180,200 | $112 | 67 |
| 16 Railroad Ave | 0.63mi | 3/2.0 | 1,440 (+2%) | 2mo | $245,000 | $170 | 63 |
| 3 Park Ave | 0.27mi | 2/1.5 (-1) | 1,200 (-15%) | 3mo | $271,000 | $226 | 56 |
| 9 W End Ave | 0.57mi | 3/2.5 | 1,480 (+5%) | 20mo | $175,000 | $118 | 44 |
| 4 Academy St | 0.53mi | 2/1.5 (-1) | 1,300 (-8%) | 17mo | $125,000 | $96 | 44 |
| 7 Churchill Ave | 0.56mi | 2/1.0 (-1) | 1,344 (-4%) | 21mo | $195,000 | $145 | 42 |
Match score weights: distance 35% · size 25% · config 20% · recency 20%. Top-matched comps best support the ARV.
Projected returns pro-forma
5.21% appreciation · 3.0% rent growth · sell at horizon
- IRR
- 38.5%
- Equity multiple
- 3.40×
- Total profit
- $144,339
- Equity at exit
- $124,551
- IRR
- 36.5%
- Equity multiple
- 6.91×
- Total profit
- $355,570
- Equity at exit
- $217,235
Cash invested: $60,200 (down + closing). Projections, not guarantees.
Landlord ↔ Tenant lean methodology
- Overall (STATE)
- 15 Strongly Tenant-Friendly
- State New York
- 15 Strongly Tenant-Friendly · D+10
- County
- — inherits STATE
- City
- — inherits STATE
ZIP-level market 12167
- Home prices YoY
- 1.4%
- Active inventory
- 36
- Price-to-rent
- 4.9×
Monthly cashflow live
- Estimated rent
- $3,672 medium interval (Pro) →
- Mortgage (P&I)
- −$1,127
- Tax from tax record
- −$236 /mo · $2,837/yr
- Insurance
- −$90
- HOA
- −$0
- Vacancy / Maint / Mgmt
- −$771
- Net cashflow
- $1,448
Break-even live
UW: 25.0% down · 7.5% · 30yr · 1.5% tax · 5.0% vac · 8.0% maint · 8.0% mgmt
Financing live
Cash to close
- Down payment
- $53,750
- Closing costs
- $6,450
- Reserves months
- —
- Total cash needed
- —
Loan-product check · same deal, 3 products live
Conventional
25% down · 7.5% · 30yr
- Down + closing
- —
- Monthly P&I
- —
- Monthly cashflow
- —
- DSCR
- —
- Eligible?
- —
Personal DTI + credit; lowest rate.
DSCR
20% down · 8.5% · 30yr
- Down + closing
- —
- Monthly P&I
- —
- Monthly cashflow
- —
- DSCR
- —
- Eligible?
- —
No personal income docs; deal must DSCR.
Hard money
10% down · 12.0% · 12mo
- Down + closing
- —
- Monthly P&I
- —
- Monthly cashflow
- —
- DSCR
- —
- Eligible?
- —
Short-term bridge; refi at stabilization.
Listing history 20 events
-
2026-06-18days on market $215,000 Active 23 DOM
-
2026-06-17days on market $215,000 Active 22 DOM
-
2026-06-16days on market $215,000 Active 21 DOM
-
2026-06-15pricedays on market $215,000 Active 20 DOM
-
2026-06-13days on market $225,000 Active 18 DOM
-
2026-06-12days on market $225,000 Active 17 DOM
-
2026-06-09days on market $225,000 Active 14 DOM
-
2026-06-08days on market $225,000 Active 13 DOM
-
2026-06-07days on market $225,000 Active 12 DOM
-
2026-06-07days on market $225,000 Active 11 DOM
-
2026-06-04days on market $225,000 Active 8 DOM
-
2026-06-02days on market $225,000 Active 7 DOM
-
2026-06-01days on market $225,000 Active 6 DOM
-
2026-05-31days on market $225,000 Active 5 DOM
-
2026-05-19$225,000 Active
-
2013-02-13soldstatus $72,000
-
2013-02-07soldstatus $72,000 310-char remark
Show marketing remark (310 chars)
QUAINT VILLAGE CAPE. .. This warm & inviting 3 bedroom, 1 3/4 bath home has a formal dining room, solid oak Kraftmade kitchen cabinets w/ breakfast nook, large living room and a charming wraparound covered porch. A full basement with a managable yard that's a short walk to the school, markets and cafes.
-
2012-03-03$72,500 310-char remark
Show marketing remark (310 chars)
QUAINT VILLAGE CAPE. .. This warm & inviting 3 bedroom, 1 3/4 bath home has a formal dining room, solid oak Kraftmade kitchen cabinets w/ breakfast nook, large living room and a charming wraparound covered porch. A full basement with a managable yard that's a short walk to the school, markets and cafes.
-
2010-04-01$95,000
-
1993-10-19soldstatus $41,000
ⓘ Source: listings_history table (triggers on properties + properties_extension) + one-shot
backfill from property_details.listing_events for pre-trigger history.
Tax reassessment forecast NY · Partial reset (capped growth)
- Current annual tax
- $2,837 · $236/mo
- Projected year-2 tax
- $3,235 · $270/mo
- Expected delta
- +$398/yr (+$33/mo · 14.0%)
ⓘ Screening estimate from a state-policy table — verify with the county assessor before closing.
Climate risk First Street
- Flood 6/10 Major FEMA zone X (unshaded) · 72% chance over 30 yrs
- Wildfire 2/10 Low
- Heat 1/10 Low 8 d/yr ≥87°F today · 18 d/yr by 30 yrs out
- Wind 2/10 Low 2% chance of damaging wind over 30 yrs
- Air quality 1/10 Low 0 unhealthy d/yr today · 0 by 30 yrs out
Nearby sold comps map
Loading sold comps map…
Walkable amenities ~0.75 mi
Loading nearby amenities…
Taxation est. · year 1
- Rental income
- $44,067
- − Mortgage interest
- −$12,043
- − Property taxes
- −$2,837
- − Insurance
- −$1,075
- − Repairs & maintenance
- −$3,525
- − Management
- −$3,525
- − Depreciation
- −$6,255
- Taxable income
- $14,807
- Est. tax owed @ 24.0%
- −$3,554
- After-tax cash flow
- $13,818/yr
For passive investors: Depreciation is non-cash, so a rental often shows a tax loss while cash-flowing — sheltering income. Rental losses are passive: they offset passive income freely, and up to $25,000/yr can offset ordinary (W-2) income if you actively participate and your MAGI is under $100k (phasing out to $0 by $150k); unused losses carry forward. On sale, claimed depreciation is recaptured at up to 25%, and gains may owe capital-gains tax (a 1031 exchange can defer both). Figures are a year-1 estimate at your 24.0% rate — not tax advice; consult a CPA.
Schools (NCES district)
- District
- Stamford Central School District
- NCES district ID
- 3628020
- Math proficiency
- 40% ▼ -10.00%
- Reading proficiency
- 35% ▼ -10.00%
- Median HH income
- $42,968
- Composite
- 34.29/100
- National rank
- #10231
- State rank
- #675 of 755 in NY
Livability — Stamford
- Score
- 67/100
- State rank
- #574
- US rank
- #10332
Category grades
Schools grade is shown separately in the Schools card above.
Census & demographics
- Census place
- Stamford, NY
- Population (ZIP)
- 2,257
Population outlook (Delaware County) Hauer SSP2
- Today (2025)
- 42,668 people
- By 2030
- 40,337 · -5.5%
- By 2040
- 35,514 · -16.8%
- By 2050
- 31,265 · -26.7%
- By 2075
- 24,455 · -42.7%
- By 2100
- 19,529 · -54.2%
Race, ethnicity, and origin ACS 2023
- Neighborhood character
- Predominantly White (94%)
- Race & ethnicity
- White 94% Two or more races 4% Hispanic / Latino 2%
- Common ancestry
- Romanian 8% Iranian 3% Lithuanian 2%
- Foreign-born
- 3% · Canada, China
- Languages at home
- 94% English-only · Other Indo-European 3% Spanish 1% Russian/Polish/Slavic 1%
Political lean MEDSL · Delaware
- 2024 margin
- R (+19.8) · D 40.1% · R 59.9%
- 2008→2024 swing
- -14.6pp toward R · 2008: -5.2pp · 2024: -19.8pp
- All cycles
- 2024: R+19.8 2020: R+18.4 2016: R+29.2 2012: R+9.6 2008: R+5.2
Not yet ingested
- Civics
- —
Market trends
- HPI YoY
- ▲ 5.21%
- Current HPI
- 368.4492
- Rent YoY
- —
- Metro
- —
- State GDP YoY
- ▲ 2.60%
- F500 in state
- 92
Industry mix (Fortune 500 HQ in NY)
| Industry | F500 HQs | Revenue |
|---|---|---|
| Financial Services | 10 | $950B |
|
||
| Consumer Goods | 9 | $162B |
|
||
| Insurance | 4 | $225B |
|
||
| Telecommunications | 2 | $144B |
|
||
| Pharmaceuticals | 2 | $112B |
|
||
| Media / Entertainment | 2 | $69B |
|
||
Price history
+448.8% since first listed6 events — show timeline
- 2026-05-19 Listed $225,000 UNYREIS
- 2013-02-13 Sold (Public Records) $72,000 Public Records
- 2013-02-07 Sold (MLS) $72,000 UNYREIS
- 2012-03-03 Listed $72,500 UNYREIS
- 2010-04-01 Listed $95,000 UNYREIS
- 1993-10-19 Sold (Public Records) $41,000 Public Records
Property tax history
+5.2%/yrLatest (2025): $2,837 · +3.0% YoY. Source: county tax records.
Cash-flow waterfall
monthlySold comps — $/sqft
last 12 mo · ≤1 miLoading sold comps…