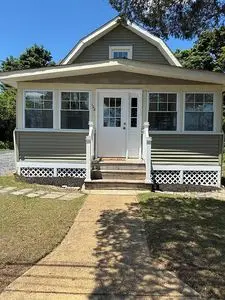
108 Longboat Ave · Beachwood, NJ
Flood risk 1/10 · Minimal
- FEMA flood zone
- X (unshaded)
- Chance of flooding over 30 yrs
- 0.0%
- Est. flood insurance / yr
- $507 – $1,088
Fire risk 4/10 · Minor
- Est. fire insurance / yr
- $526 – $976
Heat risk 7/10 · Major
- Hot days now (above 100°F)
- 7 days/yr
- Hot days in 30 yrs
- 15 days/yr
Wind risk 6/10 · Moderate
- Chance of severe wind over 30 yrs
- 69.0%
Air-quality risk 3/10 · Minor
- Unhealthy air days now
- 3 days/yr
- Unhealthy air days in 30 yrs
- 3 days/yr
Risk factors via First Street. Map © Google.
Why this score? — see what drove the D+ grade
The composite is a weighted blend of 9 inputs, each scored 0–100. Each bar is that input's sub-score; the figure is the points it added to the 100-point composite (weight × sub-score).
- Cash flow +15.4/30.0
- ARV discount +12.1/15.0
- DSCR +4.7/10.0
- 1% rule +3.9/10.0
- Livability +3.6/5.0
- Schools +2.9/10.0
- Rent growth +2.5/5.0
- Condition / age +2.5/5.0
- Appreciation +0.0/10.0
$359,900
🖨 Deal sheet (PDF) 📄 Offer letter ✓ Due diligence
Listing remarks MLS
This home has had some updates including newer windows, roof and heating system. The interior was painted recently and the flooring is in good shape. Could be a good first time buyers home or rental/investment property. Convenient location close to Rt 9 great for commuting. Beachwood is close to the Toms River and has a township beach on the river and not far from the Jersey Shore Beaches and Boardwalks for summer fun.
Key facts
- New stove
- New surround
- Commute from parkway
Tags
Neighborhood map
What this means for you Summary
Snapshot
- This is a 2-bed/1.0-bath single-family listed at $360k.
Deal economics
- At list price, monthly cash flow is $139 ($2k/yr) — positive.
- The deal already cash-flows at list — no discount required.
- To meet the 1% rule (rent ≥ 1% of price), the offer needs to be $322k (10.5% below list).
- Recommended offer: $322k (10.5% below list) — sets the bar for 1% rule.
- Cap rate 6.8% vs local median 3.5% in Beachwood — top-decile yield for the area; either an underpriced asset or a hidden risk that comps aren't pricing in. Stress-test before assuming the spread holds.
Location & tenants
- Location reads 72/100 on livability (#203 in NJ) — a middle-class / working-renter tenant base. Strengths: crime A+, employment A+, housing A+; Watch: amenities F, commute F, cost of living F.
- Toms River Regional School District (suburban): math 18% / reading 44% proficiency, ranked #316 of 472 in NJ (top 67%) — families likely to look elsewhere, expect single-tenant / working-renter base with shorter leases.
- Zoned schools: Pine Beach Elementary School (math 17% / reading 42%, grade F, #731 of 1,303 statewide, top 59%, 401 students, 41% FRL); Toms River Intermediate School South (math 15% / reading 43%, grade F, #321 of 431 statewide, top 77%, 1,048 students, 36% FRL); Toms River High School South (math 18% / reading 43%, grade F, #279 of 399 statewide, top 71%, 1,359 students, 27% FRL).
- Market conditions: 52 active listings in the ZIP; 7 comparable units currently listed for rent nearby; rentals leasing fast (median 8d on market — plan ~1-2 weeks tenant-placement turnaround); 4,434 units permitted in Ocean County in 2024 (868 in 5+ unit buildings).
Forward outlook
- Local home prices are declining (-3.0%/yr); year-one equity from $2k of loan paydown is wiped out by about $11k of value loss. Plan a longer hold.
- Ocean County population projected to shrink 8% by 2050 — rents likely to lag national; underwrite the cash flow, not the appreciation.
Negotiation context
- It's been on market 17 days — a 2% lower offer ($355k) is reasonable based on typical stale-listing flexibility.
- 3 sale attempts since 14y ago with the ask held roughly flat each time — persistent listings suggest the price (not the market) is what's stuck; bring a comps-based counter.
- Current owner paid $90k; list at $360k implies a 298% gain — meaningful room to come down on a strong offer.
Risks & watch-outs
- Watch-outs: built in 1930 — expect roof / HVAC / electrical / plumbing capex.
- Climate carrying-cost: major wind risk, 69% chance of damaging wind over 30y; extreme-heat days projected 7→15/yr by 2055 (HVAC capex compounding) — expect insurance premiums to compound above CPI over the hold.
Questions for the listing agent
- Built in 1930 — when were the roof, HVAC, electrical panel, plumbing, and water heater last replaced?
- Is there a deadline driving the sale (1031 exchange, divorce, estate, relocation)? That informs how much negotiation room exists.
- The area grade is low — what's the realistic commute time and amenity access for the typical tenant pool here? Any planned neighborhood developments (good or bad) we should know about?
- What's the average days-on-market for RENTAL listings here right now (not sales)? A rising rental-DOM trend means longer vacancies and softer asking-rent achievability than the comps imply.
- What's the recent tenant-quality profile in this submarket — average credit score on applications, eviction rate, late-payment / NSF rate, and stable-employment percentage? A property-management company in the area should have these aggregated.
- How much new for-sale + rental construction is in the pipeline within 1–3 miles? Heavy new supply typically softens prices + rents 12–24 months out; constrained supply supports both.
Investment metrics
- 1% rule
- 0.89% ✗
- Cap rate
- 6.76%
- Cash-on-cash
- 1.66%
- DSCR
- 1.07
- GRM
- 9.3
CMA / ARV
- ARV (on-the-fly)
- $400,680
- Comps found
- 12
Show comp detail 12 sales within ~0.75 mi
| Address | Dist | Beds/Ba | Sqft | Sold | Price | $/sf | Match |
|---|---|---|---|---|---|---|---|
| 422 Forepeak Ave | 0.24mi | 2/1.0 | 1,008 (-5%) | 3mo | $385,000 | $382 | 78 |
| 145 Cable Ave | 0.21mi | 3/1.0 (+1) | 1,110 (+5%) | 0mo | $355,000 | $320 | 77 |
| 22 Harpoon St | 0.27mi | 2/1.0 | 958 (-10%) | 0mo | $405,000 | $423 | 71 |
| 718 Barnegat Blvd | 0.22mi | 3/2.0 (+1) | 1,030 (-3%) | 6mo | $350,000 | $340 | 71 |
| 208 Longboat Ave | 0.12mi | 3/2.0 (+1) | 1,144 (+8%) | 4mo | $380,000 | $332 | 69 |
| 224 Tiller Ave | 0.55mi | 2/1.0 | 1,032 (-3%) | 3mo | $390,000 | $378 | 68 |
| 60 Shell St | 0.43mi | 3/1.0 (+1) | 1,040 (-2%) | 6mo | $415,000 | $399 | 67 |
| 308 Seaman Ave | 0.42mi | 2/1.0 | 1,136 (+7%) | 6mo | $366,000 | $322 | 63 |
| 126 Capstan Ave | 0.58mi | 1/1.0 (-1) | 1,033 (-2%) | 1mo | $293,000 | $284 | 63 |
| 65 Shell St | 0.49mi | 2/1.0 | 1,188 (+12%) | 4mo | $470,000 | $396 | 54 |
| 152 Forepeak Ave | 0.53mi | 3/1.0 (+1) | 1,200 (+13%) | 2mo | $433,000 | $361 | 46 |
| 400 Surf Ave | 0.75mi | 3/2.0 (+1) | 1,008 (-5%) | 3mo | $459,900 | $456 | 45 |
Match score weights: distance 35% · size 25% · config 20% · recency 20%. Top-matched comps best support the ARV.
Projected returns pro-forma
-3.0% appreciation · 3.0% rent growth · sell at horizon
- IRR
- -13.7%
- Equity multiple
- 0.51×
- Total profit
- $-49,454
- Equity at exit
- $53,662
- IRR
- -4.8%
- Equity multiple
- 0.69×
- Total profit
- $-31,655
- Equity at exit
- $31,118
Cash invested: $100,772 (down + closing). Projections, not guarantees.
Landlord ↔ Tenant lean methodology
- Overall (STATE)
- 21 Tenant-Leaning
- State New Jersey
- 21 Tenant-Leaning · D+6
- County
- — inherits STATE
- City
- — inherits STATE
ZIP-level market 08722
- Home prices YoY
- -30.3%
- Active inventory
- 52
- Price-to-rent
- 9.3×
Monthly cashflow live
- Estimated rent
- $3,219 high interval (Pro) →
- Mortgage (P&I)
- −$1,887
- Tax from tax record
- −$367 /mo · $4,401/yr
- Insurance
- −$150
- HOA
- −$0
- Vacancy / Maint / Mgmt
- −$676
- Net cashflow
- $139
Break-even live
Sensitivity live
| Price | -10% $343 | -5% $241 | +0% $139 | +5% $37 | +10% $-64 |
|---|---|---|---|---|---|
| Rent | -10% $-115 | -5% $12 | +0% $139 | +5% $266 | +10% $394 |
| Rate | -1.0pp $320 | -0.5pp $231 | base $139 | +0.5pp $46 | +1.0pp $-49 |
UW: 25.0% down · 7.5% · 30yr · 1.5% tax · 5.0% vac · 8.0% maint · 8.0% mgmt
Financing live
Cash to close
- Down payment
- $89,975
- Closing costs
- $10,797
- Reserves months
- —
- Total cash needed
- —
Loan-product check · same deal, 3 products live
Conventional
25% down · 7.5% · 30yr
- Down + closing
- —
- Monthly P&I
- —
- Monthly cashflow
- —
- DSCR
- —
- Eligible?
- —
Personal DTI + credit; lowest rate.
DSCR
20% down · 8.5% · 30yr
- Down + closing
- —
- Monthly P&I
- —
- Monthly cashflow
- —
- DSCR
- —
- Eligible?
- —
No personal income docs; deal must DSCR.
Hard money
10% down · 12.0% · 12mo
- Down + closing
- —
- Monthly P&I
- —
- Monthly cashflow
- —
- DSCR
- —
- Eligible?
- —
Short-term bridge; refi at stabilization.
Rent comps 7 comps
| Address | Beds | Baths | Sqft | Rent | $/sqft | DOM | Units | Dist |
|---|---|---|---|---|---|---|---|---|
| 408 Forepeak Ave Beachwood, NJ | 3.0 | 1.0 | 1138 | $3,500 | $3.08 | 3d | 1 | 0.28mi |
| 254 Admiral Ave Beachwood, NJ | 3.0 | 2.0 | 1400 | $3,250 | $2.32 | 0d | 1 | 0.73mi |
| 744 Cable Ave Beachwood, NJ | 3.0 | 2.0 | 1178 | $3,000 | $2.55 | 45d | 1 | 0.79mi |
| 60 Birch St Beachwood, NJ | 3.0 | 2.0 | 1450 | $2,600 | $1.79 | 45d | 1 | 0.95mi |
| 944 Longboat Ave Beachwood, NJ | 3.0 | 1.5 | 1250 | $2,695 | $2.16 | 13d | 1 | 0.99mi |
| 18 Maiden Ln Toms River, NJ | 3.0 | 1.0 | 1218 | $2,750 | $2.26 | 8d | 1 | 1.03mi |
| 379 Dover Rd Toms River, NJ | 2.0 | 2.0 | 1156 | $4,196 | $3.63 | 0d | 6 | 1.44mi |
Listing history 14 events
-
2026-06-17status $359,900 Under Contract 17 DOM
-
2026-06-16days on market $359,900 Active 17 DOM
-
2026-06-15days on market $359,900 Active 16 DOM
-
2026-06-13days on market $359,900 Active 14 DOM
-
2026-06-13days on market $359,900 Active 13 DOM
-
2026-06-09days on market $359,900 Active 10 DOM
-
2026-06-08days on market $359,900 Active 9 DOM
-
2026-06-07days on market $359,900 Active 8 DOM
-
2026-06-04days on market $359,900 Active 5 DOM
-
2026-06-03days on market $359,900 Active 4 DOM
-
2026-06-02days on market $359,900 Active 3 DOM
-
2026-06-01days on market $359,900 Active 2 DOM
-
2026-05-31remarks 326-char remark
-
2026-05-31$359,900 Active 1 DOM
ⓘ Source: listings_history table (triggers on properties + properties_extension) + one-shot
backfill from property_details.listing_events for pre-trigger history.
Tax reassessment forecast NJ · Partial reset (capped growth)
- Current annual tax
- $4,401 · $367/mo
- Projected year-2 tax
- $6,681 · $557/mo
- Expected delta
- +$2,280/yr (+$190/mo · 51.8%)
ⓘ Screening estimate from a state-policy table — verify with the county assessor before closing.
Climate risk First Street
- Flood 1/10 Low FEMA zone X (unshaded) · 0% chance over 30 yrs
- Wildfire 4/10 Moderate
- Heat 7/10 Severe 7 d/yr ≥100°F today · 15 d/yr by 30 yrs out
- Wind 6/10 Major 69% chance of damaging wind over 30 yrs
- Air quality 3/10 Moderate 3 unhealthy d/yr today · 3 by 30 yrs out
Nearby sold comps map
Loading sold comps map…
Walkable amenities ~0.75 mi
Loading nearby amenities…
Taxation est. · year 1
- Rental income
- $38,633
- − Mortgage interest
- −$20,160
- − Property taxes
- −$4,401
- − Insurance
- −$1,800
- − Repairs & maintenance
- −$3,091
- − Management
- −$3,091
- − Depreciation
- −$10,470
- Taxable loss
- −$4,379
- Est. tax savings @ 24.0%
- +$1,051
- After-tax cash flow
- $2,722/yr
For passive investors: Depreciation is non-cash, so a rental often shows a tax loss while cash-flowing — sheltering income. Rental losses are passive: they offset passive income freely, and up to $25,000/yr can offset ordinary (W-2) income if you actively participate and your MAGI is under $100k (phasing out to $0 by $150k); unused losses carry forward. On sale, claimed depreciation is recaptured at up to 25%, and gains may owe capital-gains tax (a 1031 exchange can defer both). Figures are a year-1 estimate at your 24.0% rate — not tax advice; consult a CPA.
Schools (NCES district)
- District
- Toms River Regional School District
- NCES district ID
- 3416230
- Math proficiency
- 18% ▼ -19.00%
- Reading proficiency
- 44% ▼ -10.00%
- Median HH income
- $72,370
- Composite
- 29.07/100
- National rank
- #6602
- State rank
- #316 of 472 in NJ
Livability — Beachwood
- Score
- 72/100
- State rank
- #203
- US rank
- #5721
Category grades
Schools grade is shown separately in the Schools card above.
Census & demographics
- Census place
- Beachwood, NJ
- City population
- 11,002
- Population (ZIP)
- 11,002
Population outlook (Ocean County) Hauer SSP2
- Today (2025)
- 586,991 people
- By 2030
- 581,403 · -1.0%
- By 2040
- 564,913 · -3.8%
- By 2050
- 538,149 · -8.3%
- By 2075
- 468,845 · -20.1%
- By 2100
- 350,297 · -40.3%
Race, ethnicity, and origin ACS 2023
- Neighborhood character
- Predominantly White (78%)
- Race & ethnicity
- White 78% Hispanic / Latino 14% Two or more races 8% Black 4% Asian 1%
- Hispanic origin (detail)
- Mexican 3% Puerto Rican 4% Dominican 1%
- Common ancestry
- Romanian 11% Scotch-Irish 1% Serbian 1%
- Foreign-born
- 7% · Canada, Jamaica
- Languages at home
- 90% English-only · Spanish 7% Other Indo-European 1% French/Haitian/Cajun 1%
Political lean MEDSL · Ocean
- 2024 margin
- Solid R (+36.0) · D 31.4% · R 67.4% · Other 1.2%
- 2008→2024 swing
- -17.6pp toward R · 2008: -18.4pp · 2024: -36.0pp
- All cycles
- 2024: R+36.0 2020: R+28.7 2016: R+34.0 2012: R+17.7 2008: R+18.4
Not yet ingested
- Civics
- —
Market trends
- HPI YoY
- ▼ -170.97%
- Current HPI
- 393.5736
- Rent YoY
- —
- Metro
- —
- State GDP YoY
- ▲ 2.05%
- F500 in state
- 34
Industry mix (Fortune 500 HQ in NJ)
| Industry | F500 HQs | Revenue |
|---|---|---|
| Consumer Goods | 3 | $31B |
|
||
| Pharmaceuticals | 2 | $153B |
|
||
| Technology | 2 | $21B |
|
||
| Insurance | 2 | $20B |
|
||
| Healthcare | 2 | $19B |
|
||
| Financial Services | 1 | $70B |
|
||
Price history
+323.4% since first listed8 events — show timeline
- 2026-05-31 Listed $359,900 FSBO.com
- 2014-12-19 Sold (MLS) $90,500 MOMLS
- 2014-12-18 Sold (Public Records) $90,500 Public Records
- 2014-04-11 Listed $95,000 MOMLS
- 2012-04-10 Listed $125,000 MOMLS
- 2006-03-08 Sold (Public Records) $205,000 Public Records
- 2005-05-20 Sold (Public Records) $145,000 Public Records
- 2005-02-24 Sold (Public Records) $85,000 Public Records
Property tax history
+2.5%/yrLatest (2025): $4,401 · +9.7% YoY. Source: county tax records.
Cash-flow waterfall
monthlySold comps — $/sqft
last 12 mo · ≤1 miLoading sold comps…