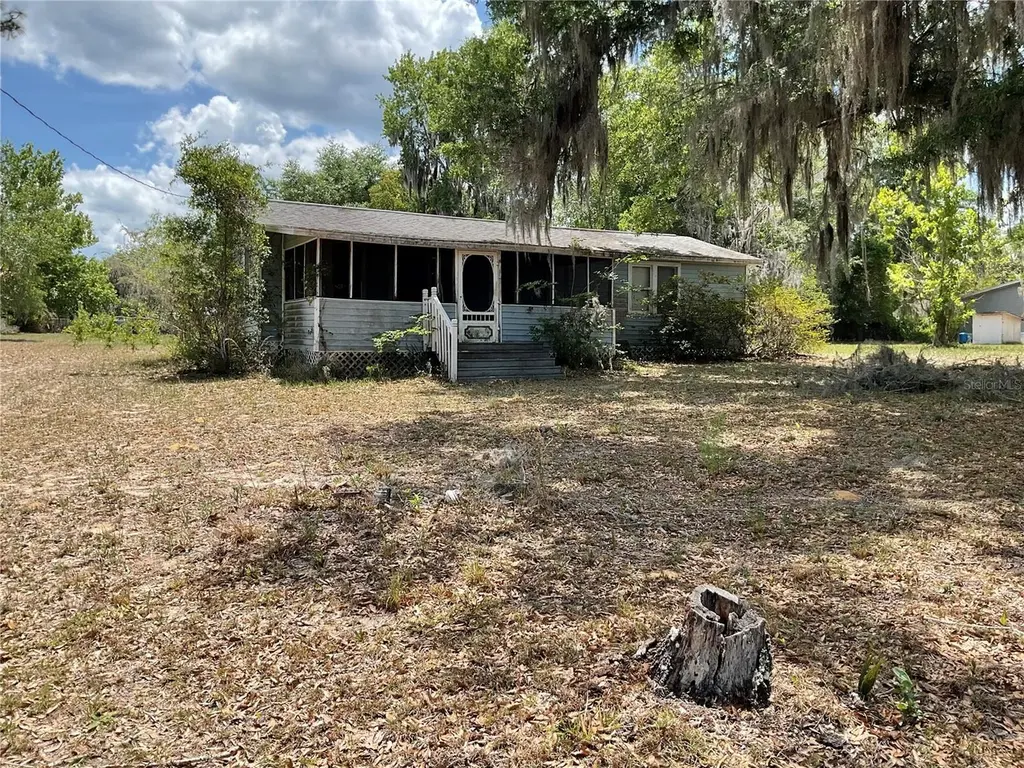
24642 NE 177th Ter · Interlachen, FL
Flood risk 1/10 · Minimal
- FEMA flood zone
- X (unshaded)
- Chance of flooding over 30 yrs
- 0.0%
- Est. flood insurance / yr
- $507 – $1,088
Fire risk 6/10 · Moderate
- Est. fire insurance / yr
- $947 – $1,759
Heat risk 8/10 · Major
- Hot days now (above 109°F)
- 7 days/yr
- Hot days in 30 yrs
- 21 days/yr
Wind risk 9/10 · Severe
- Chance of severe wind over 30 yrs
- 99.0%
Air-quality risk 2/10 · Minimal
- Unhealthy air days now
- 2 days/yr
- Unhealthy air days in 30 yrs
- 2 days/yr
Risk factors via First Street. Map © Google.
Why this score? — see what drove the B grade
The composite is a weighted blend of 9 inputs, each scored 0–100. Each bar is that input's sub-score; the figure is the points it added to the 100-point composite (weight × sub-score).
- Cash flow +28.9/30.0
- ARV discount +15.0/15.0
- DSCR +10.0/10.0
- 1% rule +8.1/10.0
- Schools +3.6/10.0
- Livability +3.4/5.0
- Rent growth +2.5/5.0
- Condition / age +2.5/5.0
- Appreciation +0.0/10.0
$110,000
🖨 Deal sheet 📄 Offer letter ✓ Due diligence
Listing remarks
Escape to your own private oasis in the heart of the Ocala National Forest! This charming 2-bedroom, 2-bathroom home is nestled on nearly a full acre of serene, wooded land in this quiet rural community. Whether you're seeking a peaceful primary residence or a weekend getaway, you'll love being within walking distance of the community boat ramp to the Ocklawaha River. Spend your days fishing the world-famous Rodman Recreation Area, hiking the Florida Trail, or exploring the countless springs nearby. With a garage / workshop for all your gear, this is the ultimate home base for outdoor enthusiasts! Or this could be an amazing investment opportunity with the extra . 38 of an acre connected l
Key facts
- 0.96 acre lot
- Built 1963
- Listed 43 days
Property features AI
Finance
- Other: Property type: Residential, single family; Zoning: R4; Unfurnished; One well and one septic on the property; Universal property ID available
- Financial info: No additional financial details provided
- HOA & community: No HOA or association
Exterior
- Parking: No parking details listed
- Security: No security features listed
- Utilities: Well water; Septic tank; Electricity connected; Water connected
- Home design: Single family residence; One story; Northeast-facing entry
- Construction: Vinyl siding; Shingle roof; Pillar/post/pier foundation; Built area reported (building area total 1,295 sq ft)
- Exterior features: Dirt road access; Nearly 1 acre lot (approximately 0.96 acres); Lot dimensions roughly 166 x 252
Interior
- Kitchen: Range; Refrigerator
- Bedrooms: 2 bedrooms (one-level home)
- Flooring: Carpet; Linoleum; Wood
- Bathrooms: 2 full bathrooms
- Heating & cooling: Heating: Other; Cooling: Wall/window unit(s)
- Interior features: No additional interior features listed
- Laundry & utility: Laundry located inside
Neighborhood map
What this means for you Summary
Snapshot
- This is a 2-bed/1.0-bath single-family listed at $110k.
Deal economics
- At list price, monthly cash flow is $373 ($4k/yr) — positive.
- The deal already cash-flows at list — no discount required.
- Meets the 1% rule at list price ($1k rent vs $110k).
- Recommended offer: $107k (3.0% below list) — sets the bar for market timing.
- Cap rate 10.4% vs local median 5.6% in Interlachen — top-decile yield for the area; either an underpriced asset or a hidden risk that comps aren't pricing in. Stress-test before assuming the spread holds.
Location & tenants
- Location reads 67/100 on livability (#540 in FL) — a middle-class / working-renter tenant base. Strengths: crime A+, cost of living A+, housing A+; Watch: schools D-, amenities F, commute F.
- Marion (rural): math 42% / reading 43% proficiency, ranked #61 of 73 in FL (top 84%) — families likely to look elsewhere, expect single-tenant / working-renter base with shorter leases; 61% free/reduced lunch — lower-income household profile, screen leases tightly.
- Market conditions: 299 active listings in the ZIP; 7,071 units permitted in Marion County in 2024 (534 in 5+ unit buildings).
Forward outlook
- Local home prices are declining (-3.0%/yr); year-one equity from $761 of loan paydown is wiped out by about $3k of value loss. Plan a longer hold.
- Marion County population projected at +13% by 2050 — modest demand growth; plan on rents tracking national, not racing it.
- At projected returns (-3.0% appreciation + 3.0% rent growth), your $31k cash investment doubles in ~9 years — after that, you're playing with house money.
Negotiation context
- It's been on market 43 days — a 3% lower offer ($107k) is reasonable based on typical stale-listing flexibility.
- Current owner paid $41k; list at $110k implies a 170% gain — meaningful room to come down on a strong offer.
Risks & watch-outs
- Climate carrying-cost: severe wind risk, 99% chance of damaging wind over 30y; major wildfire risk; extreme-heat days projected 7→21/yr by 2055 (HVAC capex compounding) — expect insurance premiums to compound above CPI over the hold.
Questions for the listing agent
- It's been on market 43 days. Have you received any prior offers? Is the seller open to a 3% concession, seller financing, or rate buy-down credit?
- Built in 1963 — when were the roof, HVAC, electrical panel, plumbing, and water heater last replaced?
- Is there a deadline driving the sale (1031 exchange, divorce, estate, relocation)? That informs how much negotiation room exists.
- Schools are D-rated, which usually means shorter tenancies and higher turnover. Who's the typical renter profile here, and what's been the actual vacancy rate?
- What's the average days-on-market for RENTAL listings here right now (not sales)? A rising rental-DOM trend means longer vacancies and softer asking-rent achievability than the comps imply.
- What's the recent tenant-quality profile in this submarket — average credit score on applications, eviction rate, late-payment / NSF rate, and stable-employment percentage? A property-management company in the area should have these aggregated.
- How much new for-sale + rental construction is in the pipeline within 1–3 miles? Heavy new supply typically softens prices + rents 12–24 months out; constrained supply supports both.
Investment metrics
- 1% rule
- 1.31% ✓
- Cap rate
- 10.37%
- Cash-on-cash
- 14.55%
- DSCR
- 1.65
- GRM
- 6.4
CMA / ARV
- ARV (median comp)
- $171,378
- List price
- $110,000
- Delta
- -35.81%
- Verdict
- UNDERPRICED
- Comps
- 1 within 2.0 mi
Projected returns pro-forma
-3.0% appreciation · 3.0% rent growth · sell at horizon
- IRR
- 5.0%
- Equity multiple
- 1.19×
- Total profit
- $5,988
- Equity at exit
- $16,401
- IRR
- 14.5%
- Equity multiple
- 2.17×
- Total profit
- $35,947
- Equity at exit
- $9,511
Cash invested: $30,800 (down + closing). Projections, not guarantees.
Landlord ↔ Tenant lean methodology
- Overall (STATE)
- 87 Strongly Landlord-Friendly
- State Florida
- 87 Strongly Landlord-Friendly · R+3
- County
- — inherits STATE
- City
- — inherits STATE
ZIP-level market 32134
- Home prices YoY
- -24.4%
- Active inventory
- 299
- Price-to-rent
- 6.4×
Monthly cashflow live
- Estimated rent
- $1,441 medium interval (Pro) →
- Mortgage (P&I)
- −$577
- Tax from tax record
- −$143 /mo · $1,711/yr
- Insurance
- −$46
- HOA
- −$0
- Vacancy / Maint / Mgmt
- −$303
- Net cashflow
- $373
Break-even live
UW: 25.0% down · 7.5% · 30yr · 1.5% tax · 5.0% vac · 8.0% maint · 8.0% mgmt
Financing live
Cash to close
- Down payment
- $27,500
- Closing costs
- $3,300
- Reserves months
- —
- Total cash needed
- —
Loan-product check · same deal, 3 products live
Conventional
25% down · 7.5% · 30yr
- Down + closing
- —
- Monthly P&I
- —
- Monthly cashflow
- —
- DSCR
- —
- Eligible?
- —
Personal DTI + credit; lowest rate.
DSCR
20% down · 8.5% · 30yr
- Down + closing
- —
- Monthly P&I
- —
- Monthly cashflow
- —
- DSCR
- —
- Eligible?
- —
No personal income docs; deal must DSCR.
Hard money
10% down · 12.0% · 12mo
- Down + closing
- —
- Monthly P&I
- —
- Monthly cashflow
- —
- DSCR
- —
- Eligible?
- —
Short-term bridge; refi at stabilization.
Listing history 18 events
-
2026-06-18status $110,000 Pending 43 DOM
-
2026-06-18days on market $110,000 Active 43 DOM
-
2026-06-17days on market $110,000 Active 42 DOM
-
2026-06-16days on market $110,000 Active 41 DOM
-
2026-06-15days on market $110,000 Active 40 DOM
-
2026-06-14days on market $110,000 Active 38 DOM
-
2026-06-13days on market $110,000 Active 37 DOM
-
2026-06-10days on market $110,000 Active 35 DOM
-
2026-06-09days on market $110,000 Active 34 DOM
-
2026-06-08days on market $110,000 Active 33 DOM
-
2026-06-07days on market $110,000 Active 32 DOM
-
2026-06-03days on market $110,000 Active 28 DOM
-
2026-06-02days on market $110,000 Active 27 DOM
-
2026-06-01days on market $110,000 Active 26 DOM
-
2026-05-31days on market $110,000 Active 25 DOM
-
2026-05-30days on market $110,000 Active 24 DOM
-
2026-05-06$110,000 Active 1251-char remark
-
1997-06-10soldstatus $40,800
ⓘ Source: listings_history table (triggers on properties + properties_extension) + one-shot
backfill from property_details.listing_events for pre-trigger history.
Tax reassessment forecast FL · Resets to sale price
- Current annual tax
- $1,711 · $143/mo
- Projected year-2 tax
- $1,711 · $143/mo
- Expected delta
- $0/yr ($0/mo · 0.0%)
ⓘ Screening estimate from a state-policy table — verify with the county assessor before closing.
Climate risk First Street
- Flood 1/10 Low FEMA zone X (unshaded) · 0% chance over 30 yrs
- Wildfire 6/10 Major
- Heat 8/10 Severe 7 d/yr ≥109°F today · 21 d/yr by 30 yrs out
- Wind 9/10 Extreme 99% chance of damaging wind over 30 yrs
- Air quality 2/10 Low 2 unhealthy d/yr today · 2 by 30 yrs out
Nearby sold comps map
Loading sold comps map…
Walkable amenities ~0.75 mi
Loading nearby amenities…
Taxation est. · year 1
- Rental income
- $17,298
- − Mortgage interest
- −$6,162
- − Property taxes
- −$1,711
- − Insurance
- −$550
- − Repairs & maintenance
- −$1,384
- − Management
- −$1,384
- − Depreciation
- −$3,200
- Taxable income
- $2,907
- Est. tax owed @ 24.0%
- −$698
- After-tax cash flow
- $3,784/yr
For passive investors: Depreciation is non-cash, so a rental often shows a tax loss while cash-flowing — sheltering income. Rental losses are passive: they offset passive income freely, and up to $25,000/yr can offset ordinary (W-2) income if you actively participate and your MAGI is under $100k (phasing out to $0 by $150k); unused losses carry forward. On sale, claimed depreciation is recaptured at up to 25%, and gains may owe capital-gains tax (a 1031 exchange can defer both). Figures are a year-1 estimate at your 24.0% rate — not tax advice; consult a CPA.
Schools (NCES district)
- District
- Marion
- NCES district ID
- 1201260
- Math proficiency
- 42% ▼ -7.00%
- Reading proficiency
- 43% ▼ -4.00%
- Median HH income
- $40,015
- Composite
- 35.61/100
- National rank
- #4890
- State rank
- #61 of 73 in FL
Livability — Interlachen
- Score
- 67/100
- State rank
- #540
- US rank
- #10162
Category grades
Schools grade is shown separately in the Schools card above.
Census & demographics
- City population
- 11,580
- Population (ZIP)
- 7,400
Population outlook (Marion County) Hauer SSP2
- Today (2025)
- 365,905 people
- By 2030
- 376,768 · +3.0%
- By 2040
- 396,555 · +8.4%
- By 2050
- 412,723 · +12.8%
- By 2075
- 446,090 · +21.9%
- By 2100
- 436,193 · +19.2%
Race, ethnicity, and origin ACS 2023
- Neighborhood character
- Predominantly White (91%)
- Race & ethnicity
- White 91% Hispanic / Latino 5% Two or more races 4%
- Common ancestry
- Italian 3% Slovak 2% Lithuanian 2%
- Foreign-born
- 3% · Canada
- Languages at home
- 95% English-only · Spanish 3% French/Haitian/Cajun 1%
Political lean MEDSL · Marion
- 2024 margin
- Solid R (+31.6) · D 33.8% · R 65.5%
- 2008→2024 swing
- -20.0pp toward R · 2008: -11.6pp · 2024: -31.6pp
- All cycles
- 2024: R+31.6 2020: R+25.9 2016: R+26.2 2012: R+16.2 2008: R+11.6
Not yet ingested
- Civics
- —
Market trends
- HPI YoY
- ▼ -72.45%
- Current HPI
- 224.9549
- Rent YoY
- —
- Metro
- —
- State GDP YoY
- ▲ 3.28%
- F500 in state
- 36
Industry mix (Fortune 500 HQ in FL)
| Industry | F500 HQs | Revenue |
|---|---|---|
| Industrial Technology | 2 | $29B |
|
||
| Insurance | 2 | $17B |
|
||
| Retail | 1 | $60B |
|
||
| Technology Distribution | 1 | $58B |
|
||
| Homebuilding | 1 | $35B |
|
||
| Technology Manufacturing | 1 | $35B |
|
||
Price history
+169.6% since first listed3 events — show timeline
- 2026-06-18 Pending — Stellar MLS as Distributed by MLS Grid
- 2026-05-06 Listed $110,000 Stellar MLS as Distributed by MLS Grid
- 1997-06-10 Sold (Public Records) $40,800 Public Records
Property tax history
+7.0%/yrLatest (2025): $1,711 · +15.6% YoY. Source: county tax records.
Cash-flow waterfall
monthlySold comps — $/sqft
last 12 mo · ≤1 miLoading sold comps…