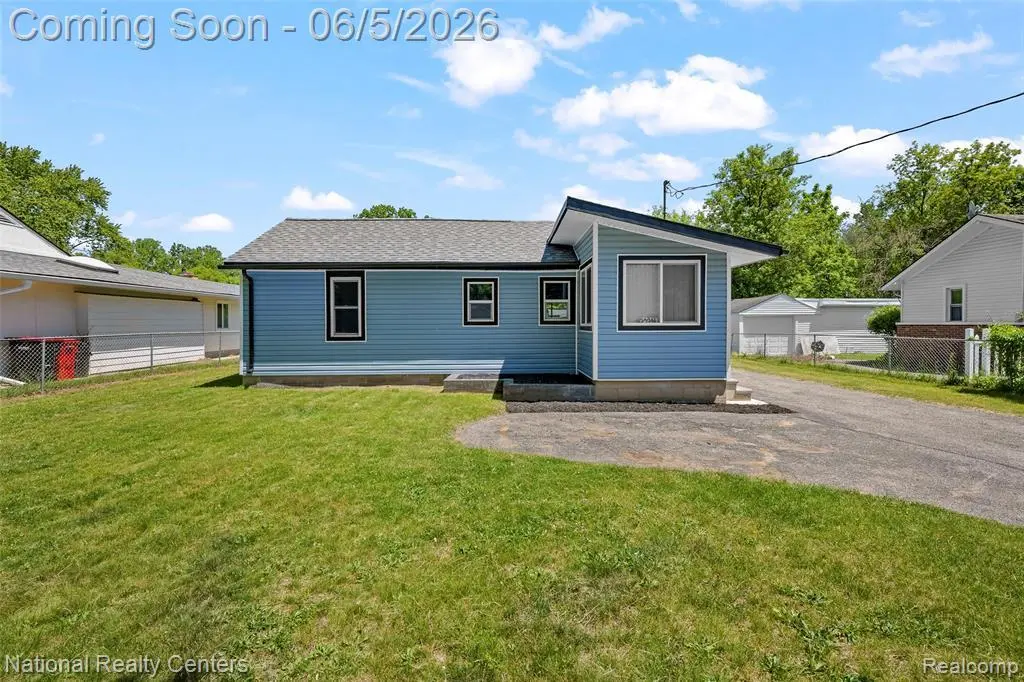
23284 Almira St · Southfield, MI
Flood risk No data
- FEMA flood zone
- —
- Chance of flooding over 30 yrs
- —
- Est. flood insurance / yr
- —
Fire risk No data
- Est. fire insurance / yr
- —
Heat risk No data
- Hot days now (above threshold)
- —
- Hot days in 30 yrs
- —
Wind risk No data
- Chance of severe wind over 30 yrs
- —
Air-quality risk No data
- Unhealthy air days now
- —
- Unhealthy air days in 30 yrs
- —
Risk factors via First Street. Map © Google.
Why this score? — see what drove the B- grade
The composite is a weighted blend of 9 inputs, each scored 0–100. Each bar is that input's sub-score; the figure is the points it added to the 100-point composite (weight × sub-score).
- Cash flow +25.5/30.0
- ARV discount +15.0/15.0
- DSCR +8.4/10.0
- 1% rule +6.6/10.0
- Livability +3.6/5.0
- Condition / age +2.5/5.0
- Schools +2.4/10.0
- Rent growth +2.0/5.0
- Appreciation +0.0/10.0
$140,000
🖨 Deal sheet 📄 Offer letter ✓ Due diligence
Listing remarks MLS
CALLING ALL INVESTORS!! THIS IS IT. .. LOOK NO FURTHER AN EXCEPTIONAL INVESTMENT PROPERTY SITS ON 0.47 ACRES OF LAND A 3 BEDROOM 1 FULL BATH RANCH WITH DETACHED LARGE GARAGE. SCHEDULE YOUR PRIVATE SHOWING TODAY! THIS PROPERTY WON'T LAST LONG! HOME IS BEING SOLD AS-IS. BATVAI.
Key facts
- 1.43 acre lot
- 2 garage spots
- Built 1938
Property features AI
Finance
- Other: Located in Southfield (City); east side of the street; directions: N of 9 Mile Rd, W of Telegraph Rd, E of Beech St.
Exterior
- Parking: Detached 2-car garage
- Utilities: Natural gas heat; Public water; Public sewer (assumed from public water listing and typical municipal services)
- Home design: Residential single-story home; Built in 1938; Entry-level living
- Construction: Vinyl-sided construction; Crawl foundation
- Exterior features: Vinyl siding; Paved street access; Frontage approximately 30 ft; Approximately 1.43 acres
Interior
- Bedrooms: Three bedrooms on the entry level (approximate dimensions: two at 9 x 10; one about 10 ft wide)
- Flooring: Bedroom and bathroom floor coverings listed as Other
- Bathrooms: One full bathroom on the entry level (approx. 7 x 8)
- Heating & cooling: Forced air heating; Central A/C
- Interior features: Total of 4 rooms
Neighborhood map
What this means for you Summary
Snapshot
- This is a 3-bed/1.0-bath single-family listed at $140k.
Deal economics
- At list price, monthly cash flow is $327 ($4k/yr) — positive.
- The deal already cash-flows at list — no discount required.
- Meets the 1% rule at list price ($2k rent vs $140k).
- Cap rate 9.1% vs local median 4.4% in Southfield — top-decile yield for the area; either an underpriced asset or a hidden risk that comps aren't pricing in. Stress-test before assuming the spread holds.
Location & tenants
- Location reads 72/100 on livability (#248 in MI) — a middle-class / working-renter tenant base. Strengths: commute A+, cost of living A+, housing A+; Watch: schools D, health & safety D, crime F.
- Southfield Public School District (urban): math 17% / reading 37% proficiency, ranked #392 of 540 in MI (top 73%) — low school quality limits family demand, transient renter base, plan for 1-2y turnover.
- Market conditions: Rents soft (-2.0%/yr); 80 active listings in the ZIP; 11 comparable units currently listed for rent nearby; rentals at typical pace (median 24d on market — plan ~3-4 weeks tenant-placement turnaround); 2,614 units permitted in Oakland County in 2024 (721 in 5+ unit buildings).
- This rent runs 32% of the median local income ($61k/yr) — at the standard rent-burdened threshold; future hikes will face affordability resistance.
Forward outlook
- Local home prices are declining (-3.0%/yr); year-one equity from $968 of loan paydown is wiped out by about $4k of value loss. Plan a longer hold.
- Oakland County population projected at +10% by 2050 — modest demand growth; plan on rents tracking national, not racing it.
Negotiation context
- Only 14 days on market — expect competitive offers; lowballing is unlikely to land.
- 2 sale attempts since 3y ago; this cycle's ask is 77% above the opening price — seller raised mid-cycle; expect resistance to lowballs.
- Current owner paid $66k; list at $140k implies a 112% gain — meaningful room to come down on a strong offer.
Risks & watch-outs
- Watch-outs: built in 1938 — expect roof / HVAC / electrical / plumbing capex.
Questions for the listing agent
- Built in 1938 — when were the roof, HVAC, electrical panel, plumbing, and water heater last replaced?
- Is there a deadline driving the sale (1031 exchange, divorce, estate, relocation)? That informs how much negotiation room exists.
- Schools are D-rated, which usually means shorter tenancies and higher turnover. Who's the typical renter profile here, and what's been the actual vacancy rate?
- Crime grade is F in this area — have there been break-ins, vandalism, or insurance claims at this property in the last 3 years? What carrier currently insures it and at what premium?
- What's the average days-on-market for RENTAL listings here right now (not sales)? A rising rental-DOM trend means longer vacancies and softer asking-rent achievability than the comps imply.
- What's the recent tenant-quality profile in this submarket — average credit score on applications, eviction rate, late-payment / NSF rate, and stable-employment percentage? A property-management company in the area should have these aggregated.
- How much new for-sale + rental construction is in the pipeline within 1–3 miles? Heavy new supply typically softens prices + rents 12–24 months out; constrained supply supports both.
Investment metrics
- 1% rule
- 1.16% ✓
- Cap rate
- 9.09%
- Cash-on-cash
- 10.00%
- DSCR
- 1.44
- GRM
- 7.2
CMA / ARV
- ARV (on-the-fly)
- $183,876
- Comps found
- 7
Show comp detail 7 sales within ~0.75 mi
| Address | Dist | Beds/Ba | Sqft | Sold | Price | $/sf | Match |
|---|---|---|---|---|---|---|---|
| 23318 Churches St | 0.21mi | 2/1.0 (-1) | 1,200 (+0%) | 6mo | $142,000 | $118 | 79 |
| 24220 Sunnypoint Dr | 0.51mi | 3/1.5 | 1,167 (-2%) | 4mo | $180,000 | $154 | 67 |
| 23128 Almira St | 0.07mi | 3/2.0 | 1,320 (+11%) | 18mo | $190,000 | $144 | 60 |
| 23409 Bush St | 0.45mi | 3/1.0 | 1,249 (+5%) | 17mo | $195,000 | $156 | 57 |
| 24951 W 9 Mile Rd | 0.22mi | 3/1.0 | 1,032 (-14%) | 16mo | $244,000 | $236 | 54 |
| 24291 Sargent Ave | 0.33mi | 2/2.0 (-1) | 1,363 (+14%) | 16mo | $210,000 | $154 | 39 |
| 23440 Beech Rd | 0.63mi | 3/1.0 | 1,287 (+8%) | 23mo | $220,000 | $171 | 38 |
Match score weights: distance 35% · size 25% · config 20% · recency 20%. Top-matched comps best support the ARV.
Projected returns pro-forma
-3.0% appreciation · 0.0% rent growth · sell at horizon
- IRR
- -4.7%
- Equity multiple
- 0.83×
- Total profit
- $-6,618
- Equity at exit
- $20,874
- IRR
- 1.1%
- Equity multiple
- 1.07×
- Total profit
- $2,734
- Equity at exit
- $12,105
Cash invested: $39,200 (down + closing). Projections, not guarantees.
Landlord ↔ Tenant lean methodology
- Overall (STATE)
- 62 Landlord-Friendly
- State Michigan
- 62 Landlord-Friendly · EVEN
- County
- — inherits STATE
- City
- — inherits STATE
ZIP-level market 48033
- Rents YoY
- -2.0%
- Active inventory
- 80
- Price-to-rent
- 7.2×
Monthly cashflow live
- Estimated rent
- $1,620 high interval (Pro) →
- Mortgage (P&I)
- −$734
- Tax from tax record
- −$161 /mo · $1,931/yr
- Insurance
- −$58
- HOA
- −$0
- Vacancy / Maint / Mgmt
- −$340
- Net cashflow
- $327
Break-even live
UW: 25.0% down · 7.5% · 30yr · 1.5% tax · 5.0% vac · 8.0% maint · 8.0% mgmt
Financing live
Cash to close
- Down payment
- $35,000
- Closing costs
- $4,200
- Reserves months
- —
- Total cash needed
- —
Loan-product check · same deal, 3 products live
Conventional
25% down · 7.5% · 30yr
- Down + closing
- —
- Monthly P&I
- —
- Monthly cashflow
- —
- DSCR
- —
- Eligible?
- —
Personal DTI + credit; lowest rate.
DSCR
20% down · 8.5% · 30yr
- Down + closing
- —
- Monthly P&I
- —
- Monthly cashflow
- —
- DSCR
- —
- Eligible?
- —
No personal income docs; deal must DSCR.
Hard money
10% down · 12.0% · 12mo
- Down + closing
- —
- Monthly P&I
- —
- Monthly cashflow
- —
- DSCR
- —
- Eligible?
- —
Short-term bridge; refi at stabilization.
Rent comps 11 comps
| Address | Beds | Baths | Sqft | Rent | $/sqft | DOM | Units | Dist |
|---|---|---|---|---|---|---|---|---|
| 22419 Fairway Dr Southfield, MI | 3.0 | 1.0 | 1262 | $1,850 | $1.47 | 24d | 1 | 0.85mi |
| 23741 Pond Rd Southfield, MI | 1.0–2.0 | 1.0–2.0 | 1189 | $1,786 | $1.50 | 1d | 13 | 0.90mi |
| 25400 Basin St Southfield, MI | 1.0–2.0 | 1.0 | 825 | $1,400 | $1.70 | 5d | 11 | 0.99mi |
| 25740 Shiawassee St Southfield, MI | 1.0–2.0 | 1.0 | 850 | $1,253 | $1.47 | 43d | 10 | 1.05mi |
| 23404 Plum Hollow St Southfield, MI | 3.0 | 1.5 | 1050 | $2,000 | $1.90 | 24d | 1 | 1.19mi |
| 23411 W Eight Mile Rd Detroit, MI | 1.0–2.0 | 1.0 | 742 | $1,000 | $1.35 | 43d | 1 | 1.32mi |
| 20410 Five Points St Redford, MI | 3.0 | 1.0 | 950 | $1,600 | $1.68 | 5d | 1 | 1.33mi |
| 24111 Civic Center Dr Southfield, MI | 1.0–2.0 | 1.0–2.0 | 810 | $1,350 | $1.67 | 43d | 27 | 1.35mi |
| 20083 Salem St Detroit, MI | 3.0 | 1.0 | 969 | $1,050 | $1.08 | 5d | 1 | 1.38mi |
| 20083 Salem St Detroit, MI | 3.0 | 1.0 | 969 | $1,050 | $1.08 | 10d | 1 | 1.38mi |
| 21642 Hidden Rivers Dr S #27 Southfield, MI | 3.0 | 2.5 | 1354 | $2,100 | $1.55 | 43d | 1 | 1.46mi |
Listing history 12 events
-
2026-06-18days on market $140,000 Active 14 DOM
-
2026-06-17days on market $140,000 Active 13 DOM
-
2026-06-16days on market $140,000 Active 12 DOM
-
2026-06-15days on market $140,000 Active 11 DOM
-
2026-06-13days on market $140,000 Active 9 DOM
-
2026-06-13days on market $140,000 Active 8 DOM
-
2026-06-09days on market $140,000 Active 5 DOM
-
2026-06-08days on market $140,000 Active 4 DOM
-
2026-06-07statusdays on market $140,000 Active 3 DOM
-
2026-06-04days on market $140,000 Coming Soon 2 DOM
-
2026-06-03remarks 699-char remark
-
2026-06-03$140,000 Coming Soon 1 DOM
ⓘ Source: listings_history table (triggers on properties + properties_extension) + one-shot
backfill from property_details.listing_events for pre-trigger history.
Tax reassessment forecast MI · Partial reset (capped growth)
- Current annual tax
- $1,931 · $161/mo
- Projected year-2 tax
- $2,044 · $170/mo
- Expected delta
- +$112/yr (+$9/mo · 5.8%)
ⓘ Screening estimate from a state-policy table — verify with the county assessor before closing.
Nearby sold comps map
Loading sold comps map…
Walkable amenities ~0.75 mi
Loading nearby amenities…
Taxation est. · year 1
- Rental income
- $19,444
- − Mortgage interest
- −$7,842
- − Property taxes
- −$1,931
- − Insurance
- −$700
- − Repairs & maintenance
- −$1,555
- − Management
- −$1,555
- − Depreciation
- −$4,073
- Taxable income
- $1,786
- Est. tax owed @ 24.0%
- −$429
- After-tax cash flow
- $3,490/yr
For passive investors: Depreciation is non-cash, so a rental often shows a tax loss while cash-flowing — sheltering income. Rental losses are passive: they offset passive income freely, and up to $25,000/yr can offset ordinary (W-2) income if you actively participate and your MAGI is under $100k (phasing out to $0 by $150k); unused losses carry forward. On sale, claimed depreciation is recaptured at up to 25%, and gains may owe capital-gains tax (a 1031 exchange can defer both). Figures are a year-1 estimate at your 24.0% rate — not tax advice; consult a CPA.
Schools (NCES district)
- District
- Southfield Public School District
- NCES district ID
- 2632310
- Math proficiency
- 17% ▼ -3.00%
- Reading proficiency
- 37% ▲ 1.00%
- Median HH income
- $51,400
- Composite
- 23.77/100
- National rank
- #7814
- State rank
- #392 of 540 in MI
Livability — Southfield
- Score
- 72/100
- State rank
- #248
- US rank
- #6175
Category grades
Schools grade is shown separately in the Schools card above.
Census & demographics
- Census place
- Southfield, MI
- County
- Oakland County · 1,009,092 people
- City population
- 54,914
- Metro
- Detroit-Warren-Dearborn, MI
- Population (ZIP)
- 17,277
- Household income
- $61,016
- Rent vs Own
- Severe rent burden
- 1166.0
Population outlook (Oakland County) Hauer SSP2
- Today (2025)
- 1,335,747 people
- By 2030
- 1,375,100 · +2.9%
- By 2040
- 1,435,385 · +7.5%
- By 2050
- 1,469,250 · +10.0%
- By 2075
- 1,531,946 · +14.7%
- By 2100
- 1,450,485 · +8.6%
Race, ethnicity, and origin ACS 2023
- Neighborhood character
- Predominantly Black (68%)
- Race & ethnicity
- Black 68% White 24% Two or more races 6% Asian 2% Hispanic / Latino 1%
- Common ancestry
- Romanian 3% Scotch-Irish 1% Slovak 1%
- Foreign-born
- 6% · Canada
- Languages at home
- 92% English-only · Spanish 1% Arabic 1% Russian/Polish/Slavic 1%
Political lean MEDSL · Oakland
- 2024 margin
- D (+10.6) · D 54.4% · R 43.8% · Other 1.9%
- 2008→2024 swing
- -3.9pp toward R · 2008: 14.5pp · 2024: 10.6pp
- All cycles
- 2024: D+10.6 2020: D+14.1 2016: D+8.1 2012: D+8.1 2008: D+14.5
Not yet ingested
- Civics
- —
Market trends
- HPI YoY
- ▼ -175.44%
- Current HPI
- 187.5011
- Rent YoY
- ▼ -1.96%
- Metro
- Detroit-Warren-Dearborn, MI
- State GDP YoY
- ▲ 1.37%
- F500 in state
- 28
Industry mix (Fortune 500 HQ in MI)
| Industry | F500 HQs | Revenue |
|---|---|---|
| Automotive Parts | 3 | $48B |
|
||
| Automotive | 2 | $372B |
|
||
| Chemicals | 1 | $45B |
|
||
| Automotive Retail | 1 | $29B |
|
||
| Healthcare / Medical Devices | 1 | $23B |
|
||
| Automotive Technology | 1 | $20B |
|
||
Price history
+77.2% since first listed8 events — show timeline
- 2026-06-03 Coming Soon $140,000 MiRealSource-MiMLS
- 2023-10-05 Sold (Public Records) $66,000 Public Records
- 2023-09-22 Sold (MLS) $66,000 MiRealSource-MiMLS
- 2023-09-22 Sold (MLS) $66,000 REALCOMP
- 2023-09-20 Pending — REALCOMP
- 2023-09-20 Pending — MiRealSource-MiMLS
- 2023-08-25 Listed $79,000 MiRealSource-MiMLS
- 2023-08-25 Listed $79,000 REALCOMP
Property tax history
+1.5%/yrLatest (2023): $1,931 · +5.6% YoY. Source: county tax records.
Cash-flow waterfall
monthlySold comps — $/sqft
last 12 mo · ≤1 miLoading sold comps…