25372 Loon Blvd · White Branch, MO
Flood risk 6/10 · Moderate
- FEMA flood zone
- X (unshaded)
- Chance of flooding over 30 yrs
- 0.73%
- Est. flood insurance / yr
- $473 – $860
Fire risk 2/10 · Minimal
- Est. fire insurance / yr
- $1,054 – $1,958
Heat risk 4/10 · Minor
- Hot days now (above 108°F)
- 7 days/yr
- Hot days in 30 yrs
- 18 days/yr
Wind risk 2/10 · Minimal
- Chance of severe wind over 30 yrs
- 1.0%
Air-quality risk 1/10 · Minimal
- Unhealthy air days now
- 0 days/yr
- Unhealthy air days in 30 yrs
- 0 days/yr
Risk factors via First Street. Map © Google.
Why this score? — see what drove the D grade
The composite is a weighted blend of 9 inputs, each scored 0–100. Each bar is that input's sub-score; the figure is the points it added to the 100-point composite (weight × sub-score).
- ARV discount +12.5/15.0
- Cash flow +8.1/30.0
- Appreciation +7.7/10.0
- Schools +3.0/10.0
- 1% rule +2.5/10.0
- Rent growth +2.5/5.0
- Livability +2.5/5.0
- Condition / age +2.5/5.0
- DSCR +2.1/10.0
$159,900
🖨 Deal sheet (PDF) 📄 Offer letter ✓ Due diligence
Listing remarks MLS
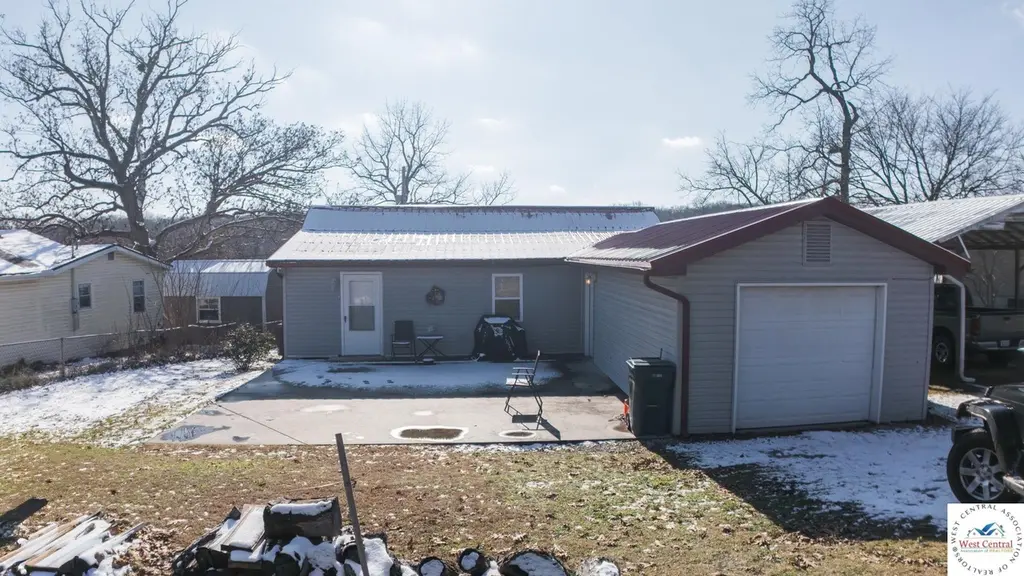
Discover your dream lake retreat with this charming two-bedroom home, just a short stroll from the sparkling waters of Lake of the Ozarks! Completely remodeled from top to bottom, this move-in-ready gem is loaded with premium upgrades, including modern finishes, stylish fixtures, and brand new appliances. The attached garage provides convenience and security, while the spacious driveway offers plenty of parking for family and guests. Nestled in a friendly, sought-after community, you'll enjoy peace, safety, and a true neighborhood feel. Don't miss your chance to own a slice of lake life at an unbeatable price - this exceptional property is offered at just $159,900!
Key facts
- Remodeled
- Attached garage
- Premium upgrades
Tags
Neighborhood map
What this means for you Summary
Snapshot
- This is a 2-bed/1.0-bath single-family listed at $160k.
Deal economics
- At list price, monthly cash flow is $-157 ($-2k/yr) — negative.
- To cash-flow at today's rent, offer at most $137k (14.2% below list).
- To meet the 1% rule (rent ≥ 1% of price), the offer needs to be $120k (25.0% below list).
- Recommended offer: $120k (25.0% below list) — sets the bar for 1% rule.
- Cap rate 5.1% vs local median 3.7% in White Branch — top-decile yield for the area; either an underpriced asset or a hidden risk that comps aren't pricing in. Stress-test before assuming the spread holds.
Location & tenants
- Location reads: area grade D — affects rentability + tenant quality, not the cash-flow math above.
- Warsaw R-IX (rural): math 30% / reading 42% proficiency, ranked #222 of 324 in MO (top 68%) — families likely to look elsewhere, expect single-tenant / working-renter base with shorter leases; 61% free/reduced lunch — lower-income household profile, screen leases tightly.
- Zoned schools: John Boise Middle School (math 37% / reading 40%, grade F, #202 of 391 statewide, top 54%, 278 students, 99% FRL); Warsaw High School (math 27% / reading 52%, grade F, #247 of 521 statewide, top 55%, 403 students, 99% FRL) — zoned schools average 99% FRL vs 61% district-wide (38 pts higher); higher-poverty schools than district average — tighter screening recommended.
- Market conditions: 275 active listings in the ZIP; 9 units permitted in Benton County in 2024 (0 in 5+ unit buildings).
Forward outlook
- In year one you build about $10k of equity ($1k loan paydown + $9k appreciation (5.5% local appreciation)).
- Benton County population projected at -21% by 2050 — secular population decline; favor cash flow + early exit over multi-decade hold.
- By year 4, paydown + projected appreciation supports a ~$33k cash-out refi (75% LTV) — recoverable capital for the next deal without selling this one.
Negotiation context
- It's been on market 172 days — a 12% lower offer ($141k) is reasonable based on typical stale-listing flexibility.
- 2 sale attempts with the ask held roughly flat each time — persistent listings suggest the price (not the market) is what's stuck; bring a comps-based counter.
Risks & watch-outs
- Climate carrying-cost: major flood risk — expect insurance premiums to compound above CPI over the hold.
Questions for the listing agent
- What do current leases actually rent for vs. the listed asking? Can we see a recent rent roll and the last 12 months of T-12 income?
- It's been on market 172 days. Have you received any prior offers? Is the seller open to a 25% concession, seller financing, or rate buy-down credit?
- Built in 1968 — when were the roof, HVAC, electrical panel, plumbing, and water heater last replaced?
- Why hasn't it sold? Are there any deal-killer items the seller is aware of (foundation, flood, title, zoning, code violations)?
- Is there a deadline driving the sale (1031 exchange, divorce, estate, relocation)? That informs how much negotiation room exists.
- The area grade is low — what's the realistic commute time and amenity access for the typical tenant pool here? Any planned neighborhood developments (good or bad) we should know about?
- What's the average days-on-market for RENTAL listings here right now (not sales)? A rising rental-DOM trend means longer vacancies and softer asking-rent achievability than the comps imply.
- What's the recent tenant-quality profile in this submarket — average credit score on applications, eviction rate, late-payment / NSF rate, and stable-employment percentage? A property-management company in the area should have these aggregated.
- How much new for-sale + rental construction is in the pipeline within 1–3 miles? Heavy new supply typically softens prices + rents 12–24 months out; constrained supply supports both.
Investment metrics
- 1% rule
- 0.75% ✗
- Cap rate
- 5.11%
- Cash-on-cash
- -4.22%
- DSCR
- 0.81
- GRM
- 11.1
CMA / ARV
- ARV (median comp)
- $179,899
- List price
- $159,900
- Delta
- -11.12%
- Verdict
- UNDERPRICED
- Comps
- 10 within 1.0 mi
Show comp detail 4 sales within ~0.75 mi
| Address | Dist | Beds/Ba | Sqft | Sold | Price | $/sf | Match |
|---|---|---|---|---|---|---|---|
| 28767 Parkway Dr | 0.39mi | 2/1.0 | 1,005 (+6%) | 10mo | $299,900 | $298 | 64 |
| 29243 Serene Ave | 0.45mi | 3/1.0 (+1) | 1,024 (+8%) | 9mo | $160,000 | $156 | 54 |
| 29191 Placid Ave | 0.43mi | 2/1.0 | 882 (-7%) | 21mo | $199,900 | $227 | 50 |
| 28786 Sleepy Hollow Ln | 0.52mi | 1/2.0 (-1) | 833 (-12%) | 14mo | $140,000 | $168 | 34 |
Match score weights: distance 35% · size 25% · config 20% · recency 20%. Top-matched comps best support the ARV.
Projected returns pro-forma
5.45% appreciation · 3.0% rent growth · sell at horizon
- IRR
- 10.5%
- Equity multiple
- 1.69×
- Total profit
- $30,994
- Equity at exit
- $95,019
- IRR
- 11.8%
- Equity multiple
- 3.25×
- Total profit
- $100,592
- Equity at exit
- $167,754
Cash invested: $44,772 (down + closing). Projections, not guarantees.
Landlord ↔ Tenant lean methodology
- Overall (STATE)
- 81 Strongly Landlord-Friendly
- State Missouri
- 81 Strongly Landlord-Friendly · R+10
- County
- — inherits STATE
- City
- — inherits STATE
ZIP-level market 65355
- Home prices YoY
- 2.4%
- Active inventory
- 275
- Price-to-rent
- 11.1×
Monthly cashflow live
- Estimated rent
- $1,200 medium interval (Pro) →
- Mortgage (P&I)
- −$839
- Tax est. 1.5%
- −$200 /mo · $2,398/yr
- Insurance
- −$67
- HOA
- −$0
- Vacancy / Maint / Mgmt
- −$252
- Net cashflow
- $-157
Break-even live
Sensitivity live
| Price | -10% $-47 | -5% $-102 | +0% $-157 | +5% $-213 | +10% $-268 |
|---|---|---|---|---|---|
| Rent | -10% $-252 | -5% $-205 | +0% $-157 | +5% $-110 | +10% $-63 |
| Rate | -1.0pp $-77 | -0.5pp $-117 | base $-157 | +0.5pp $-199 | +1.0pp $-241 |
UW: 25.0% down · 7.5% · 30yr · 1.5% tax · 5.0% vac · 8.0% maint · 8.0% mgmt
Financing live
Cash to close
- Down payment
- $39,975
- Closing costs
- $4,797
- Reserves months
- —
- Total cash needed
- —
Loan-product check · same deal, 3 products live
Conventional
25% down · 7.5% · 30yr
- Down + closing
- —
- Monthly P&I
- —
- Monthly cashflow
- —
- DSCR
- —
- Eligible?
- —
Personal DTI + credit; lowest rate.
DSCR
20% down · 8.5% · 30yr
- Down + closing
- —
- Monthly P&I
- —
- Monthly cashflow
- —
- DSCR
- —
- Eligible?
- —
No personal income docs; deal must DSCR.
Hard money
10% down · 12.0% · 12mo
- Down + closing
- —
- Monthly P&I
- —
- Monthly cashflow
- —
- DSCR
- —
- Eligible?
- —
Short-term bridge; refi at stabilization.
Listing history 8 events
-
2026-06-01days on market $159,900 Active 172 DOM
-
2026-05-31days on market $159,900 Active 171 DOM
-
2026-05-31days on market $159,900 Active 170 DOM
-
2025-12-06$159,900 Active 673-char remark
Show marketing remark (673 chars)
Discover your dream lake retreat with this charming two-bedroom home, just a short stroll from the sparkling waters of Lake of the Ozarks! Completely remodeled from top to bottom, this move-in-ready gem is loaded with premium upgrades, including modern finishes, stylish fixtures, and brand new appliances. The attached garage provides convenience and security, while the spacious driveway offers plenty of parking for family and guests. Nestled in a friendly, sought-after community, you'll enjoy peace, safety, and a true neighborhood feel. Don't miss your chance to own a slice of lake life at an unbeatable price - this exceptional property is offered at just $159,900!
-
2025-10-21price $175,000
-
2025-10-21price $175,000
-
2025-08-18price $179,000
-
2025-06-13$179,000 Active
ⓘ Source: listings_history table (triggers on properties + properties_extension) + one-shot
backfill from property_details.listing_events for pre-trigger history.
Climate risk First Street
- Flood 6/10 Major FEMA zone X (unshaded) · 73% chance over 30 yrs
- Wildfire 2/10 Low
- Heat 4/10 Moderate 7 d/yr ≥108°F today · 18 d/yr by 30 yrs out
- Wind 2/10 Low 100% chance of damaging wind over 30 yrs
- Air quality 1/10 Low 0 unhealthy d/yr today · 0 by 30 yrs out
Nearby sold comps map
Loading sold comps map…
Walkable amenities ~0.75 mi
Loading nearby amenities…
Taxation est. · year 1
- Rental income
- $14,396
- − Mortgage interest
- −$8,957
- − Property taxes
- −$2,398
- − Insurance
- −$800
- − Repairs & maintenance
- −$1,152
- − Management
- −$1,152
- − Depreciation
- −$4,652
- Taxable loss
- −$4,714
- Est. tax savings @ 24.0%
- +$1,131
- After-tax cash flow
- $-756/yr
For passive investors: Depreciation is non-cash, so a rental often shows a tax loss while cash-flowing — sheltering income. Rental losses are passive: they offset passive income freely, and up to $25,000/yr can offset ordinary (W-2) income if you actively participate and your MAGI is under $100k (phasing out to $0 by $150k); unused losses carry forward. On sale, claimed depreciation is recaptured at up to 25%, and gains may owe capital-gains tax (a 1031 exchange can defer both). Figures are a year-1 estimate at your 24.0% rate — not tax advice; consult a CPA.
Schools (NCES district)
- District
- Warsaw R-IX
- NCES district ID
- 2931070
- Math proficiency
- 30% ▬ 0.00%
- Reading proficiency
- 42% ▲ 4.00%
- Median HH income
- $33,160
- Composite
- 29.53/100
- National rank
- #6495
- State rank
- #222 of 324 in MO
Livability — White Branch
No livability data for this city. (Only ~50 U.S. cities are tracked.)
Census & demographics
- Population (ZIP)
- 11,029
Population outlook (Benton County) Hauer SSP2
- Today (2025)
- 17,355 people
- By 2030
- 16,513 · -4.9%
- By 2040
- 14,898 · -14.2%
- By 2050
- 13,662 · -21.3%
- By 2075
- 11,308 · -34.8%
- By 2100
- 8,755 · -49.6%
Race, ethnicity, and origin ACS 2023
- Neighborhood character
- Predominantly White (92%)
- Race & ethnicity
- White 92% Two or more races 6% Hispanic / Latino 2% Native American 1%
- Common ancestry
- Slovak 3% Italian 2% Iranian 2%
- Foreign-born
- 1% · Canada
Political lean MEDSL · Benton
- 2024 margin
- Solid R (+59.1) · D 20.1% · R 79.2%
- 2008→2024 swing
- -36.8pp toward R · 2008: -22.3pp · 2024: -59.1pp
- All cycles
- 2024: R+59.1 2020: R+56.6 2016: R+54.1 2012: R+34.3 2008: R+22.3
Not yet ingested
- Civics
- —
Market trends
- HPI YoY
- ▲ 5.45%
- Current HPI
- 232.6924
- Rent YoY
- —
- Metro
- —
- State GDP YoY
- ▲ 1.84%
- F500 in state
- 20
Industry mix (Fortune 500 HQ in MO)
| Industry | F500 HQs | Revenue |
|---|---|---|
| Healthcare | 1 | $163B |
|
||
| Insurance | 1 | $21B |
|
||
| Industrial Technology | 1 | $17B |
|
||
| Retail | 1 | $16B |
|
||
| Industrial Distribution | 1 | $10B |
|
||
| Utilities | 1 | $9B |
|
||
Price history
-10.7% since first listed5 events — show timeline
- 2025-12-06 Listed $159,900 WCAR
- 2025-10-21 Price Changed $175,000 WCAR
- 2025-10-21 Price Changed $175,000 LOBR
- 2025-08-18 Price Changed $179,000 LOBR
- 2025-06-13 Listed $179,000 WCAR
Cash-flow waterfall
monthlySold comps — $/sqft
last 12 mo · ≤1 miLoading sold comps…