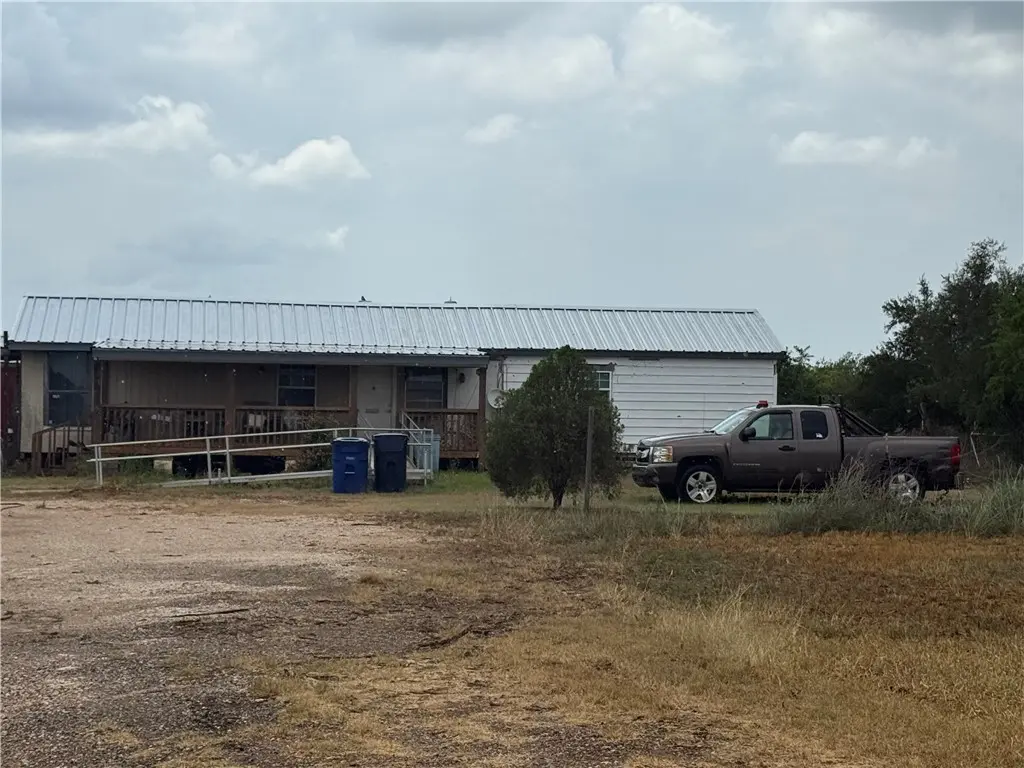
762 County Road 122 · Owl Ranch, TX
Flood risk 1/10 · Minimal
- FEMA flood zone
- X (unshaded)
- Chance of flooding over 30 yrs
- 0.0%
- Est. flood insurance / yr
- $507 – $1,088
Fire risk 8/10 · Major
- Est. fire insurance / yr
- $1,222 – $2,270
Heat risk 9/10 · Severe
- Hot days now (above 111°F)
- 7 days/yr
- Hot days in 30 yrs
- 21 days/yr
Wind risk 9/10 · Severe
- Chance of severe wind over 30 yrs
- 99.0%
Air-quality risk 1/10 · Minimal
- Unhealthy air days now
- 0 days/yr
- Unhealthy air days in 30 yrs
- 0 days/yr
Risk factors via First Street. Map © Google.
Why this score? — see what drove the B- grade
The composite is a weighted blend of 9 inputs, each scored 0–100. Each bar is that input's sub-score; the figure is the points it added to the 100-point composite (weight × sub-score).
- Cash flow +30.0/30.0
- 1% rule +10.0/10.0
- DSCR +10.0/10.0
- ARV discount +7.5/15.0
- Rent growth +2.5/5.0
- Condition / age +2.2/5.0
- Livability +1.9/5.0
- Schools +1.5/10.0
- Appreciation +0.0/10.0
$55,000
🖨 Deal sheet (PDF) 📄 Offer letter ✓ Due diligence
Listing remarks
Fixer-upper with major improvements already completed! Situated on 2 acres in Alice, Texas, this 2-bedroom, 2-bathroom home offers an excellent opportunity for investors, flippers, or buyers looking to create their own country retreat. Several big-ticket updates have already been completed, including a brand-new water well, new central air and heat system, new tin roof, new front and back porches, and newly renovated bathrooms. While the home still needs additional repairs, updates, and finishing touches, much of the costly infrastructure work has already been addressed. The 2-acre property provides plenty of room for livestock, equipment, gardening, or future improvements. Whether you're l
Key facts
- New water well
- 2 acres
- New tin roof
Tags
Property features AI
Finance
- Other: Horses allowed
Exterior
- Utilities: Well water; Septic available; Water available
- Home design: Single-story; Pillar/post/pier foundation
- Construction: HardiPlank-type siding; Metal roof; Built on pillar/post/pier foundation
- Exterior features: Covered deck; Deck; Handicap accessible; Barbed wire fencing; Pasture
Interior
- Flooring: Laminate flooring; Tile flooring
- Bathrooms: 2 full bathrooms
- Heating & cooling: Central heating (electric); Central air conditioning
- Interior features: Paneling/wainscoting; Breakfast bar
- Laundry & utility: Dryer hookup
Neighborhood map
What this means for you Summary
Snapshot
- This is a 2-bed/2.0-bath single-family listed at $55k. Condition is rated fair.
Deal economics
- At list price, monthly cash flow is $389 ($5k/yr) — positive.
- The deal already cash-flows at list — no discount required.
- Meets the 1% rule at list price ($951 rent vs $55k).
Location & tenants
- Location reads 38/100 on livability (#1,623 in TX) — a limited-amenity area; tenant pool skews transient or value-seeking. Strengths: cost of living A+, crime A; Watch: health & safety C-, schools F, amenities F.
- Alice ISD (town): math 12% / reading 23% proficiency, ranked #799 of 826 in TX (top 97%) — low school quality limits family demand, transient renter base, plan for 1-2y turnover; 70% free/reduced lunch — lower-income household profile, screen leases tightly.
- Market conditions: 220 active listings in the ZIP; 6 units permitted in Jim Wells County in 2024 (0 in 5+ unit buildings).
Forward outlook
- Local home prices are declining (-3.0%/yr); year-one equity from $380 of loan paydown is wiped out by about $2k of value loss. Plan a longer hold.
- Jim Wells County population projected at +10% by 2050 — modest demand growth; plan on rents tracking national, not racing it.
- At projected returns (-3.0% appreciation + 3.0% rent growth), your $15k cash investment doubles in ~4 years — after that, you're playing with house money.
Negotiation context
- Only 2 days on market — expect competitive offers; lowballing is unlikely to land.
- 4 sale attempts with the ask held roughly flat each time — persistent listings suggest the price (not the market) is what's stuck; bring a comps-based counter.
Risks & watch-outs
- Climate carrying-cost: severe wind risk, 99% chance of damaging wind over 30y; severe wildfire risk; extreme-heat days projected 7→21/yr by 2055 (HVAC capex compounding) — expect insurance premiums to compound above CPI over the hold.
Questions for the listing agent
- Have any recent inspections been done? Can we get a copy of the seller's disclosures and any deferred-maintenance estimates?
- Is there a deadline driving the sale (1031 exchange, divorce, estate, relocation)? That informs how much negotiation room exists.
- Schools are F-rated, which usually means shorter tenancies and higher turnover. Who's the typical renter profile here, and what's been the actual vacancy rate?
- What's the average days-on-market for RENTAL listings here right now (not sales)? A rising rental-DOM trend means longer vacancies and softer asking-rent achievability than the comps imply.
- What's the recent tenant-quality profile in this submarket — average credit score on applications, eviction rate, late-payment / NSF rate, and stable-employment percentage? A property-management company in the area should have these aggregated.
- How much new for-sale + rental construction is in the pipeline within 1–3 miles? Heavy new supply typically softens prices + rents 12–24 months out; constrained supply supports both.
Investment metrics
- 1% rule
- 1.73% ✓
- Cap rate
- 14.78%
- Cash-on-cash
- 30.32%
- DSCR
- 2.35
- GRM
- 4.8
CMA / ARV
- ARV (median comp)
- $136,477
- List price
- $55,000
- Delta
- -50.17%
- Verdict
- UNDERPRICED
- Comps
- 2 within 2.0 mi
Projected returns pro-forma
-3.0% appreciation · 3.0% rent growth · sell at horizon
- IRR
- 25.0%
- Equity multiple
- 2.03×
- Total profit
- $15,872
- Equity at exit
- $8,201
- IRR
- 32.7%
- Equity multiple
- 3.97×
- Total profit
- $45,746
- Equity at exit
- $4,755
Cash invested: $15,400 (down + closing). Projections, not guarantees.
Landlord ↔ Tenant lean methodology
- Overall (STATE)
- 87 Strongly Landlord-Friendly
- State Texas
- 87 Strongly Landlord-Friendly · R+5
- County
- — inherits STATE
- City
- — inherits STATE
ZIP-level market 78332
- Active inventory
- 220
- Price-to-rent
- 4.8×
Monthly cashflow live
- Estimated rent
- $951 medium interval (Pro) →
- Mortgage (P&I)
- −$288
- Tax from tax record
- −$51 /mo · $614/yr
- Insurance
- −$23
- HOA
- −$0
- Vacancy / Maint / Mgmt
- −$200
- Net cashflow
- $389
Break-even live
Sensitivity live
| Price | -10% $420 | -5% $405 | +0% $389 | +5% $374 | +10% $358 |
|---|---|---|---|---|---|
| Rent | -10% $314 | -5% $352 | +0% $389 | +5% $427 | +10% $464 |
| Rate | -1.0pp $417 | -0.5pp $403 | base $389 | +0.5pp $375 | +1.0pp $360 |
UW: 25.0% down · 7.5% · 30yr · 1.5% tax · 5.0% vac · 8.0% maint · 8.0% mgmt
Financing live
Cash to close
- Down payment
- $13,750
- Closing costs
- $1,650
- Reserves months
- —
- Total cash needed
- —
Loan-product check · same deal, 3 products live
Conventional
25% down · 7.5% · 30yr
- Down + closing
- —
- Monthly P&I
- —
- Monthly cashflow
- —
- DSCR
- —
- Eligible?
- —
Personal DTI + credit; lowest rate.
DSCR
20% down · 8.5% · 30yr
- Down + closing
- —
- Monthly P&I
- —
- Monthly cashflow
- —
- DSCR
- —
- Eligible?
- —
No personal income docs; deal must DSCR.
Hard money
10% down · 12.0% · 12mo
- Down + closing
- —
- Monthly P&I
- —
- Monthly cashflow
- —
- DSCR
- —
- Eligible?
- —
Short-term bridge; refi at stabilization.
Listing history 10 events
-
2026-06-03days on market $55,000 Active 2 DOM
-
2026-06-02remarks 699-char remark
-
2026-06-02pricedays on market $55,000 Active 1 DOM
-
2026-05-31days on market $68,000 Active 219 DOM
-
2025-10-24status Active 1132-char remark
-
2025-10-15status Pending 1132-char remark
-
2025-10-15$68,000 Active 1132-char remark
-
2025-10-11historical
-
2025-08-27price $68,000
-
2025-05-01$80,000 Active
ⓘ Source: listings_history table (triggers on properties + properties_extension) + one-shot
backfill from property_details.listing_events for pre-trigger history.
Tax reassessment forecast TX · Resets to sale price
- Current annual tax
- $614 · $51/mo
- Projected year-2 tax
- $1,006 · $84/mo
- Expected delta
- +$393/yr (+$33/mo · 64.0%)
ⓘ Screening estimate from a state-policy table — verify with the county assessor before closing.
Climate risk First Street
- Flood 1/10 Low FEMA zone X (unshaded) · 0% chance over 30 yrs
- Wildfire 8/10 Severe
- Heat 9/10 Extreme 7 d/yr ≥111°F today · 21 d/yr by 30 yrs out
- Wind 9/10 Extreme 99% chance of damaging wind over 30 yrs
- Air quality 1/10 Low 0 unhealthy d/yr today · 0 by 30 yrs out
Nearby sold comps map
Loading sold comps map…
Walkable amenities ~0.75 mi
Loading nearby amenities…
Taxation est. · year 1
- Rental income
- $11,416
- − Mortgage interest
- −$3,081
- − Property taxes
- −$614
- − Insurance
- −$275
- − Repairs & maintenance
- −$913
- − Management
- −$913
- − Depreciation
- −$1,600
- Taxable income
- $4,020
- Est. tax owed @ 24.0%
- −$965
- After-tax cash flow
- $3,704/yr
For passive investors: Depreciation is non-cash, so a rental often shows a tax loss while cash-flowing — sheltering income. Rental losses are passive: they offset passive income freely, and up to $25,000/yr can offset ordinary (W-2) income if you actively participate and your MAGI is under $100k (phasing out to $0 by $150k); unused losses carry forward. On sale, claimed depreciation is recaptured at up to 25%, and gains may owe capital-gains tax (a 1031 exchange can defer both). Figures are a year-1 estimate at your 24.0% rate — not tax advice; consult a CPA.
Condition & rehab AI · 12 photos
This 2-bedroom, 2-bathroom home on 2 acres requires moderate repairs and updates to reach its full potential. The new tin roof and central HVAC system are positives, but the exterior siding and interior paint need attention. With some cosmetic improvements, it could be a solid investment.
Repairs flagged
- Major Exterior siding — Weathered and in need of replacement
- Major Kitchen — No photos, but likely in poor condition
- Major Paint — Faded and needs fresh coats
Value-add opportunities
- Both Paint job — Fresh paint enhances curb appeal and interior aesthetics
- Both Landscaping — Improved landscaping increases curb appeal and property value
- Both Exterior siding — New siding improves curb appeal and structural integrity
Renovation cost estimate screening
| Repair item | Severity | Est. cost |
|---|---|---|
| Exterior siding · Weathered and in need of replacement | Major | $15,000–50,000 |
| Kitchen · No photos, but likely in poor condition | Major | $15,000–50,000 |
| Paint · Faded and needs fresh coats | Major | $15,000–50,000 |
| Total estimated repair cost · 3 items | $45,000–150,000 |
Value-add ROI direction
- Both Paint job — Fresh paint enhances curb appeal and interior aesthetics ↑
- Both Landscaping — Improved landscaping increases curb appeal and property value ↑
- Both Exterior siding — New siding improves curb appeal and structural integrity ↑
ⓘ Cost ranges are severity-bucket heuristics (US national rule-of-thumb). Get contractor quotes + a written scope before underwriting a rehab budget.
Schools (NCES district)
- District
- Alice ISD
- NCES district ID
- 4807800
- Math proficiency
- 12% ▼ -18.00%
- Reading proficiency
- 23% ▼ -7.00%
- Median HH income
- $37,747
- Composite
- 14.63/100
- National rank
- #9407
- State rank
- #799 of 826 in TX
Livability — Owl Ranch
- Score
- 38/100
- State rank
- #1623
- US rank
- #27461
Category grades
Schools grade is shown separately in the Schools card above.
Census & demographics
- Census place
- Owl Ranch, TX
- Population (ZIP)
- 27,281
Population outlook (Jim Wells County) Hauer SSP2
- Today (2025)
- 43,325 people
- By 2030
- 44,156 · +1.9%
- By 2040
- 45,790 · +5.7%
- By 2050
- 47,455 · +9.5%
- By 2075
- 51,800 · +19.6%
- By 2100
- 52,006 · +20.0%
Race, ethnicity, and origin ACS 2023
- Neighborhood character
- Predominantly Hispanic (84%)
- Race & ethnicity
- Hispanic / Latino 84% White 14% Two or more races 14%
- Hispanic origin (detail)
- Mexican 76%
- Foreign-born
- 4% · Canada
- Languages at home
- 50% English-only · Spanish 49%
Political lean MEDSL · Jim Wells
- 2024 margin
- R (+15.5) · D 42.0% · R 57.5%
- 2008→2024 swing
- -31.6pp toward R · 2008: 16.1pp · 2024: -15.5pp
- All cycles
- 2024: R+15.5 2020: R+9.8 2016: D+10.3 2012: D+17.0 2008: D+16.1
Not yet ingested
- Civics
- —
Market trends
- HPI YoY
- ▼ -123.86%
- Current HPI
- 77.6253
- Rent YoY
- —
- Metro
- —
- State GDP YoY
- ▲ 3.95%
- F500 in state
- 110
Industry mix (Fortune 500 HQ in TX)
| Industry | F500 HQs | Revenue |
|---|---|---|
| Energy | 16 | $1,198B |
|
||
| Technology | 5 | $198B |
|
||
| Engineering / Construction | 4 | $72B |
|
||
| Energy Services | 3 | $60B |
|
||
| Utilities | 3 | $41B |
|
||
| Healthcare | 2 | $330B |
|
||
Price history
-31.2% since first listed7 events — show timeline
- 2026-06-01 Listed $55,000 CBMLS
- 2025-10-24 Relisted — CBMLS
- 2025-10-15 Pending — CBMLS
- 2025-10-15 Listed $68,000 CBMLS
- 2025-10-11 Delisted — CBMLS
- 2025-08-27 Price Changed $68,000 CBMLS
- 2025-05-01 Listed $80,000 CBMLS
Property tax history
+11.4%/yrLatest (2025): $614 · +11.4% YoY. Source: county tax records.
Cash-flow waterfall
monthlySold comps — $/sqft
last 12 mo · ≤1 miLoading sold comps…