 🏗️ New Construction
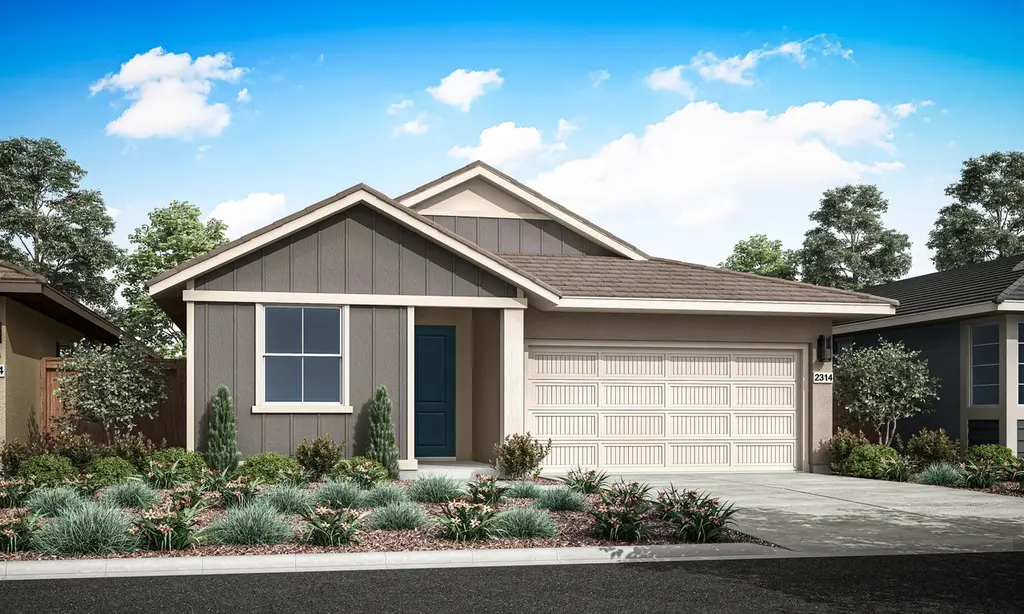
12070 Mircado Way · Rancho Cordova, CA
Flood risk 1/10 · Minimal
- FEMA flood zone
- X (unshaded)
- Chance of flooding over 30 yrs
- 0.0%
- Est. flood insurance / yr
- $507 – $1,088
Fire risk 7/10 · Major
- Est. fire insurance / yr
- $659 – $1,223
Heat risk 8/10 · Major
- Hot days now (above 102°F)
- 7 days/yr
- Hot days in 30 yrs
- 16 days/yr
Wind risk 1/10 · Minimal
- Chance of severe wind over 30 yrs
- —
Air-quality risk 10/10 · Severe
- Unhealthy air days now
- 32 days/yr
- Unhealthy air days in 30 yrs
- 36 days/yr
Risk factors via First Street. Map © Google.
Why this score? — see what drove the D- grade
The composite is a weighted blend of 9 inputs, each scored 0–100. Each bar is that input's sub-score; the figure is the points it added to the 100-point composite (weight × sub-score).
- Appreciation +10.0/10.0
- ARV discount +7.5/15.0
- Cash flow +5.7/30.0
- Schools +4.1/10.0
- Livability +3.4/5.0
- Rent growth +3.0/5.0
- Condition / age +2.5/5.0
- 1% rule +0.3/10.0
- DSCR +0.1/10.0
$561,547
🖨 Deal sheet 📄 Offer letter ✓ Due diligence
Listing remarks
This home is currently under construction, offering a great opportunity to personalize finishes and selections before its estimated completion in September 2026. Experience modern living in this brand-new Tri Pointe HomeResidence 4 at Starblossom at Montelena. This thoughtfully designed single-story home features 3 bedrooms and 2 bathrooms, blending comfort and functionality throughout. A charming foyer welcomes you into the heart of the home, where a spacious dining area flows seamlessly into the great roomideal for both everyday living and entertaining. Just off the entry, a private office provides the perfect space for working from home, studying, or staying organized. Two secondary bedr
Key facts
- 4,448 sq ft lot
- 2 garage spots
- Built 2026
Property features AI
Finance
- Other: Located in Starblossom at Montelena subdivision, Rancho Cordova, CA 95742
- HOA & community: No homeowners association
Exterior
- Parking: Attached garage facing front with 2 garage spaces
- Utilities: Cable connected; Solar; Natural gas connected; 220-volt electric; Public sewer; Water meter on site; Irrigation meter on site
- Home design: Detached single-family home; New construction (built 2026); Single-story
- Construction: Tile roof; Detached construction
- Exterior features: Front landscaping; Wood fence in back yard; Tile roof; No pool or spa
Interior
- Kitchen: Kitchen with island
- Bedrooms: 3 bedrooms (main level)
- Flooring: Carpet; Tile
- Bathrooms: 2 full bathrooms; Tub with shower over
- Heating & cooling: Central heating; Central air conditioning
- Interior features: Energy-efficient construction, lighting, roof, and thermostat; Dual-pane windows with low-E glass; Great room living and family spaces; Dining/family combo; Office
- Laundry & utility: Laundry inside (dedicated room)
Neighborhood map
What this means for you Summary
Snapshot
- This is a 3-bed/2.0-bath land listed at $562k.
Deal economics
- At list price, monthly cash flow is $-1k ($-15k/yr) — negative.
- To cash-flow at today's rent, offer at most $378k (32.7% below list).
- To meet the 1% rule (rent ≥ 1% of price), the offer needs to be $314k (44.1% below list).
- Recommended offer: $314k (44.1% below list) — sets the bar for 1% rule.
- Cap rate 3.8% vs local median 3.0% in Rancho Cordova — meaningfully above typical; check what's discounted (condition, days-on-market, listing class) to confirm the premium yield is real.
Location & tenants
- Location reads 68/100 on livability (#268 in CA) — a middle-class / working-renter tenant base. Strengths: housing A+, employment B; Watch: schools C-, commute C-, crime D.
- Elk Grove Unified (suburban): math 40% / reading 51% proficiency, ranked #165 of 517 in CA (top 32%) — families likely to look elsewhere, expect single-tenant / working-renter base with shorter leases.
- Market conditions: Rents rising (+2.1%/yr); 466 active listings in the ZIP; 10 comparable units currently listed for rent nearby; rentals at typical pace (median 15d on market — plan ~3-4 weeks tenant-placement turnaround); high-income renter base; 6,825 units permitted in Sacramento County in 2024 (1,752 in 5+ unit buildings).
Forward outlook
- In year one you build about $63k of equity ($4k loan paydown + $59k appreciation (10.0% local appreciation)).
- Sacramento County population projected at +17% by 2050 — long-run rental-demand tailwind backs the buy-and-hold thesis.
- By year 2, paydown + projected appreciation supports a ~$102k cash-out refi (75% LTV) — recoverable capital for the next deal without selling this one.
Negotiation context
- It's been on market 37 days — a 3% lower offer ($545k) is reasonable based on typical stale-listing flexibility.
Risks & watch-outs
- Climate carrying-cost: major wildfire risk; extreme-heat days projected 7→16/yr by 2055 (HVAC capex compounding) — expect insurance premiums to compound above CPI over the hold.
Questions for the listing agent
- What do current leases actually rent for vs. the listed asking? Can we see a recent rent roll and the last 12 months of T-12 income?
- It's been on market 37 days. Have you received any prior offers? Is the seller open to a 44% concession, seller financing, or rate buy-down credit?
- Is there a deadline driving the sale (1031 exchange, divorce, estate, relocation)? That informs how much negotiation room exists.
- Crime grade is D in this area — have there been break-ins, vandalism, or insurance claims at this property in the last 3 years? What carrier currently insures it and at what premium?
- The area grade is low — what's the realistic commute time and amenity access for the typical tenant pool here? Any planned neighborhood developments (good or bad) we should know about?
- What's the average days-on-market for RENTAL listings here right now (not sales)? A rising rental-DOM trend means longer vacancies and softer asking-rent achievability than the comps imply.
- What's the recent tenant-quality profile in this submarket — average credit score on applications, eviction rate, late-payment / NSF rate, and stable-employment percentage? A property-management company in the area should have these aggregated.
- How much new for-sale + rental construction is in the pipeline within 1–3 miles? Heavy new supply typically softens prices + rents 12–24 months out; constrained supply supports both.
Investment metrics
- 1% rule
- 0.53% ✗
- Cap rate
- 3.82%
- Cash-on-cash
- -8.82%
- DSCR
- 0.61
- GRM
- 15.7
CMA / ARV
- ARV (median comp)
- $593,581
- List price
- $561,547
- Delta
- -5.40%
- Verdict
- FAIR
- Comps
- 20 within 1.0 mi
Projected returns pro-forma
10.0% appreciation · 2.08% rent growth · sell at horizon
- IRR
- 17.9%
- Equity multiple
- 2.46×
- Total profit
- $242,431
- Equity at exit
- $534,744
- IRR
- 16.6%
- Equity multiple
- 5.63×
- Total profit
- $769,052
- Equity at exit
- $1,153,197
Cash invested: $166,203 (down + closing). Projections, not guarantees.
Landlord ↔ Tenant lean methodology
- Overall (STATE)
- 18 Strongly Tenant-Friendly
- State California
- 18 Strongly Tenant-Friendly · D+13
- County
- — inherits STATE
- City
- — inherits STATE
ZIP-level market 95742
- Home prices YoY
- 28.3%
- Rents YoY
- 2.1%
- Active inventory
- 466
- Price-to-rent
- 14.9×
Monthly cashflow live
- Estimated rent
- $3,141 high interval (Pro) →
- Mortgage (P&I)
- −$3,113
- Tax from tax record
- −$343 /mo · $4,110/yr
- Insurance
- −$247
- HOA
- −$0
- Vacancy / Maint / Mgmt
- −$660
- Net cashflow
- $-1,221
Break-even live
UW: 25.0% down · 7.5% · 30yr · 1.5% tax · 5.0% vac · 8.0% maint · 8.0% mgmt
Financing live
Cash to close
- Down payment
- $148,395
- Closing costs
- $17,807
- Reserves months
- —
- Total cash needed
- —
Loan-product check · same deal, 3 products live
Conventional
25% down · 7.5% · 30yr
- Down + closing
- —
- Monthly P&I
- —
- Monthly cashflow
- —
- DSCR
- —
- Eligible?
- —
Personal DTI + credit; lowest rate.
DSCR
20% down · 8.5% · 30yr
- Down + closing
- —
- Monthly P&I
- —
- Monthly cashflow
- —
- DSCR
- —
- Eligible?
- —
No personal income docs; deal must DSCR.
Hard money
10% down · 12.0% · 12mo
- Down + closing
- —
- Monthly P&I
- —
- Monthly cashflow
- —
- DSCR
- —
- Eligible?
- —
Short-term bridge; refi at stabilization.
Rent comps 10 comps
| Address | Beds | Baths | Sqft | Rent | $/sqft | DOM | Units | Dist |
|---|---|---|---|---|---|---|---|---|
| 12153 Coal Creek Way Rancho Cordova, CA | 3.0 | 2.5 | 1906 | $2,750 | $1.44 | 15d | 1 | 0.32mi |
| 11832 Stoney Ridge Way Rancho Cordova, CA | 4.0 | 2.5 | 2019 | $2,695 | $1.33 | 10d | 1 | 0.59mi |
| 11688 Giacinta Ln Rancho Cordova, CA | 4.0 | 2.5 | 1765 | $3,499 | $1.98 | 12d | 1 | 0.90mi |
| 11684 Fiorenza Ln Rancho Cordova, CA | 4.0 | 2.5 | 1765 | $3,529 | $2.00 | 22d | 1 | 0.91mi |
| 11664 Giacinta Ln Rancho Cordova, CA | 3.0 | 2.5 | 1529 | $3,199 | $2.09 | 2d | 1 | 0.93mi |
| 4143 Cahakia Pl Rancho Cordova, CA | 3.0 | 2.0 | 1650 | $2,795 | $1.69 | 44d | 1 | 0.94mi |
| 4071 Quorra Pl Rancho Cordova, CA | 3.0 | 2.5 | 1600 | $3,279 | $2.05 | 2d | 1 | 0.94mi |
| 11641 Fiorenza Ln Rancho Cordova, CA | 3.0 | 2.5 | 1600 | $3,189 | $1.99 | 44d | 1 | 0.97mi |
| 11643 Giacinta Ln Rancho Cordova, CA | 3.0 | 2.5 | 1529 | $3,169 | $2.07 | 24d | 1 | 0.98mi |
| 11617 Venitia Ln Rancho Cordova, CA | 3.0 | 2.5 | 1600 | $3,249 | $2.03 | 8d | 1 | 1.07mi |
Listing history 9 events
-
2026-06-05statusdays on market $561,547 Pending 37 DOM
-
2026-06-03days on market $561,547 Active 36 DOM
-
2026-06-02days on market $561,547 Active 35 DOM
-
2026-06-01days on market $561,547 Active 34 DOM
-
2026-05-31days on market $561,547 Active 33 DOM
-
2026-05-15price $553,455 738-char remark
-
2026-04-28$547,133 Active 738-char remark
-
2026-04-16soldstatus $2,844,000
-
2023-07-27soldstatus $27,531,000
ⓘ Source: listings_history table (triggers on properties + properties_extension) + one-shot
backfill from property_details.listing_events for pre-trigger history.
Tax reassessment forecast CA · Resets to sale price
- Current annual tax
- $4,110 · $343/mo
- Projected year-2 tax
- $4,268 · $356/mo
- Expected delta
- +$157/yr (+$13/mo · 3.8%)
ⓘ Screening estimate from a state-policy table — verify with the county assessor before closing.
Climate risk First Street
- Flood 1/10 Low FEMA zone X (unshaded) · 0% chance over 30 yrs
- Wildfire 7/10 Severe
- Heat 8/10 Severe 7 d/yr ≥102°F today · 16 d/yr by 30 yrs out
- Wind 1/10 Low
- Air quality 10/10 Extreme 32 unhealthy d/yr today · 36 by 30 yrs out
Nearby sold comps map
Loading sold comps map…
Walkable amenities ~0.75 mi
Loading nearby amenities…
Taxation est. · year 1
- Rental income
- $37,695
- − Mortgage interest
- −$33,250
- − Property taxes
- −$4,110
- − Insurance
- −$2,968
- − Repairs & maintenance
- −$3,016
- − Management
- −$3,016
- − Depreciation
- −$17,268
- Taxable loss
- −$25,932
- Est. tax savings @ 24.0%
- +$6,224
- After-tax cash flow
- $-8,429/yr
For passive investors: Depreciation is non-cash, so a rental often shows a tax loss while cash-flowing — sheltering income. Rental losses are passive: they offset passive income freely, and up to $25,000/yr can offset ordinary (W-2) income if you actively participate and your MAGI is under $100k (phasing out to $0 by $150k); unused losses carry forward. On sale, claimed depreciation is recaptured at up to 25%, and gains may owe capital-gains tax (a 1031 exchange can defer both). Figures are a year-1 estimate at your 24.0% rate — not tax advice; consult a CPA.
Schools (NCES district)
- District
- Elk Grove Unified
- NCES district ID
- 0612330
- Math proficiency
- 40% ▼ -5.00%
- Reading proficiency
- 51% ▼ -5.00%
- Median HH income
- $67,860
- Composite
- 40.72/100
- National rank
- #3658
- State rank
- #165 of 517 in CA
Livability — Rancho Cordova
- Score
- 68/100
- State rank
- #268
- US rank
- #9126
Category grades
Schools grade is shown separately in the Schools card above.
Census & demographics
- Census place
- Rancho Cordova, CA
- County
- Sacramento County · 1,539,646 people
- City population
- 98,329
- Metro
- Sacramento-Roseville-Folsom, CA
- Population (ZIP)
- 17,768
- Household income
- $155,855
- Rent vs Own
- Severe rent burden
- 172.0
Population outlook (Sacramento County) Hauer SSP2
- Today (2025)
- 1,660,763 people
- By 2030
- 1,732,990 · +4.3%
- By 2040
- 1,855,755 · +11.7%
- By 2050
- 1,941,335 · +16.9%
- By 2075
- 2,046,162 · +23.2%
- By 2100
- 1,961,444 · +18.1%
Race, ethnicity, and origin ACS 2023
- Neighborhood character
- Highly diverse neighborhood (Simpson 0.72)
- Race & ethnicity
- White 42% Asian 28% Hispanic / Latino 15% Two or more races 13% Black 7%
- Hispanic origin (detail)
- Mexican 11% Puerto Rican 1%
- Common ancestry
- Italian 3% Slovak 2% Subsaharan African 2%
- Foreign-born
- 25% · China, South Korea, Canada
- Languages at home
- 67% English-only · Other Asian/Pacific 7% Other Indo-European 7% Tagalog/Filipino 5%
Political lean MEDSL · Sacramento
- 2024 margin
- D (+19.7) · D 58.1% · R 38.4% · Other 3.5%
- 2008→2024 swing
- +0.7pp no change · 2008: 19.0pp · 2024: 19.7pp
- All cycles
- 2024: D+19.7 2020: D+25.3 2016: D+23.7 2012: D+16.3 2008: D+19.0
Not yet ingested
- Civics
- —
Market trends
- HPI YoY
- ▲ 52.05%
- Current HPI
- 236.1388
- Rent YoY
- ▲ 2.08%
- Metro
- Sacramento-Roseville-Folsom, CA
- State GDP YoY
- ▲ 3.21%
- F500 in state
- 116
Industry mix (Fortune 500 HQ in CA)
| Industry | F500 HQs | Revenue |
|---|---|---|
| Technology | 27 | $1,492B |
|
||
| Financial Services | 3 | $174B |
|
||
| Retail | 3 | $44B |
|
||
| Insurance | 3 | $26B |
|
||
| Media / Entertainment | 2 | $115B |
|
||
| Pharmaceuticals / Biotech | 2 | $62B |
|
||
Price history
-89.7% since first listed2 events — show timeline
- 2026-04-16 Sold (Public Records) $2,844,000 Public Records
- 2023-07-27 Sold (Public Records) $27,531,000 Public Records
Property tax history
+15.5%/yrLatest (2025): $4,110 · +1.9% YoY. Source: county tax records.
Cash-flow waterfall
monthlySold comps — $/sqft
last 12 mo · ≤1 miLoading sold comps…