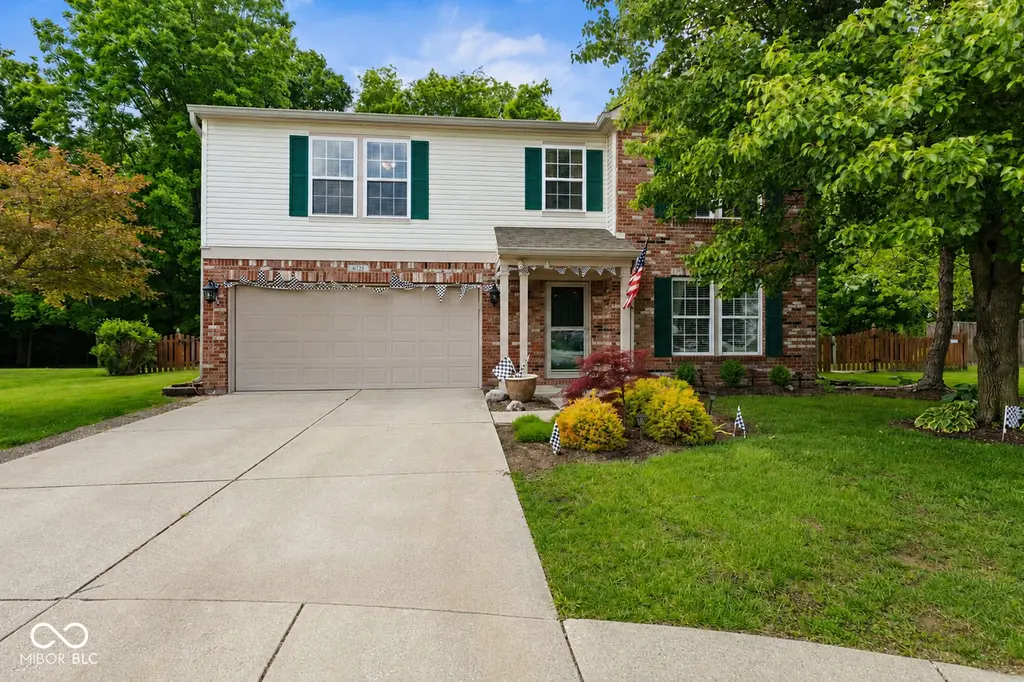
6725 Amber Springs Way · Indianapolis city (balance), IN
Flood risk 1/10 · Minimal
- FEMA flood zone
- X (unshaded)
- Chance of flooding over 30 yrs
- 0.0%
- Est. flood insurance / yr
- $507 – $1,088
Fire risk 1/10 · Minimal
- Est. fire insurance / yr
- $717 – $1,331
Heat risk 3/10 · Minor
- Hot days now (above 102°F)
- 7 days/yr
- Hot days in 30 yrs
- 19 days/yr
Wind risk 2/10 · Minimal
- Chance of severe wind over 30 yrs
- 1.0%
Air-quality risk 2/10 · Minimal
- Unhealthy air days now
- 1 days/yr
- Unhealthy air days in 30 yrs
- 2 days/yr
Risk factors via First Street. Map © Google.
Why this score? — see what drove the D grade
The composite is a weighted blend of 9 inputs, each scored 0–100. Each bar is that input's sub-score; the figure is the points it added to the 100-point composite (weight × sub-score).
- Cash flow +14.0/30.0
- ARV discount +6.1/15.0
- DSCR +4.2/10.0
- Schools +4.0/10.0
- 1% rule +3.5/10.0
- Rent growth +3.4/5.0
- Livability +2.5/5.0
- Condition / age +2.5/5.0
- Appreciation +0.0/10.0
$329,900
🖨 Deal sheet (PDF) 📄 Offer letter ✓ Due diligence
Listing remarks MLS
Beautiful 4BR home in immaculate condition located in small Franklin Township neighborhood! Home sits on nearly half an acre in a quiet cul de sac, with a large fenced in rear yard that backs up to woods for extra privacy. Plenty of living space with large family room, living room and upstairs loft. LVP downstairs, new carpets installed upstairs in 2021. Lots of natural light in kitchen & dining area. Huge owners' suite with reading nook, walk in closets, garden tub and new double vanity. Relax or entertain in backyard oasis! Fantastic two tiered deck overlooking woods. This home has it all and is move in ready!
Key facts
- Quiet cul-de-sac
- Charming patio area
- Fenced-in backyard
Tags
Property features AI
Finance
- Other: Ownership is subject to mandatory fee
- HOA & community: HOA with annual fee of $350; HOA covers entrance/common area maintenance, park/playground, and snow removal; HOA governed by covenants and restrictions
Exterior
- Parking: Attached garage with keyless entry; 2-car garage
- Utilities: Public water; Municipal sewer connected; Cable available; Solid waste service
- Home design: Single-family residence; Two-story home; Faces southeast
- Construction: Brick and vinyl siding exterior; Slab foundation
- Exterior features: Covered patio; Full yard fencing; Mature trees; Cul-de-sac lot; Located in a subdivision; Has a view
Interior
- Kitchen: Electric oven; Microwave; Dishwasher; Refrigerator; Breakfast bar; Eat-in kitchen
- Bedrooms: 4 bedrooms on the upper level; Primary bedroom with walk-in closet and ensuite featuring a garden tub
- Bathrooms: 2 full bathrooms (upper level); 1 half bathroom (main level)
- Heating & cooling: Forced air heating (natural gas); Central air conditioning
- Interior features: Attic access; Breakfast bar; Eat-in kitchen; Smart thermostat; Gas-starter fireplace (1)
- Laundry & utility: Main-level laundry room with washer and dryer connections; Gas water heater
Neighborhood map
What this means for you Summary
Snapshot
- This is a 4-bed/2.5-bath single-family listed at $330k.
Deal economics
- At list price, monthly cash flow is $39 ($473/yr) — positive.
- The deal already cash-flows at list — no discount required.
- To meet the 1% rule (rent ≥ 1% of price), the offer needs to be $280k (15.3% below list).
- Recommended offer: $280k (15.3% below list) — sets the bar for 1% rule.
- Cap rate 6.4% vs local median 4.4% in Indianapolis city (balance) — top-decile yield for the area; either an underpriced asset or a hidden risk that comps aren't pricing in. Stress-test before assuming the spread holds.
Location & tenants
- Location reads: area grade D — affects rentability + tenant quality, not the cash-flow math above.
- Franklin Township Community School Corporation (urban): math 42% / reading 47% proficiency, ranked #87 of 301 in IN (top 29%) — families likely to look elsewhere, expect single-tenant / working-renter base with shorter leases.
- Zoned schools: Bunker Hill Elementary School (math 67% / reading 52%, grade B-, #128 of 994 statewide, top 15%, 501 students, 42% FRL); Franklin Central High School (math 41% / reading 69%, grade C, #77 of 369 statewide, top 21%, 3,319 students, 46% FRL) — zoned schools average 44% FRL vs 29% district-wide (15 pts higher); higher-poverty schools than district average — tighter screening recommended.
- Zoned-school proficiency averages 57% at this address vs 44% district-wide (+13 pts) — the actual schools serving this property are materially stronger than the Franklin Township Community School Corporation average implies; a family-tenant draw the district grade alone would hide.
- Market conditions: Rents rising (+3.8%/yr); 270 active listings in the ZIP; 1 comparable units currently listed for rent nearby; solid renter incomes; 1,906 units permitted in Marion County in 2024 (621 in 5+ unit buildings).
- This rent runs 42% of the median local income ($79k/yr) — at the standard rent-burdened threshold; future hikes will face affordability resistance.
Forward outlook
- Local home prices are declining (-3.0%/yr); year-one equity from $2k of loan paydown is wiped out by about $10k of value loss. Plan a longer hold.
- Marion County population projected at +18% by 2050 — long-run rental-demand tailwind backs the buy-and-hold thesis.
Negotiation context
- It's been on market 30 days — a 2% lower offer ($325k) is reasonable based on typical stale-listing flexibility.
- 2 sale attempts since 4y ago with the ask held roughly flat each time — persistent listings suggest the price (not the market) is what's stuck; bring a comps-based counter.
Questions for the listing agent
- What does the HOA fee cover, when was the last increase, and are there any pending special assessments or reserve-fund shortfalls?
- Is there a deadline driving the sale (1031 exchange, divorce, estate, relocation)? That informs how much negotiation room exists.
- The area grade is low — what's the realistic commute time and amenity access for the typical tenant pool here? Any planned neighborhood developments (good or bad) we should know about?
- What's the average days-on-market for RENTAL listings here right now (not sales)? A rising rental-DOM trend means longer vacancies and softer asking-rent achievability than the comps imply.
- What's the recent tenant-quality profile in this submarket — average credit score on applications, eviction rate, late-payment / NSF rate, and stable-employment percentage? A property-management company in the area should have these aggregated.
- How much new for-sale + rental construction is in the pipeline within 1–3 miles? Heavy new supply typically softens prices + rents 12–24 months out; constrained supply supports both.
Investment metrics
- 1% rule
- 0.85% ✗
- Cap rate
- 6.44%
- Cash-on-cash
- 0.51%
- DSCR
- 1.02
- GRM
- 9.8
CMA / ARV
- ARV (on-the-fly)
- $320,008
- Comps found
- 12
Show comp detail 12 sales within ~0.75 mi
| Address | Dist | Beds/Ba | Sqft | Sold | Price | $/sf | Match |
|---|---|---|---|---|---|---|---|
| 6904 Amber Springs Way | 0.15mi | 4/2.5 | 2,584 (+10%) | 2mo | $280,000 | $108 | 75 |
| 6530 Shelbyville Rd | 0.48mi | 4/2.0 | 2,344 (-0%) | 3mo | $294,900 | $126 | 72 |
| 6511 Flowstone Way | 0.18mi | 3/2.0 (-1) | 2,192 (-7%) | 2mo | $550,000 | $251 | 72 |
| 6822 Woodford Ln | 0.16mi | 3/2.5 (-1) | 2,544 (+8%) | 11mo | $345,000 | $136 | 65 |
| 6838 Five Points Rd | 0.49mi | 4/2.5 | 2,301 (-2%) | 11mo | $325,500 | $141 | 64 |
| 5724 Grassy Bank Dr | 0.69mi | 3/2.5 (-1) | 2,374 (+1%) | 1mo | $295,000 | $124 | 61 |
| 6311 Amber Valley Ln | 0.22mi | 3/2.5 (-1) | 2,035 (-14%) | 3mo | $275,000 | $135 | 60 |
| 6238 E Southport Rd | 0.67mi | 3/2.0 (-1) | 2,315 (-2%) | 0mo | $450,000 | $194 | 59 |
| 6111 S Irwin St | 0.34mi | 3/2.0 (-1) | 2,600 (+10%) | 8mo | $215,000 | $83 | 53 |
| 6602 Boston Ridge Ct | 0.38mi | 4/2.5 | 2,620 (+11%) | 12mo | $285,000 | $109 | 53 |
| 7008 Myra Way | 0.62mi | 5/3.0 (+1) | 2,578 (+10%) | 4mo | $365,000 | $142 | 45 |
| 5904 Sunstone Rd | 0.69mi | 5/3.0 (+1) | 2,578 (+10%) | 11mo | $373,000 | $145 | 36 |
Match score weights: distance 35% · size 25% · config 20% · recency 20%. Top-matched comps best support the ARV.
Projected returns pro-forma
-3.0% appreciation · 3.78% rent growth · sell at horizon
- IRR
- -14.7%
- Equity multiple
- 0.47×
- Total profit
- $-48,761
- Equity at exit
- $49,189
- IRR
- -4.8%
- Equity multiple
- 0.67×
- Total profit
- $-30,113
- Equity at exit
- $28,524
Cash invested: $92,372 (down + closing). Projections, not guarantees.
Landlord ↔ Tenant lean methodology
- Overall (STATE)
- 90 Strongly Landlord-Friendly
- State Indiana
- 90 Strongly Landlord-Friendly · R+11
- County
- — inherits STATE
- City
- — inherits STATE
ZIP-level market 46237
- Rents YoY
- 3.8%
- Active inventory
- 270
- Price-to-rent
- 9.8×
Monthly cashflow live
- Estimated rent
- $2,796 medium interval (Pro) →
- Mortgage (P&I)
- −$1,730
- Tax from tax record
- −$273 /mo · $3,270/yr
- Insurance
- −$137
- HOA
- −$29
- Vacancy / Maint / Mgmt
- −$587
- Net cashflow
- $39
Break-even live
Sensitivity live
| Price | -10% $226 | -5% $133 | +0% $39 | +5% $-54 | +10% $-147 |
|---|---|---|---|---|---|
| Rent | -10% $-181 | -5% $-71 | +0% $39 | +5% $150 | +10% $260 |
| Rate | -1.0pp $206 | -0.5pp $123 | base $39 | +0.5pp $-46 | +1.0pp $-133 |
UW: 25.0% down · 7.5% · 30yr · 1.5% tax · 5.0% vac · 8.0% maint · 8.0% mgmt
Financing live
Cash to close
- Down payment
- $82,475
- Closing costs
- $9,897
- Reserves months
- —
- Total cash needed
- —
Loan-product check · same deal, 3 products live
Conventional
25% down · 7.5% · 30yr
- Down + closing
- —
- Monthly P&I
- —
- Monthly cashflow
- —
- DSCR
- —
- Eligible?
- —
Personal DTI + credit; lowest rate.
DSCR
20% down · 8.5% · 30yr
- Down + closing
- —
- Monthly P&I
- —
- Monthly cashflow
- —
- DSCR
- —
- Eligible?
- —
No personal income docs; deal must DSCR.
Hard money
10% down · 12.0% · 12mo
- Down + closing
- —
- Monthly P&I
- —
- Monthly cashflow
- —
- DSCR
- —
- Eligible?
- —
Short-term bridge; refi at stabilization.
Rent comps 1 comps
| Address | Beds | Baths | Sqft | Rent | $/sqft | DOM | Units | Dist |
|---|---|---|---|---|---|---|---|---|
| 7703 Janel Ct Indianapolis, IN | 4.0 | 2.5 | 1824 | $4,950 | $2.71 | 25d | 1 | 1.42mi |
HOA detail
- Monthly dues
- $29 · $348/yr
Listing history 17 events
-
2026-06-21days on market $329,900 Active 30 DOM
-
2026-06-18days on market $329,900 Active 27 DOM
-
2026-06-17days on market $329,900 Active 26 DOM
-
2026-06-16days on market $329,900 Active 25 DOM
-
2026-06-15days on market $329,900 Active 24 DOM
-
2026-06-13days on market $329,900 Active 22 DOM
-
2026-06-09days on market $329,900 Active 18 DOM
-
2026-06-08days on market $329,900 Active 17 DOM
-
2026-06-07days on market $329,900 Active 16 DOM
-
2026-06-03days on market $329,900 Active 12 DOM
-
2026-06-02pricedays on market $329,900 Active 11 DOM
-
2026-06-01days on market $340,000 Active 10 DOM
-
2026-05-31days on market $340,000 Active 9 DOM
-
2026-05-22$340,000 Active
-
2022-07-25soldstatus $310,000 Closed 626-char remark
Show marketing remark (626 chars)
Beautiful 4BR home in immaculate condition located in small Franklin Township neighborhood! Home sits on nearly half an acre in a quiet cul de sac, with a large fenced in rear yard that backs up to woods for extra privacy. Plenty of living space with large family room, living room and upstairs loft. LVP downstairs, new carpets installed upstairs in 2021. Lots of natural light in kitchen & dining area. Huge owners' suite with reading nook, walk in closets, garden tub and new double vanity. Relax or entertain in backyard oasis! Fantastic two tiered deck overlooking woods. This home has it all and is move in ready!
-
2022-06-11status Pending 626-char remark
Show marketing remark (626 chars)
Beautiful 4BR home in immaculate condition located in small Franklin Township neighborhood! Home sits on nearly half an acre in a quiet cul de sac, with a large fenced in rear yard that backs up to woods for extra privacy. Plenty of living space with large family room, living room and upstairs loft. LVP downstairs, new carpets installed upstairs in 2021. Lots of natural light in kitchen & dining area. Huge owners' suite with reading nook, walk in closets, garden tub and new double vanity. Relax or entertain in backyard oasis! Fantastic two tiered deck overlooking woods. This home has it all and is move in ready!
-
2022-06-10$300,000 Active 626-char remark
Show marketing remark (626 chars)
Beautiful 4BR home in immaculate condition located in small Franklin Township neighborhood! Home sits on nearly half an acre in a quiet cul de sac, with a large fenced in rear yard that backs up to woods for extra privacy. Plenty of living space with large family room, living room and upstairs loft. LVP downstairs, new carpets installed upstairs in 2021. Lots of natural light in kitchen & dining area. Huge owners' suite with reading nook, walk in closets, garden tub and new double vanity. Relax or entertain in backyard oasis! Fantastic two tiered deck overlooking woods. This home has it all and is move in ready!
ⓘ Source: listings_history table (triggers on properties + properties_extension) + one-shot
backfill from property_details.listing_events for pre-trigger history.
Tax reassessment forecast IN · Partial reset (capped growth)
- Current annual tax
- $3,270 · $273/mo
- Projected year-2 tax
- $3,270 · $273/mo
- Expected delta
- $0/yr ($0/mo · 0.0%)
ⓘ Screening estimate from a state-policy table — verify with the county assessor before closing.
Climate risk First Street
- Flood 1/10 Low FEMA zone X (unshaded) · 0% chance over 30 yrs
- Wildfire 1/10 Low
- Heat 3/10 Moderate 7 d/yr ≥102°F today · 19 d/yr by 30 yrs out
- Wind 2/10 Low 100% chance of damaging wind over 30 yrs
- Air quality 2/10 Low 1 unhealthy d/yr today · 2 by 30 yrs out
Nearby sold comps map
Loading sold comps map…
Walkable amenities ~0.75 mi
Loading nearby amenities…
Taxation est. · year 1
- Rental income
- $33,546
- − Mortgage interest
- −$18,480
- − Property taxes
- −$3,270
- − Insurance
- −$1,650
- − Repairs & maintenance
- −$2,684
- − Management
- −$2,684
- − HOA
- −$348
- − Depreciation
- −$9,597
- Taxable loss
- −$5,166
- Est. tax savings @ 24.0%
- +$1,240
- After-tax cash flow
- $1,713/yr
For passive investors: Depreciation is non-cash, so a rental often shows a tax loss while cash-flowing — sheltering income. Rental losses are passive: they offset passive income freely, and up to $25,000/yr can offset ordinary (W-2) income if you actively participate and your MAGI is under $100k (phasing out to $0 by $150k); unused losses carry forward. On sale, claimed depreciation is recaptured at up to 25%, and gains may owe capital-gains tax (a 1031 exchange can defer both). Figures are a year-1 estimate at your 24.0% rate — not tax advice; consult a CPA.
Schools (NCES district)
- District
- Franklin Township Community School Corporation
- NCES district ID
- 1803750
- Math proficiency
- 42% ▼ -12.00%
- Reading proficiency
- 47% ▼ -6.00%
- Median HH income
- $67,825
- Composite
- 39.91/100
- National rank
- #3852
- State rank
- #87 of 301 in IN
Livability — Indianapolis city (balance)
No livability data for this city. (Only ~50 U.S. cities are tracked.)
Census & demographics
- Census place
- Indianapolis city (balance), IN
- County
- Marion County · 998,460 people
- City population
- 881,119
- Metro
- Indianapolis-Carmel-Anderson, IN
- Population (ZIP)
- 43,473
- Household income
- $79,078
- Rent vs Own
- Severe rent burden
- 1245.0
Population outlook (Marion County) Hauer SSP2
- Today (2025)
- 1,025,572 people
- By 2030
- 1,065,727 · +3.9%
- By 2040
- 1,141,577 · +11.3%
- By 2050
- 1,208,920 · +17.9%
- By 2075
- 1,367,288 · +33.3%
- By 2100
- 1,438,201 · +40.2%
Race, ethnicity, and origin ACS 2023
- Neighborhood character
- Predominantly White (71%)
- Race & ethnicity
- White 71% Asian 13% Hispanic / Latino 7% Two or more races 6% Black 5%
- Hispanic origin (detail)
- Mexican 6%
- Common ancestry
- Italian 2% Lithuanian 2% Romanian 2%
- Foreign-born
- 12% · Canada, Philippines
- Languages at home
- 84% English-only · Other Asian/Pacific 5% Spanish 5% Other Indo-European 4%
Political lean MEDSL · Marion
- 2024 margin
- Strong D (+27.7) · D 63.0% · R 35.3% · Other 1.7%
- 2008→2024 swing
- -0.7pp no change · 2008: 28.4pp · 2024: 27.7pp
- All cycles
- 2024: D+27.7 2020: D+29.1 2016: D+22.8 2012: D+22.2 2008: D+28.4
Not yet ingested
- Civics
- —
Market trends
- HPI YoY
- ▼ -180.33%
- Current HPI
- 238.9661
- Rent YoY
- ▲ 3.78%
- Metro
- Indianapolis-Carmel-Anderson, IN
- State GDP YoY
- ▲ 2.90%
- F500 in state
- 18
Industry mix (Fortune 500 HQ in IN)
| Industry | F500 HQs | Revenue |
|---|---|---|
| Industrial Machinery | 2 | $37B |
|
||
| Healthcare | 1 | $177B |
|
||
| Pharmaceuticals | 1 | $45B |
|
||
| Metals / Steel | 1 | $18B |
|
||
| Agriculture | 1 | $17B |
|
||
| Packaging | 1 | $12B |
|
||
Price history
+13.3% since first listed4 events — show timeline
- 2026-05-22 Listed $340,000 MIBOR as Distributed by MLS Grid
- 2022-07-25 Sold (MLS) $310,000 MIBOR as Distributed by MLS Grid
- 2022-06-11 Pending — MIBOR as Distributed by MLS Grid
- 2022-06-10 Listed $300,000 MIBOR as Distributed by MLS Grid
Property tax history
+7.2%/yrLatest (2025): $3,270 · +0.4% YoY. Source: county tax records.
Cash-flow waterfall
monthlySold comps — $/sqft
last 12 mo · ≤1 miLoading sold comps…