2412 Creswell Ave · Shreveport, LA
Flood risk 1/10 · Minimal
- FEMA flood zone
- X (unshaded)
- Chance of flooding over 30 yrs
- 0.0%
- Est. flood insurance / yr
- $507 – $1,088
Fire risk 1/10 · Minimal
- Est. fire insurance / yr
- $1,269 – $2,357
Heat risk 7/10 · Major
- Hot days now (above 110°F)
- 7 days/yr
- Hot days in 30 yrs
- 21 days/yr
Wind risk 6/10 · Moderate
- Chance of severe wind over 30 yrs
- 66.0%
Air-quality risk 2/10 · Minimal
- Unhealthy air days now
- 1 days/yr
- Unhealthy air days in 30 yrs
- 2 days/yr
Risk factors via First Street. Map © Google.
Why this score? — see what drove the B- grade
The composite is a weighted blend of 9 inputs, each scored 0–100. Each bar is that input's sub-score; the figure is the points it added to the 100-point composite (weight × sub-score).
- Cash flow +30.0/30.0
- 1% rule +10.0/10.0
- DSCR +10.0/10.0
- ARV discount +7.5/15.0
- Rent growth +3.4/5.0
- Livability +3.0/5.0
- Condition / age +2.5/5.0
- Schools +2.2/10.0
- Appreciation +0.0/10.0
$45,000
🖨 Deal sheet 📄 Offer letter ✓ Due diligence
Listing remarks MLS
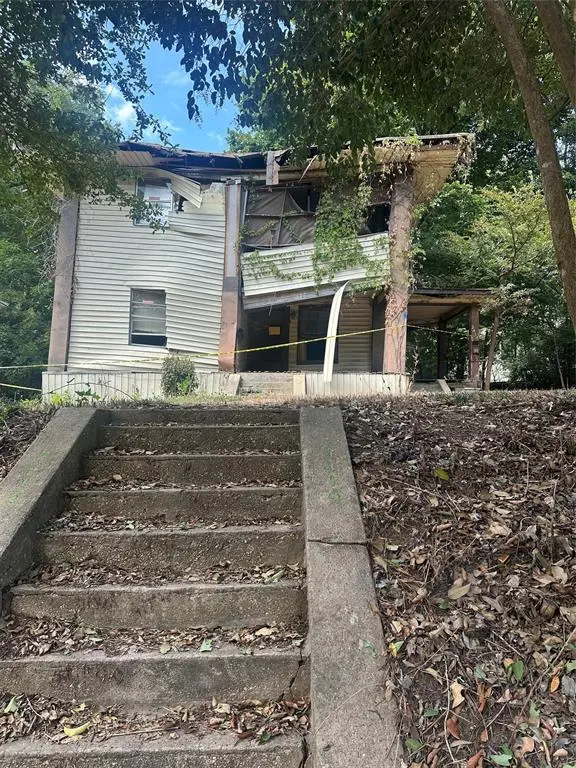
Investor Opportunity in Historic District – Cash Only! Calling all investors! This property, located in a sought-after historic district, offers tons of potential for the right buyer. Cash-only purchase required, and rebuild restrictions apply. Important: The home is in a state of disrepair. Anyone entering the property does so at their own risk. The seller, listing agent, and agencies will not be held responsible for any injuries. Don’t miss this rare opportunity to bring your vision to life in a historic area!
Key facts
- 8,059 sq ft lot
- Built 1992
- Listed 85 days
Neighborhood map
What this means for you Summary
Snapshot
- This is a 4-bed/2.0-bath single-family listed at $45k.
Deal economics
- At list price, monthly cash flow is $684 ($8k/yr) — positive.
- The deal already cash-flows at list — no discount required.
- Meets the 1% rule at list price ($1k rent vs $45k).
- Recommended offer: $42k (6.0% below list) — sets the bar for market timing.
- Cap rate 24.5% vs local median 5.7% in Shreveport — top-decile yield for the area; either an underpriced asset or a hidden risk that comps aren't pricing in. Stress-test before assuming the spread holds.
Location & tenants
- Location reads 59/100 on livability (#270 in LA) — a working-class tenant base; expect higher turnover. Strengths: cost of living A+, housing A; Watch: schools D+, crime F, amenities F.
- Caddo Parish (urban): math 21% / reading 32% proficiency, ranked #53 of 98 in LA (top 54%) — low school quality limits family demand, transient renter base, plan for 1-2y turnover; 64% free/reduced lunch — lower-income household profile, screen leases tightly.
- Market conditions: Rents rising (+3.6%/yr); 146 active listings in the ZIP; 17 comparable units currently listed for rent nearby; rentals at typical pace (median 21d on market — plan ~3-4 weeks tenant-placement turnaround); 221 units permitted in Caddo Parish in 2024 (0 in 5+ unit buildings).
Forward outlook
- Local home prices are declining (-3.0%/yr); year-one equity from $311 of loan paydown is wiped out by about $1k of value loss. Plan a longer hold.
- Caddo County population projected at -15% by 2050 — secular population decline; favor cash flow + early exit over multi-decade hold.
- At projected returns (-3.0% appreciation + 3.6% rent growth), your $13k cash investment doubles in ~2 years — after that, you're playing with house money.
Negotiation context
- It's been on market 85 days — a 6% lower offer ($42k) is reasonable based on typical stale-listing flexibility.
Risks & watch-outs
- Climate carrying-cost: major wind risk, 66% chance of damaging wind over 30y; extreme-heat days projected 7→21/yr by 2055 (HVAC capex compounding) — expect insurance premiums to compound above CPI over the hold.
Questions for the listing agent
- It's been on market 85 days. Have you received any prior offers? Is the seller open to a 6% concession, seller financing, or rate buy-down credit?
- Why hasn't it sold? Are there any deal-killer items the seller is aware of (foundation, flood, title, zoning, code violations)?
- Is there a deadline driving the sale (1031 exchange, divorce, estate, relocation)? That informs how much negotiation room exists.
- Schools are D-rated, which usually means shorter tenancies and higher turnover. Who's the typical renter profile here, and what's been the actual vacancy rate?
- Crime grade is F in this area — have there been break-ins, vandalism, or insurance claims at this property in the last 3 years? What carrier currently insures it and at what premium?
- What's the average days-on-market for RENTAL listings here right now (not sales)? A rising rental-DOM trend means longer vacancies and softer asking-rent achievability than the comps imply.
- What's the recent tenant-quality profile in this submarket — average credit score on applications, eviction rate, late-payment / NSF rate, and stable-employment percentage? A property-management company in the area should have these aggregated.
- How much new for-sale + rental construction is in the pipeline within 1–3 miles? Heavy new supply typically softens prices + rents 12–24 months out; constrained supply supports both.
Investment metrics
- 1% rule
- 2.80% ✓
- Cap rate
- 24.52%
- Cash-on-cash
- 65.10%
- DSCR
- 3.90
- GRM
- 3.0
CMA / ARV
- ARV (median comp)
- $115,022
- List price
- $45,000
- Delta
- -60.88%
- Verdict
- UNDERPRICED
- Comps
- 20 within 1.0 mi
Show comp detail 12 sales within ~0.75 mi
| Address | Dist | Beds/Ba | Sqft | Sold | Price | $/sf | Match |
|---|---|---|---|---|---|---|---|
| 2310 Highland Ave | 0.14mi | 3/1.5 (-1) | 1,611 (+1%) | 5mo | $115,000 | $71 | 80 |
| 622 Kirby Pl | 0.24mi | 3/2.0 (-1) | 1,515 (-5%) | 2mo | $149,900 | $99 | 74 |
| 445 Boulevard St | 0.19mi | 4/2.0 | 1,756 (+10%) | 5mo | $175,000 | $100 | 70 |
| 813 Dalzell St | 0.27mi | 3/2.0 (-1) | 1,771 (+11%) | 8mo | $164,500 | $93 | 57 |
| 631 Gladstone Blvd | 0.65mi | 3/1.0 (-1) | 1,639 (+3%) | 1mo | $165,000 | $101 | 55 |
| 426 Stephenson St | 0.72mi | 3/2.5 (-1) | 1,633 (+3%) | 1mo | $207,500 | $127 | 54 |
| 120 Dalzell St | 0.62mi | 4/2.0 | 1,704 (+7%) | 8mo | $80,000 | $47 | 52 |
| 404 Washington St | 0.34mi | 3/2.0 (-1) | 1,367 (-14%) | 5mo | $130,000 | $95 | 52 |
| 149 College St | 0.57mi | 3/2.0 (-1) | 1,735 (+9%) | 9mo | $205,000 | $118 | 46 |
| 117 Merrick St | 0.64mi | 3/1.5 (-1) | 1,762 (+11%) | 1mo | $90,000 | $51 | 44 |
| 225 Prospect St | 0.48mi | 3/3.0 (-1) | 1,819 (+14%) | 9mo | $220,000 | $121 | 37 |
| 123 Dalzell St | 0.60mi | 3/1.0 (-1) | 1,377 (-13%) | 7mo | $80,000 | $58 | 35 |
Match score weights: distance 35% · size 25% · config 20% · recency 20%. Top-matched comps best support the ARV.
Projected returns pro-forma
-3.0% appreciation · 3.56% rent growth · sell at horizon
- IRR
- 64.9%
- Equity multiple
- 3.93×
- Total profit
- $36,975
- Equity at exit
- $6,710
- IRR
- 69.4%
- Equity multiple
- 8.25×
- Total profit
- $91,291
- Equity at exit
- $3,891
Cash invested: $12,600 (down + closing). Projections, not guarantees.
Landlord ↔ Tenant lean methodology
- Overall (STATE)
- 90 Strongly Landlord-Friendly
- State Louisiana
- 90 Strongly Landlord-Friendly · R+12
- County
- — inherits STATE
- City
- — inherits STATE
ZIP-level market 71104
- Home prices YoY
- -32.2%
- Rents YoY
- 3.6%
- Active inventory
- 146
- Price-to-rent
- 3.0×
Monthly cashflow live
- Estimated rent
- $1,258 high interval (Pro) →
- Mortgage (P&I)
- −$236
- Tax from tax record
- −$55 /mo · $665/yr
- Insurance
- −$19
- HOA
- −$0
- Vacancy / Maint / Mgmt
- −$264
- Net cashflow
- $684
Break-even live
UW: 25.0% down · 7.5% · 30yr · 1.5% tax · 5.0% vac · 8.0% maint · 8.0% mgmt
Financing live
Cash to close
- Down payment
- $11,250
- Closing costs
- $1,350
- Reserves months
- —
- Total cash needed
- —
Loan-product check · same deal, 3 products live
Conventional
25% down · 7.5% · 30yr
- Down + closing
- —
- Monthly P&I
- —
- Monthly cashflow
- —
- DSCR
- —
- Eligible?
- —
Personal DTI + credit; lowest rate.
DSCR
20% down · 8.5% · 30yr
- Down + closing
- —
- Monthly P&I
- —
- Monthly cashflow
- —
- DSCR
- —
- Eligible?
- —
No personal income docs; deal must DSCR.
Hard money
10% down · 12.0% · 12mo
- Down + closing
- —
- Monthly P&I
- —
- Monthly cashflow
- —
- DSCR
- —
- Eligible?
- —
Short-term bridge; refi at stabilization.
Rent comps 17 comps
| Address | Beds | Baths | Sqft | Rent | $/sqft | DOM | Units | Dist |
|---|---|---|---|---|---|---|---|---|
| 642 Robinson Pl Shreveport, LA | 3.0 | 1.0 | 1500 | $1,275 | $0.85 | 21d | 1 | 0.11mi |
| 419 Boulevard St Shreveport, LA | 3.0 | 2.0 | 1852 | $1,100 | $0.59 | 43d | 1 | 0.25mi |
| 2109 Highland Ave Shreveport, LA | 3.0 | 1.0 | 1739 | $1,050 | $0.60 | 43d | 1 | 0.27mi |
| 442 Merrick St Shreveport, LA | 3.0 | 1.5 | 1595 | $1,000 | $0.63 | 43d | 1 | 0.32mi |
| 140 Wilkinson St Unit 142 Shreveport, LA | 3.0 | 3.0 | 1174 | $1,300 | $1.11 | 21d | 1 | 0.58mi |
| 140 E Wilkinson St Shreveport, LA | 3.0 | 3.0 | 1174 | $1,300 | $1.11 | 21d | 1 | 0.74mi |
| 320 Stephenson St Shreveport, LA | 3.0 | 2.0 | 1845 | $1,675 | $0.91 | 21d | 1 | 0.76mi |
| 320 Stephenson St Shreveport, LA | 3.0 | 2.0 | 1845 | $1,675 | $0.91 | 13d | 1 | 0.76mi |
| 451 Egan St Shreveport, LA | 3.0 | 1.5 | 1300 | $750 | $0.58 | 13d | 1 | 0.77mi |
| 2811 Samford Ave Shreveport, LA | 3.0 | 1.0 | 1612 | $850 | $0.53 | 13d | 1 | 0.87mi |
| 3624 Gilbert Dr Shreveport, LA | 3.0 | 3.0 | 2088 | $1,900 | $0.91 | 43d | 1 | 0.94mi |
| 1225 Pecan St Unit B Shreveport, LA | 3.0 | 2.0 | 1070 | $900 | $0.84 | 21d | 1 | 1.24mi |
| 1147 Cornwell Ave Unit 1 Shreveport, LA | 3.0 | 2.0 | 1200 | $895 | $0.75 | 13d | 1 | 1.25mi |
| 3827 Baltimore Ave Shreveport, LA | 3.0 | 2.5 | 1650 | $1,650 | $1.00 | 43d | 1 | 1.37mi |
| 2506 Mecom Dr Shreveport, LA | 3.0 | 1.5 | 1433 | $1,350 | $0.94 | 13d | 1 | 1.46mi |
| 2615 Judith Pl Shreveport, LA | 3.0 | 2.0 | 1450 | $1,600 | $1.10 | 13d | 1 | 1.48mi |
| 1719 Lakeshore Dr Shreveport, LA | 3.0 | 1.5 | 1200 | $950 | $0.79 | 43d | 1 | 1.49mi |
Listing history 18 events
-
2026-06-18days on market $45,000 Active 85 DOM
-
2026-06-17days on market $45,000 Active 84 DOM
-
2026-06-16days on market $45,000 Active 83 DOM
-
2026-06-15days on market $45,000 Active 82 DOM
-
2026-06-14days on market $45,000 Active 80 DOM
-
2026-06-13days on market $45,000 Active 79 DOM
-
2026-06-10days on market $45,000 Active 77 DOM
-
2026-06-09days on market $45,000 Active 76 DOM
-
2026-06-08days on market $45,000 Active 75 DOM
-
2026-06-07days on market $45,000 Active 74 DOM
-
2026-06-05days on market $45,000 Active 71 DOM
-
2026-06-03days on market $45,000 Active 70 DOM
-
2026-06-02days on market $45,000 Active 69 DOM
-
2026-06-01days on market $45,000 Active 68 DOM
-
2026-05-31days on market $45,000 Active 67 DOM
-
2026-05-30days on market $45,000 Active 66 DOM
-
2026-03-25$45,000 Active 531-char remark
Show marketing remark (531 chars)
Investor Opportunity in Historic District – Cash Only! Calling all investors! This property, located in a sought-after historic district, offers tons of potential for the right buyer. Cash-only purchase required, and rebuild restrictions apply. Important: The home is in a state of disrepair. Anyone entering the property does so at their own risk. The seller, listing agent, and agencies will not be held responsible for any injuries. Don’t miss this rare opportunity to bring your vision to life in a historic area!
-
1990-09-11soldstatus
ⓘ Source: listings_history table (triggers on properties + properties_extension) + one-shot
backfill from property_details.listing_events for pre-trigger history.
Tax reassessment forecast LA · Resets to sale price
- Current annual tax
- $665 · $55/mo
- Projected year-2 tax
- $665 · $55/mo
- Expected delta
- $0/yr ($0/mo · 0.0%)
ⓘ Screening estimate from a state-policy table — verify with the county assessor before closing.
Climate risk First Street
- Flood 1/10 Low FEMA zone X (unshaded) · 0% chance over 30 yrs
- Wildfire 1/10 Low
- Heat 7/10 Severe 7 d/yr ≥110°F today · 21 d/yr by 30 yrs out
- Wind 6/10 Major 66% chance of damaging wind over 30 yrs
- Air quality 2/10 Low 1 unhealthy d/yr today · 2 by 30 yrs out
Nearby sold comps map
Loading sold comps map…
Walkable amenities ~0.75 mi
Loading nearby amenities…
Taxation est. · year 1
- Rental income
- $15,095
- − Mortgage interest
- −$2,521
- − Property taxes
- −$665
- − Insurance
- −$225
- − Repairs & maintenance
- −$1,208
- − Management
- −$1,208
- − Depreciation
- −$1,309
- Taxable income
- $7,959
- Est. tax owed @ 24.0%
- −$1,910
- After-tax cash flow
- $6,292/yr
For passive investors: Depreciation is non-cash, so a rental often shows a tax loss while cash-flowing — sheltering income. Rental losses are passive: they offset passive income freely, and up to $25,000/yr can offset ordinary (W-2) income if you actively participate and your MAGI is under $100k (phasing out to $0 by $150k); unused losses carry forward. On sale, claimed depreciation is recaptured at up to 25%, and gains may owe capital-gains tax (a 1031 exchange can defer both). Figures are a year-1 estimate at your 24.0% rate — not tax advice; consult a CPA.
Schools (NCES district)
- District
- Caddo Parish
- NCES district ID
- 2200300
- Math proficiency
- 21% ▼ -33.00%
- Reading proficiency
- 32% ▼ -30.00%
- Median HH income
- $39,227
- Composite
- 22.23/100
- National rank
- #8148
- State rank
- #53 of 98 in LA
Livability — Shreveport
- Score
- 59/100
- State rank
- #270
- US rank
- #19730
Category grades
Schools grade is shown separately in the Schools card above.
Census & demographics
- Census place
- Shreveport, LA
- County
- Caddo Parish · 178,536 people
- City population
- 164,123
- Metro
- Shreveport-Bossier City, LA
- Population (ZIP)
- 12,975
- Household income
- $56,833
- Rent vs Own
- Severe rent burden
- 759.0
Population outlook (Caddo County) Hauer SSP2
- Today (2025)
- 243,190 people
- By 2030
- 237,231 · -2.5%
- By 2040
- 222,502 · -8.5%
- By 2050
- 206,516 · -15.1%
- By 2075
- 165,706 · -31.9%
- By 2100
- 122,262 · -49.7%
Race, ethnicity, and origin ACS 2023
- Neighborhood character
- Diverse neighborhood (Simpson 0.63)
- Race & ethnicity
- White 53% Black 28% Two or more races 10% Hispanic / Latino 10% Asian 3%
- Hispanic origin (detail)
- Mexican 7%
- Common ancestry
- Slovak 6% Lithuanian 4% Scottish 2%
- Foreign-born
- 5% · Canada, Vietnam
- Languages at home
- 90% English-only · Spanish 5% French/Haitian/Cajun 1% Tagalog/Filipino 1%
Political lean MEDSL · Caddo
- 2024 margin
- Toss-up / Even · D 51.6% · R 47.0% · Other 1.4%
- 2008→2024 swing
- +1.6pp toward D · 2008: 3.0pp · 2024: 4.6pp
- All cycles
- 2024: D+4.6 2020: D+6.8 2016: D+4.2 2012: D+4.9 2008: D+3.0
Not yet ingested
- Civics
- —
Market trends
- HPI YoY
- ▼ -49.61%
- Current HPI
- 104.3781
- Rent YoY
- ▲ 3.56%
- Metro
- Shreveport-Bossier City, LA
- State GDP YoY
- ▲ 3.29%
- F500 in state
- 10
Industry mix (Fortune 500 HQ in LA)
| Industry | F500 HQs | Revenue |
|---|---|---|
| Telecommunications | 2 | $23B |
|
||
| Utilities | 1 | $12B |
|
||
| Wholesale / Distribution | 1 | $5B |
|
||
| Advertising | 1 | $2B |
|
||
Price history
2 events — show timeline
- 2026-03-25 Listed $45,000 NTREIS
- 1990-09-11 Sold (Public Records) — Public Records
Property tax history
+11.5%/yrLatest (2025): $665 · +0.4% YoY. Source: county tax records.
Cash-flow waterfall
monthlySold comps — $/sqft
last 12 mo · ≤1 miLoading sold comps…