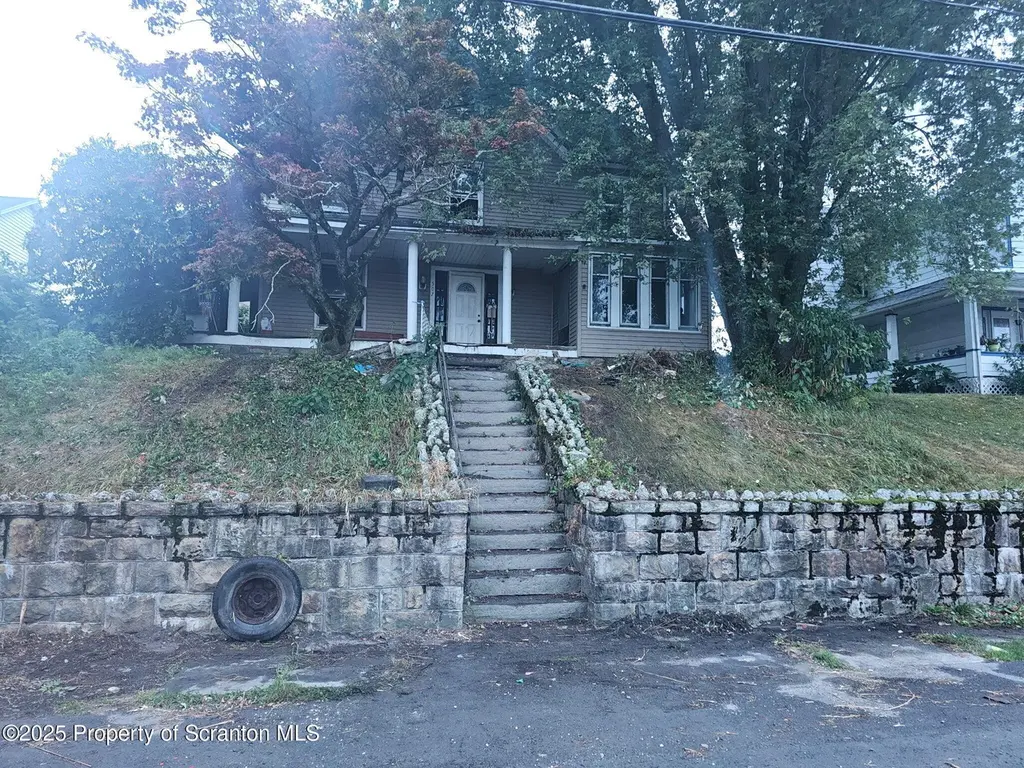
507 Delaware St · Forest City, PA
Flood risk 1/10 · Minimal
- FEMA flood zone
- X (unshaded)
- Chance of flooding over 30 yrs
- 0.0%
- Est. flood insurance / yr
- $473 – $860
Fire risk 1/10 · Minimal
- Est. fire insurance / yr
- $511 – $949
Heat risk 2/10 · Minimal
- Hot days now (above 88°F)
- 8 days/yr
- Hot days in 30 yrs
- 18 days/yr
Wind risk 2/10 · Minimal
- Chance of severe wind over 30 yrs
- 2.0%
Air-quality risk 2/10 · Minimal
- Unhealthy air days now
- 1 days/yr
- Unhealthy air days in 30 yrs
- 1 days/yr
Risk factors via First Street. Map © Google.
Why this score? — see what drove the B+ grade
The composite is a weighted blend of 9 inputs, each scored 0–100. Each bar is that input's sub-score; the figure is the points it added to the 100-point composite (weight × sub-score).
- Cash flow +30.0/30.0
- 1% rule +10.0/10.0
- DSCR +10.0/10.0
- Appreciation +10.0/10.0
- ARV discount +7.5/15.0
- Schools +3.6/10.0
- Livability +3.3/5.0
- Rent growth +2.5/5.0
- Condition / age +2.5/5.0
$90,000
🖨 Deal sheet 📄 Offer letter ✓ Due diligence
Listing remarks MLS
Bring your dreams to life by restoring this large 5 bedroom 1 and a half bath two story home !! Large living room for entertaining. The possibilities are endless. Take a look and see for yourself. If you are looking for a home for yourself or an investment property, this may be it!
Key facts
- 0.34 acre lot
- Built 1920
- Listed 223 days
Neighborhood map
What this means for you Summary
Snapshot
- This is a 5-bed/1.5-bath other listed at $90k.
Deal economics
- At list price, monthly cash flow is $578 ($7k/yr) — positive.
- The deal already cash-flows at list — no discount required.
- Meets the 1% rule at list price ($2k rent vs $90k).
- Recommended offer: $79k (12.0% below list) — sets the bar for market timing.
Location & tenants
- Location reads 66/100 on livability (#1,019 in PA) — a middle-class / working-renter tenant base. Strengths: crime A+, cost of living A+, housing A+; Watch: amenities F, commute F, employment D-.
- Forest City Regional SD (suburban): math 34% / reading 51% proficiency, ranked #308 of 539 in PA (top 57%) — families likely to look elsewhere, expect single-tenant / working-renter base with shorter leases.
- Market conditions: 53 active listings in the ZIP; 80 units permitted in Susquehanna County in 2024 (5 in 5+ unit buildings).
Forward outlook
- In year one you build about $10k of equity ($622 loan paydown + $9k appreciation (10.0% local appreciation)).
- Susquehanna County population projected at -30% by 2050 — secular population decline; favor cash flow + early exit over multi-decade hold.
- At projected returns (10.0% appreciation + 3.0% rent growth), your $25k cash investment doubles in ~2 years — after that, you're playing with house money.
- By year 4, paydown + projected appreciation supports a ~$34k cash-out refi (75% LTV) — recoverable capital for the next deal without selling this one.
Negotiation context
- It's been on market 223 days — a 12% lower offer ($79k) is reasonable based on typical stale-listing flexibility.
- 2 sale attempts; this cycle's ask has dropped $5k (5%) from the opening price — seller is motivated, your offer sets the floor, not the list.
- Current owner paid $20k; list at $90k implies a 352% gain — meaningful room to come down on a strong offer.
Risks & watch-outs
- Watch-outs: property tax is 3.0% of price; built in 1920 — expect roof / HVAC / electrical / plumbing capex.
Questions for the listing agent
- It's been on market 223 days. Have you received any prior offers? Is the seller open to a 12% concession, seller financing, or rate buy-down credit?
- Built in 1920 — when were the roof, HVAC, electrical panel, plumbing, and water heater last replaced?
- Property tax is high relative to price — has the assessment been appealed recently, and will the sale trigger a re-assessment?
- Why hasn't it sold? Are there any deal-killer items the seller is aware of (foundation, flood, title, zoning, code violations)?
- Is there a deadline driving the sale (1031 exchange, divorce, estate, relocation)? That informs how much negotiation room exists.
- What's the average days-on-market for RENTAL listings here right now (not sales)? A rising rental-DOM trend means longer vacancies and softer asking-rent achievability than the comps imply.
- What's the recent tenant-quality profile in this submarket — average credit score on applications, eviction rate, late-payment / NSF rate, and stable-employment percentage? A property-management company in the area should have these aggregated.
- How much new for-sale + rental construction is in the pipeline within 1–3 miles? Heavy new supply typically softens prices + rents 12–24 months out; constrained supply supports both.
Investment metrics
- 1% rule
- 1.84% ✓
- Cap rate
- 14.00%
- Cash-on-cash
- 27.54%
- DSCR
- 2.23
- GRM
- 4.5
CMA / ARV
- ARV (median comp)
- $188,406
- List price
- $90,000
- Delta
- -52.23%
- Verdict
- UNDERPRICED
- Comps
- 12 within 1.0 mi
Projected returns pro-forma
10.0% appreciation · 3.0% rent growth · sell at horizon
- IRR
- 45.1%
- Equity multiple
- 4.41×
- Total profit
- $85,941
- Equity at exit
- $81,079
- IRR
- 39.2%
- Equity multiple
- 9.90×
- Total profit
- $224,302
- Equity at exit
- $174,850
Cash invested: $25,200 (down + closing). Projections, not guarantees.
Landlord ↔ Tenant lean methodology
- Overall (STATE)
- 62 Landlord-Friendly
- State Pennsylvania
- 62 Landlord-Friendly · EVEN
- County
- — inherits STATE
- City
- — inherits STATE
ZIP-level market 18421
- Home prices YoY
- 20.9%
- Active inventory
- 53
- Price-to-rent
- 4.5×
Monthly cashflow live
- Estimated rent
- $1,659 medium interval (Pro) →
- Mortgage (P&I)
- −$472
- Tax from tax record
- −$223 /mo · $2,674/yr
- Insurance
- −$38
- HOA
- −$0
- Vacancy / Maint / Mgmt
- −$348
- Net cashflow
- $578
Break-even live
UW: 25.0% down · 7.5% · 30yr · 1.5% tax · 5.0% vac · 8.0% maint · 8.0% mgmt
Financing live
Cash to close
- Down payment
- $22,500
- Closing costs
- $2,700
- Reserves months
- —
- Total cash needed
- —
Loan-product check · same deal, 3 products live
Conventional
25% down · 7.5% · 30yr
- Down + closing
- —
- Monthly P&I
- —
- Monthly cashflow
- —
- DSCR
- —
- Eligible?
- —
Personal DTI + credit; lowest rate.
DSCR
20% down · 8.5% · 30yr
- Down + closing
- —
- Monthly P&I
- —
- Monthly cashflow
- —
- DSCR
- —
- Eligible?
- —
No personal income docs; deal must DSCR.
Hard money
10% down · 12.0% · 12mo
- Down + closing
- —
- Monthly P&I
- —
- Monthly cashflow
- —
- DSCR
- —
- Eligible?
- —
Short-term bridge; refi at stabilization.
Listing history 10 events
-
2026-06-18days on market $90,000 Active 223 DOM
-
2026-06-17days on market $90,000 Active 222 DOM
-
2026-06-16days on market $90,000 Active 221 DOM
-
2026-05-31days on market $90,000 Active 220 DOM
-
2026-05-30days on market $90,000 Active 219 DOM
-
2026-04-13status Active 282-char remark
Show marketing remark (282 chars)
Bring your dreams to life by restoring this large 5 bedroom 1 and a half bath two story home !! Large living room for entertaining. The possibilities are endless. Take a look and see for yourself. If you are looking for a home for yourself or an investment property, this may be it!
-
2026-04-13status Pending 282-char remark
Show marketing remark (282 chars)
Bring your dreams to life by restoring this large 5 bedroom 1 and a half bath two story home !! Large living room for entertaining. The possibilities are endless. Take a look and see for yourself. If you are looking for a home for yourself or an investment property, this may be it!
-
2026-01-13price $90,000 282-char remark
Show marketing remark (282 chars)
Bring your dreams to life by restoring this large 5 bedroom 1 and a half bath two story home !! Large living room for entertaining. The possibilities are endless. Take a look and see for yourself. If you are looking for a home for yourself or an investment property, this may be it!
-
2025-10-22$95,000 Active 282-char remark
Show marketing remark (282 chars)
Bring your dreams to life by restoring this large 5 bedroom 1 and a half bath two story home !! Large living room for entertaining. The possibilities are endless. Take a look and see for yourself. If you are looking for a home for yourself or an investment property, this may be it!
-
2011-06-01soldstatus $19,900 218-char remark
Show marketing remark (218 chars)
Large Home with 5 bedrooms 1.5 baths, hardwood floors and a lots of woodwork. , Baths: 1 Bath Lev 2, Beds: 2+ Bed 2nd, SqFt Fin - Main: 1497.00, SqFt Fin - 3rd: 0.00, Tax Information: Available, SqFt Fin - 2nd: 1497.00
ⓘ Source: listings_history table (triggers on properties + properties_extension) + one-shot
backfill from property_details.listing_events for pre-trigger history.
Tax reassessment forecast PA · Partial reset (capped growth)
- Current annual tax
- $2,674 · $223/mo
- Projected year-2 tax
- $2,674 · $223/mo
- Expected delta
- $0/yr ($0/mo · 0.0%)
ⓘ Screening estimate from a state-policy table — verify with the county assessor before closing.
Climate risk First Street
- Flood 1/10 Low FEMA zone X (unshaded) · 0% chance over 30 yrs
- Wildfire 1/10 Low
- Heat 2/10 Low 8 d/yr ≥88°F today · 18 d/yr by 30 yrs out
- Wind 2/10 Low 2% chance of damaging wind over 30 yrs
- Air quality 2/10 Low 1 unhealthy d/yr today · 1 by 30 yrs out
Nearby sold comps map
Loading sold comps map…
Walkable amenities ~0.75 mi
Loading nearby amenities…
Taxation est. · year 1
- Rental income
- $19,907
- − Mortgage interest
- −$5,041
- − Property taxes
- −$2,674
- − Insurance
- −$450
- − Repairs & maintenance
- −$1,593
- − Management
- −$1,593
- − Depreciation
- −$2,618
- Taxable income
- $5,939
- Est. tax owed @ 24.0%
- −$1,425
- After-tax cash flow
- $5,514/yr
For passive investors: Depreciation is non-cash, so a rental often shows a tax loss while cash-flowing — sheltering income. Rental losses are passive: they offset passive income freely, and up to $25,000/yr can offset ordinary (W-2) income if you actively participate and your MAGI is under $100k (phasing out to $0 by $150k); unused losses carry forward. On sale, claimed depreciation is recaptured at up to 25%, and gains may owe capital-gains tax (a 1031 exchange can defer both). Figures are a year-1 estimate at your 24.0% rate — not tax advice; consult a CPA.
Schools (NCES district)
- District
- Forest City Regional SD
- NCES district ID
- 4209930
- Math proficiency
- 34% ▼ -17.00%
- Reading proficiency
- 51% ▼ -11.00%
- Median HH income
- $47,744
- Composite
- 36.29/100
- National rank
- #4701
- State rank
- #308 of 539 in PA
Livability — Forest City
- Score
- 66/100
- State rank
- #1019
- US rank
- #11278
Category grades
Schools grade is shown separately in the Schools card above.
Census & demographics
- Census place
- Forest City, PA
- Population (ZIP)
- 4,475
Population outlook (Susquehanna County) Hauer SSP2
- Today (2025)
- 37,552 people
- By 2030
- 35,270 · -6.1%
- By 2040
- 30,663 · -18.3%
- By 2050
- 26,492 · -29.5%
- By 2075
- 19,658 · -47.7%
- By 2100
- 15,179 · -59.6%
Race, ethnicity, and origin ACS 2023
- Neighborhood character
- Predominantly White (93%)
- Race & ethnicity
- White 93% Hispanic / Latino 4% Two or more races 3%
- Common ancestry
- Romanian 11% Italian 3% Scotch-Irish 2%
- Foreign-born
- 3% · Canada, Vietnam
- Languages at home
- 97% English-only · Spanish 1% Vietnamese 1% Russian/Polish/Slavic 1%
Political lean MEDSL · Susquehanna
- 2024 margin
- Solid R (+44.7) · D 27.2% · R 71.9%
- 2008→2024 swing
- -33.0pp toward R · 2008: -11.7pp · 2024: -44.7pp
- All cycles
- 2024: R+44.7 2020: R+41.2 2016: R+42.9 2012: R+21.4 2008: R+11.7
Not yet ingested
- Civics
- —
Market trends
- HPI YoY
- ▲ 48.80%
- Current HPI
- 282.5624
- Rent YoY
- —
- Metro
- —
- State GDP YoY
- ▲ 1.68%
- F500 in state
- 34
Industry mix (Fortune 500 HQ in PA)
| Industry | F500 HQs | Revenue |
|---|---|---|
| Healthcare | 2 | $309B |
|
||
| Insurance | 2 | $27B |
|
||
| Telecommunications / Media | 1 | $124B |
|
||
| Industrial Distribution | 1 | $22B |
|
||
| Financial Services | 1 | $20B |
|
||
| Chemicals / Materials | 1 | $18B |
|
||
Price history
+352.3% since first listed5 events — show timeline
- 2026-04-13 Relisted — GSBR as distributed by MLS GRID
- 2026-04-13 Pending — GSBR as distributed by MLS GRID
- 2026-01-13 Price Changed $90,000 GSBR as distributed by MLS GRID
- 2025-10-22 Listed $95,000 GSBR as distributed by MLS GRID
- 2011-06-01 Sold (MLS) $19,900 GSBR as distributed by MLS GRID
Property tax history
+1.3%/yrLatest (2026): $2,674 · +4.0% YoY. Source: county tax records.
Cash-flow waterfall
monthlySold comps — $/sqft
last 12 mo · ≤1 miLoading sold comps…