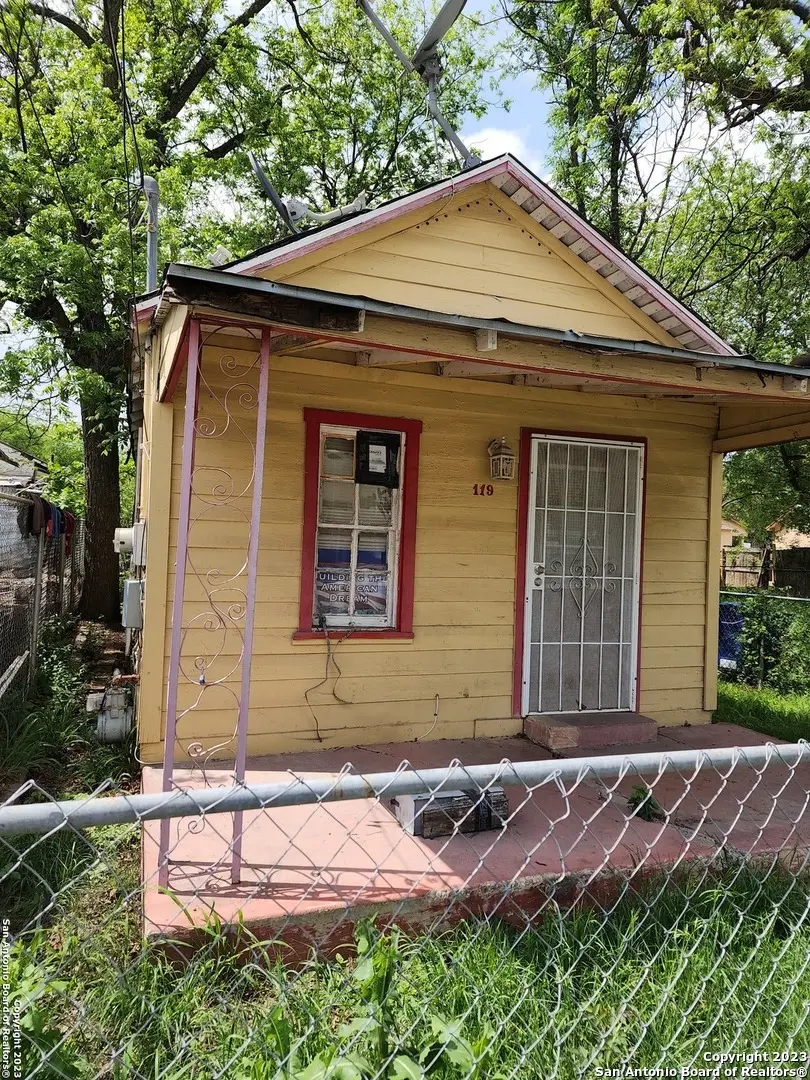
119 Jesus Aly · San Antonio, TX
Flood risk 4/10 · Minor
- FEMA flood zone
- AE
- Chance of flooding over 30 yrs
- 0.22%
- Est. flood insurance / yr
- $1,737 – $8,500
Fire risk 1/10 · Minimal
- Est. fire insurance / yr
- $1,222 – $2,270
Heat risk 8/10 · Major
- Hot days now (above 108°F)
- 7 days/yr
- Hot days in 30 yrs
- 22 days/yr
Wind risk 6/10 · Moderate
- Chance of severe wind over 30 yrs
- 77.0%
Air-quality risk 2/10 · Minimal
- Unhealthy air days now
- 1 days/yr
- Unhealthy air days in 30 yrs
- 2 days/yr
Risk factors via First Street. Map © Google.
Why this score? — see what drove the A grade
The composite is a weighted blend of 9 inputs, each scored 0–100. Each bar is that input's sub-score; the figure is the points it added to the 100-point composite (weight × sub-score).
- Cash flow +30.0/30.0
- ARV discount +15.0/15.0
- 1% rule +10.0/10.0
- DSCR +10.0/10.0
- Appreciation +10.0/10.0
- Rent growth +4.4/5.0
- Livability +4.0/5.0
- Condition / age +2.5/5.0
- Schools +1.4/10.0
$48,000
🖨 Deal sheet 📄 Offer letter ✓ Due diligence
Listing remarks
Take a walk through history, this cute 1920 property will make a great starter home or investment property. Conveniently located, minutes away from downtown San Antonio, highways and eateries. Some TLC and remodeling ideas will bring this 1920 blast from the past back to life. Schedule your private showing today!
Key facts
- 1,785 sq ft lot
- Built 1920
- Listed 1130 days
Property features AI
Finance
- Financial info: Down payment assistance resource available
Exterior
- Utilities: City water; SAWS sewer; CPS electric; CPS gas; CPS garbage service
- Home design: Pre-owned wood exterior; Composition roof; Approximately 106 years old; Located in W Martin S to W Commerce subdivision
- Construction: Wood exterior; Composition roof
- Exterior features: Chain link fence; Mature trees; Paved streets; Streetlights; Alley access; City street frontage
Interior
- Kitchen: Kitchen approximately 9 x 12
- Bedrooms: Master bedroom approximately 9 x 12
- Flooring: Carpeting; Linoleum flooring
- Bathrooms: 1 full bathroom
- Heating & cooling: Electric heating
- Interior features: Eat-in kitchen; Cable TV available; High-speed internet; All bedrooms on main level; City garbage service; Some window coverings remain; 1 living area
Neighborhood map
What this means for you Summary
Snapshot
- This is a 1-bed/1.0-bath single-family listed at $48k.
Deal economics
- At list price, monthly cash flow is $-95 ($-1k/yr) — negative.
- To cash-flow at today's rent, offer at most $31k (34.9% below list).
- Meets the 1% rule at list price ($865 rent vs $48k).
- Recommended offer: $31k (34.9% below list) — sets the bar for cash-flow.
- Cap rate 14.6% vs local median 3.8% in San Antonio — top-decile yield for the area; either an underpriced asset or a hidden risk that comps aren't pricing in. Stress-test before assuming the spread holds.
Location & tenants
- Location reads 80/100 on livability (#31 in TX, #1,616 nationally) — a professional / high-income tenant draw. Strengths: amenities A+, commute A+, cost of living A+; Watch: schools C-, crime F.
- San Antonio ISD (urban): math 12% / reading 22% proficiency, ranked #805 of 826 in TX (top 98%) — low school quality limits family demand, transient renter base, plan for 1-2y turnover; 80% free/reduced lunch — lower-income household profile, screen leases tightly.
- Market conditions: Rents rising fast (+7.7%/yr); 154 active listings in the ZIP; 40 comparable units currently listed for rent nearby; rentals at typical pace (median 18d on market — plan ~3-4 weeks tenant-placement turnaround); lower-income renter base — watch delinquency; 8,308 units permitted in Bexar County in 2024 (2,506 in 5+ unit buildings).
- This rent runs 32% of the median local income ($32k/yr) — at the standard rent-burdened threshold; future hikes will face affordability resistance.
Forward outlook
- In year one you build about $5k of equity ($332 loan paydown + $5k appreciation (10.0% local appreciation)).
- Bexar County population projected at +50% by 2050 — long-run rental-demand tailwind backs the buy-and-hold thesis.
- By year 6, paydown + projected appreciation supports a ~$30k cash-out refi (75% LTV) — recoverable capital for the next deal without selling this one.
Negotiation context
- It's been on market 1130 days — a 12% lower offer ($42k) is reasonable based on typical stale-listing flexibility.
- 3 sale attempts since 3y ago; this cycle's ask has dropped $37k (44%) from the opening price — seller is motivated, your offer sets the floor, not the list.
Risks & watch-outs
- Watch-outs: flood insurance adds $427/mo; built in 1920 — expect roof / HVAC / electrical / plumbing capex.
- Climate carrying-cost: in FEMA flood zone AE (mandatory federal flood insurance); major wind risk, 77% chance of damaging wind over 30y; extreme-heat days projected 7→22/yr by 2055 (HVAC capex compounding) — expect insurance premiums to compound above CPI over the hold.
Questions for the listing agent
- What do current leases actually rent for vs. the listed asking? Can we see a recent rent roll and the last 12 months of T-12 income?
- It's been on market 1130 days. Have you received any prior offers? Is the seller open to a 35% concession, seller financing, or rate buy-down credit?
- Built in 1920 — when were the roof, HVAC, electrical panel, plumbing, and water heater last replaced?
- What's the actual annual flood-insurance premium (NFIP or private), and is the property in a SFHA with mandatory coverage?
- Why hasn't it sold? Are there any deal-killer items the seller is aware of (foundation, flood, title, zoning, code violations)?
- Is there a deadline driving the sale (1031 exchange, divorce, estate, relocation)? That informs how much negotiation room exists.
- Crime grade is F in this area — have there been break-ins, vandalism, or insurance claims at this property in the last 3 years? What carrier currently insures it and at what premium?
- What's the average days-on-market for RENTAL listings here right now (not sales)? A rising rental-DOM trend means longer vacancies and softer asking-rent achievability than the comps imply.
- What's the recent tenant-quality profile in this submarket — average credit score on applications, eviction rate, late-payment / NSF rate, and stable-employment percentage? A property-management company in the area should have these aggregated.
- How much new for-sale + rental construction is in the pipeline within 1–3 miles? Heavy new supply typically softens prices + rents 12–24 months out; constrained supply supports both.
Investment metrics
- 1% rule
- 1.80% ✓
- Cap rate
- 14.59%
- Cash-on-cash
- 29.63%
- DSCR
- 2.32
- GRM
- 4.6
CMA / ARV
- ARV (median comp)
- $95,327
- List price
- $48,000
- Delta
- -49.65%
- Verdict
- UNDERPRICED
- Comps
- 20 within 1.0 mi
Show comp detail 5 sales within ~0.75 mi
| Address | Dist | Beds/Ba | Sqft | Sold | Price | $/sf | Match |
|---|---|---|---|---|---|---|---|
| 115 English Way | 0.35mi | 2/1.0 (+1) | 566 (+2%) | 1mo | $65,000 | $115 | 74 |
| 111 English Way | 0.36mi | 1/1.0 | 576 (+4%) | 11mo | $65,000 | $113 | 66 |
| 506 N Chupaderas St | 0.45mi | 1/1.0 | 504 (-9%) | 15mo | $95,000 | $188 | 52 |
| 227 Rounds St | 0.60mi | 1/1.0 | 576 (+4%) | 21mo | $65,000 | $113 | 47 |
| 730 S Sabinas | 0.71mi | 1/1.0 | 480 (-13%) | 8mo | $79,111 | $165 | 38 |
Match score weights: distance 35% · size 25% · config 20% · recency 20%. Top-matched comps best support the ARV.
Projected returns pro-forma
10.0% appreciation · 7.73% rent growth · sell at horizon
- IRR
- 22.0%
- Equity multiple
- 2.84×
- Total profit
- $24,710
- Equity at exit
- $43,242
- IRR
- 22.6%
- Equity multiple
- 7.60×
- Total profit
- $88,658
- Equity at exit
- $93,253
Cash invested: $13,440 (down + closing). Projections, not guarantees.
Landlord ↔ Tenant lean methodology
- Overall (STATE)
- 87 Strongly Landlord-Friendly
- State Texas
- 87 Strongly Landlord-Friendly · R+5
- County
- — inherits STATE
- City
- — inherits STATE
ZIP-level market 78207
- Home prices YoY
- 15.2%
- Rents YoY
- 7.7%
- Active inventory
- 154
- Price-to-rent
- 4.6×
Monthly cashflow live
- Estimated rent
- $865 high interval (Pro) →
- Mortgage (P&I)
- −$252
- Tax from tax record
- −$80 /mo · $959/yr
- Insurance
- −$20
- Flood insurance flood zone
- −$427 /mo · $5,118/yr
- HOA
- −$0
- Vacancy / Maint / Mgmt
- −$182
- Net cashflow
- $-95
Break-even live
UW: 25.0% down · 7.5% · 30yr · 1.5% tax · 5.0% vac · 8.0% maint · 8.0% mgmt
Financing live
Cash to close
- Down payment
- $12,000
- Closing costs
- $1,440
- Reserves months
- —
- Total cash needed
- —
Loan-product check · same deal, 3 products live
Conventional
25% down · 7.5% · 30yr
- Down + closing
- —
- Monthly P&I
- —
- Monthly cashflow
- —
- DSCR
- —
- Eligible?
- —
Personal DTI + credit; lowest rate.
DSCR
20% down · 8.5% · 30yr
- Down + closing
- —
- Monthly P&I
- —
- Monthly cashflow
- —
- DSCR
- —
- Eligible?
- —
No personal income docs; deal must DSCR.
Hard money
10% down · 12.0% · 12mo
- Down + closing
- —
- Monthly P&I
- —
- Monthly cashflow
- —
- DSCR
- —
- Eligible?
- —
Short-term bridge; refi at stabilization.
Rent comps 40 comps
| Address | Beds | Baths | Sqft | Rent | $/sqft | DOM | Units | Dist |
|---|---|---|---|---|---|---|---|---|
| 107 Jesus Aly Unit 1 San Antonio, TX | 1.0 | 1.0 | 450 | $700 | $1.56 | 17d | 1 | 0.05mi |
| 107 Jesus Aly Unit 4 San Antonio, TX | 2.0 | 1.0 | 400 | $800 | $2.00 | 4d | 1 | 0.05mi |
| 107 Beso Ln Unit 107-BL San Antonio, TX | 1.0 | 1.0 | 528 | $850 | $1.61 | 24d | 1 | 0.13mi |
| 321 N Chupaderas St Unit 101 San Antonio, TX | 1.0 | 1.0 | 410 | $790 | $1.93 | 43d | 1 | 0.44mi |
| 703 N San Marcos San Antonio, TX | 1.0 | 1.0 | 700 | $716 | $1.02 | 43d | 1 | 0.49mi |
| 816 Rivas St Unit C San Antonio, TX | 2.0 | 1.0 | 500 | $750 | $1.50 | 43d | 1 | 0.64mi |
| 816 Rivas St San Antonio, TX | 1.0 | 1.0 | 500 | $750 | $1.50 | 4d | 1 | 0.64mi |
| 816 Rivas St San Antonio, TX | 1.0 | 1.0 | 500 | $750 | $1.50 | 16d | 1 | 0.64mi |
| 816 Rivas St Unit A San Antonio, TX | 2.0 | 1.0 | 650 | $799 | $1.23 | 24d | 1 | 0.65mi |
| 910 N Frio St San Antonio, TX | 1.0 | 1.0 | 700 | $1,043 | $1.49 | 43d | 1 | 0.72mi |
| 1606 El Paso St San Antonio, TX | — | 1.0 | 445 | $788 | $1.77 | 1d | 1 | 0.73mi |
| 2614 Monterey St Unit 5 San Antonio, TX | — | 1.0 | 500 | $575 | $1.15 | 24d | 1 | 0.76mi |
| 1102 El Paso St San Antonio, TX | 1.0–3.0 | 1.0–2.0 | 888 | $795 | $0.90 | 3d | 1 | 0.78mi |
| 1100 N Frio St Apt 403 San Antonio, TX | 1.0 | 1.0 | 500 | $1,100 | $2.20 | 43d | 1 | 0.79mi |
| 1033 Rivas St #301 San Antonio, TX | 2.0 | 1.0 | 640 | $895 | $1.40 | 10d | 1 | 0.87mi |
| 1033 Rivas St #301 San Antonio, TX | 2.0 | 1.0 | 640 | $925 | $1.45 | 43d | 1 | 0.87mi |
| 213 Cadwallader St Unit 2 San Antonio, TX | 1.0 | 1.0 | 400 | $650 | $1.62 | 43d | 1 | 0.90mi |
| 823 W Euclid Ave Unit 1 San Antonio, TX | 1.0 | 1.0 | 450 | $900 | $2.00 | 43d | 1 | 0.98mi |
| 1820 Ruiz St San Antonio, TX | 1.0 | 1.0 | 504 | $750 | $1.49 | 2d | 1 | 1.04mi |
| 601 N Santa Rosa San Antonio, TX | 2.0 | 1.0 | 615 | $945 | $1.54 | 1d | 14 | 1.08mi |
| 1011 S Frio St San Antonio, TX | 3.0 | 1.0–3.0 | 1121 | $1,445 | $1.29 | 1d | 32 | 1.11mi |
| 116 Cornell Ave San Antonio, TX | 1.0 | 1.0 | 576 | $899 | $1.56 | 43d | 1 | 1.11mi |
| 939 S Frio St Unit 294 San Antonio, TX | 1.0 | 1.0 | 664 | $1,009 | $1.52 | 11d | 1 | 1.12mi |
| 939 S Frio St Unit 1294 San Antonio, TX | 1.0 | 1.0 | 630 | $977 | $1.55 | 3d | 1 | 1.12mi |
| 100 N Santa Rosa San Antonio, TX | 3.0 | 1.0–3.0 | 1299 | $2,010 | $1.55 | 1d | 39 | 1.14mi |
| 1805 N Flores St Unit 2 San Antonio, TX | 1.0 | 1.0 | 750 | $900 | $1.20 | 43d | 1 | 1.19mi |
| 110 S Laredo St San Antonio, TX | 2.0 | 1.0–2.0 | 888 | $3,035 | $3.42 | 1d | 85 | 1.19mi |
| 216 University Ave Unit 102 San Antonio, TX | 2.0 | 2.0 | 692 | $1,295 | $1.87 | 12d | 1 | 1.21mi |
| 218 Tampico St San Antonio, TX | 2.0 | 1.0–2.0 | 808 | $1,204 | $1.49 | 2d | 28 | 1.29mi |
| 2721 Colima St San Antonio, TX | 2.0 | 1.0 | 700 | $1,250 | $1.79 | 14d | 1 | 1.29mi |
| 233 Howard St San Antonio, TX | 1.0–2.0 | 1.0 | 769 | $825 | $1.07 | 1d | 15 | 1.34mi |
| 319 S Flores St San Antonio, TX | 1.0 | 1.0 | 690 | $1,160 | $1.68 | 43d | 1 | 1.34mi |
| 319 S Flores St Unit 104 San Antonio, TX | 1.0 | 1.0 | 577 | $990 | $1.72 | 17d | 1 | 1.35mi |
| 300 N Main Ave San Antonio, TX | 3.0 | 1.0–2.5 | 1153 | $4,552 | $3.95 | 1d | 101 | 1.35mi |
| 425 Maverick St #8 San Antonio, TX | 1.0 | 1.0 | 600 | $850 | $1.42 | 24d | 1 | 1.38mi |
| 461 S Main Ave San Antonio, TX | 1.0 | 1.0 | 690 | $1,201 | $1.74 | 43d | 1 | 1.42mi |
| 3017 Colima St San Antonio, TX | 1.0 | 1.0 | 480 | $800 | $1.67 | 43d | 1 | 1.45mi |
| 1020 W French Pl San Antonio, TX | 1.0 | 1.0 | 660 | $1,050 | $1.59 | 24d | 1 | 1.47mi |
| 1026 W French Pl #3 San Antonio, TX | 1.0 | 1.0 | 700 | $825 | $1.18 | 20d | 1 | 1.47mi |
| 405 N Saint Marys St San Antonio, TX | 1.0–2.0 | 1.0–2.0 | 592 | $1,199 | $2.02 | 1d | 24 | 1.48mi |
Listing history 21 events
-
2026-06-18days on market $48,000 Active 1130 DOM
-
2026-06-17days on market $48,000 Active 1129 DOM
-
2026-06-16days on market $48,000 Active 1128 DOM
-
2026-06-15days on market $48,000 Active 1127 DOM
-
2026-06-13days on market $48,000 Active 1125 DOM
-
2026-06-09days on market $48,000 Active 1121 DOM
-
2026-06-08days on market $48,000 Active 1120 DOM
-
2026-06-07days on market $48,000 Active 1119 DOM
-
2026-06-04days on market $48,000 Active 1116 DOM
-
2026-06-03days on market $48,000 Active 1115 DOM
-
2026-06-02days on market $48,000 Active 1114 DOM
-
2026-06-01days on market $48,000 Active 1113 DOM
-
2026-05-31days on market $48,000 Active 1112 DOM
-
2025-08-30price $50,000
-
2025-01-06status Back on Market
-
2024-12-31historical
-
2024-07-12price $75,000
-
2024-01-27price $80,000
-
2024-01-26status Back on Market
-
2023-12-31historical
-
2023-04-13$85,000 New
ⓘ Source: listings_history table (triggers on properties + properties_extension) + one-shot
backfill from property_details.listing_events for pre-trigger history.
Tax reassessment forecast TX · Resets to sale price
- Current annual tax
- $959 · $80/mo
- Projected year-2 tax
- $959 · $80/mo
- Expected delta
- $0/yr ($0/mo · 0.0%)
ⓘ Screening estimate from a state-policy table — verify with the county assessor before closing.
Climate risk First Street
- Flood 4/10 Moderate FEMA zone AE · 22% chance over 30 yrs
- Wildfire 1/10 Low
- Heat 8/10 Severe 7 d/yr ≥108°F today · 22 d/yr by 30 yrs out
- Wind 6/10 Major 77% chance of damaging wind over 30 yrs
- Air quality 2/10 Low 1 unhealthy d/yr today · 2 by 30 yrs out
Nearby sold comps map
Loading sold comps map…
Walkable amenities ~0.75 mi
Loading nearby amenities…
Taxation est. · year 1
- Rental income
- $10,382
- − Mortgage interest
- −$2,689
- − Property taxes
- −$959
- − Insurance
- −$5,358
- − Repairs & maintenance
- −$831
- − Management
- −$831
- − Depreciation
- −$1,396
- Taxable loss
- −$1,682
- Est. tax savings @ 24.0%
- +$404
- After-tax cash flow
- $-733/yr
For passive investors: Depreciation is non-cash, so a rental often shows a tax loss while cash-flowing — sheltering income. Rental losses are passive: they offset passive income freely, and up to $25,000/yr can offset ordinary (W-2) income if you actively participate and your MAGI is under $100k (phasing out to $0 by $150k); unused losses carry forward. On sale, claimed depreciation is recaptured at up to 25%, and gains may owe capital-gains tax (a 1031 exchange can defer both). Figures are a year-1 estimate at your 24.0% rate — not tax advice; consult a CPA.
Schools (NCES district)
- District
- San Antonio ISD
- NCES district ID
- 4838730
- Math proficiency
- 12% ▼ -21.00%
- Reading proficiency
- 22% ▼ -7.00%
- Median HH income
- $30,952
- Composite
- 13.57/100
- National rank
- #9512
- State rank
- #805 of 826 in TX
Livability — San Antonio
- Score
- 80/100
- State rank
- #31
- US rank
- #1616
Category grades
Schools grade is shown separately in the Schools card above.
Census & demographics
- Census place
- San Antonio, TX
- County
- Bexar County · 1,990,555 people
- City population
- 1,806,925
- Metro
- San Antonio-New Braunfels, TX
- Population (ZIP)
- 55,474
- Household income
- $32,472
- Rent vs Own
- Severe rent burden
- 2789.0
Population outlook (Bexar County) Hauer SSP2
- Today (2025)
- 2,336,851 people
- By 2030
- 2,560,728 · +9.6%
- By 2040
- 3,020,569 · +29.3%
- By 2050
- 3,493,522 · +49.5%
- By 2075
- 4,668,459 · +99.8%
- By 2100
- 5,533,242 · +136.8%
Race, ethnicity, and origin ACS 2023
- Neighborhood character
- Predominantly Hispanic (88%)
- Race & ethnicity
- Hispanic / Latino 88% Two or more races 41% White 6% Black 5% Native American 2%
- Hispanic origin (detail)
- Mexican 79%
- Foreign-born
- 19% · Canada
- Languages at home
- 39% English-only · Spanish 60%
Political lean MEDSL · Bexar
- 2024 margin
- Lean D (+9.8) · D 54.3% · R 44.6% · Other 1.1%
- 2008→2024 swing
- +4.2pp toward D · 2008: 5.6pp · 2024: 9.8pp
- All cycles
- 2024: D+9.8 2020: D+18.2 2016: D+13.5 2012: D+4.6 2008: D+5.6
Not yet ingested
- Civics
- —
Market trends
- HPI YoY
- ▲ 34.92%
- Current HPI
- 264.7559
- Rent YoY
- ▲ 7.73%
- Metro
- San Antonio-New Braunfels, TX
- State GDP YoY
- ▲ 3.95%
- F500 in state
- 110
Industry mix (Fortune 500 HQ in TX)
| Industry | F500 HQs | Revenue |
|---|---|---|
| Energy | 16 | $1,198B |
|
||
| Technology | 5 | $198B |
|
||
| Engineering / Construction | 4 | $72B |
|
||
| Energy Services | 3 | $60B |
|
||
| Utilities | 3 | $41B |
|
||
| Healthcare | 2 | $330B |
|
||
Price history
-43.5% since first listed9 events — show timeline
- 2026-05-16 Price Changed $48,000 LERA
- 2025-08-30 Price Changed $50,000 LERA
- 2025-01-06 Relisted — LERA
- 2024-12-31 Listing Removed — LERA
- 2024-07-12 Price Changed $75,000 LERA
- 2024-01-27 Price Changed $80,000 LERA
- 2024-01-26 Relisted — LERA
- 2023-12-31 Listing Removed — LERA
- 2023-04-13 Listed $85,000 LERA
Property tax history
+4.7%/yrLatest (2025): $959 · -3.8% YoY. Source: county tax records.
Cash-flow waterfall
monthlySold comps — $/sqft
last 12 mo · ≤1 miLoading sold comps…