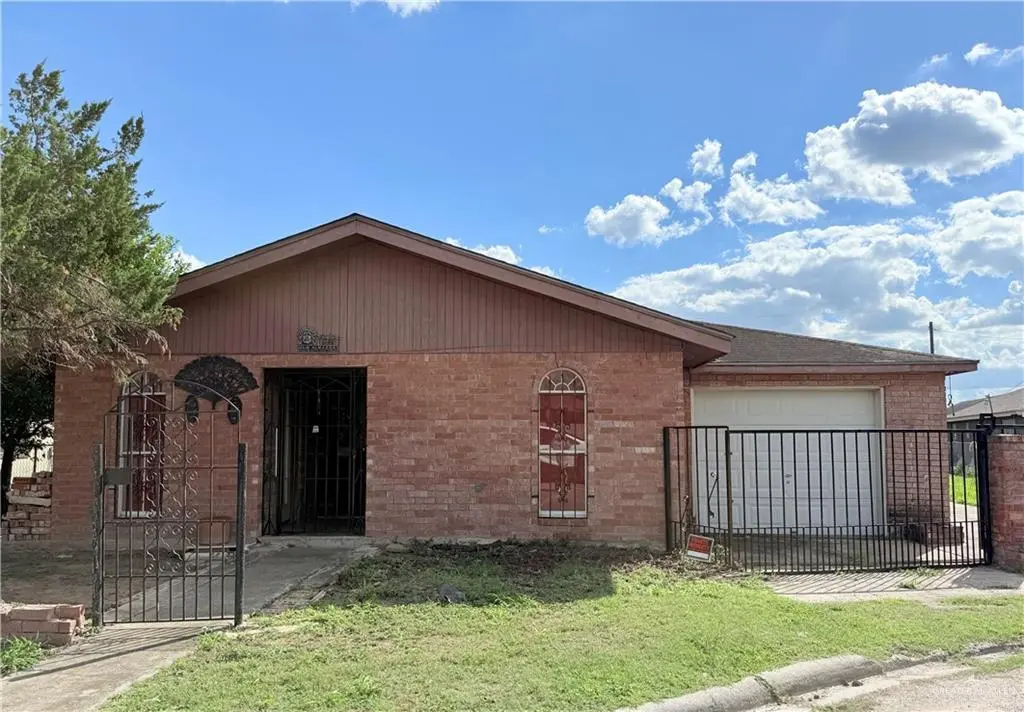
814 Starshine Dr · Edinburg, TX
Flood risk 1/10 · Minimal
- FEMA flood zone
- X (shaded)
- Chance of flooding over 30 yrs
- 0.0%
- Est. flood insurance / yr
- $507 – $1,088
Fire risk 4/10 · Minor
- Est. fire insurance / yr
- $1,222 – $2,270
Heat risk 9/10 · Severe
- Hot days now (above 111°F)
- 7 days/yr
- Hot days in 30 yrs
- 21 days/yr
Wind risk 8/10 · Major
- Chance of severe wind over 30 yrs
- 99.0%
Air-quality risk 3/10 · Minor
- Unhealthy air days now
- 1 days/yr
- Unhealthy air days in 30 yrs
- 4 days/yr
Risk factors via First Street. Map © Google.
Why this score? — see what drove the C grade
The composite is a weighted blend of 9 inputs, each scored 0–100. Each bar is that input's sub-score; the figure is the points it added to the 100-point composite (weight × sub-score).
- Cash flow +19.3/30.0
- ARV discount +15.0/15.0
- DSCR +6.1/10.0
- 1% rule +5.7/10.0
- Livability +3.2/5.0
- Condition / age +2.5/5.0
- Rent growth +2.2/5.0
- Schools +2.2/10.0
- Appreciation +0.0/10.0
$120,000
🖨 Deal sheet (PDF) 📄 Offer letter ✓ Due diligence
Listing remarks
This spacious 4-bedroom, 2-bathroom home with 2 bonus rooms sits on a large lot, offering plenty of room to expand, create your dream outdoor space, or enjoy extra privacy. With a little TLC and your personal touch, this property can easily be transformed into the perfect family home or investment opportunity. The flexible floor plan provides ample space for a home office or play room. If you’re looking for a property with great bones, a generous lot, and unlimited potential, this is the one for you. Don’t miss this chance to make it your own and add value in a great location
Key facts
- 0.25 acre lot
- Garage
- Built 1985
Property features AI
Finance
- HOA & community: No homeowners association
Exterior
- Parking: 3 total parking spaces; 1-car attached garage; 2-car carport (covered); Covered parking
- Utilities: City sewer
- Home design: Seller-measured living area
- Construction: Brick construction; Slab foundation; Shingle roof; Built on a 0.2537-acre lot
- Exterior features: Mature trees; Decorative metal, masonry, and privacy fencing; Patio slab; Paved road access; Cul-de-sac lot; Irregular lot shape
Interior
- Kitchen: Refrigerator; Stove/Range; Electric water heater
- Flooring: Tile
- Bathrooms: 2 full bathrooms
- Heating & cooling: Central heating; Central air conditioning; Thermostat
- Interior features: Granite countertops; Ceiling fans; No window coverings
- Laundry & utility: Laundry area with washer/dryer connection
Neighborhood map
What this means for you Summary
Snapshot
- This is a 3-bed/1.0-bath single-family listed at $120k.
Deal economics
- At list price, monthly cash flow is $132 ($2k/yr) — positive.
- The deal already cash-flows at list — no discount required.
- Meets the 1% rule at list price ($1k rent vs $120k).
- Cap rate 7.6% vs local median 2.4% in Edinburg — top-decile yield for the area; either an underpriced asset or a hidden risk that comps aren't pricing in. Stress-test before assuming the spread holds.
Location & tenants
- Location reads 64/100 on livability (#784 in TX) — a middle-class / working-renter tenant base. Strengths: cost of living A+, housing A+; Watch: employment D, amenities F, commute F.
- Edinburg CISD (urban): math 20% / reading 34% proficiency, ranked #699 of 826 in TX (top 85%) — low school quality limits family demand, transient renter base, plan for 1-2y turnover; 62% free/reduced lunch — lower-income household profile, screen leases tightly.
- Zoned schools: Alfonso Ramirez El (math 37% / reading 42%, grade F, #1,545 of 4,322 statewide, top 38%, 681 students, 61% FRL); South Middle (math 23% / reading 46%, grade F, #858 of 1,662 statewide, top 54%, 1,309 students, 66% FRL); Robert R Vela H S (math 27% / reading 48%, grade F, #888 of 1,632 statewide, top 55%, 2,189 students, 62% FRL) — zoned schools at 63% FRL track the district average.
- Market conditions: Rents soft (-1.1%/yr); 1011 active listings in the ZIP; 27 comparable units currently listed for rent nearby; rentals lingering (median 45d on market — plan ~5-8 weeks vacancy on turnover, expect pricing pressure); 59% of comp listings sitting > 30 days — soft ceiling on asking rent; 7,378 units permitted in Hidalgo County in 2024 (641 in 5+ unit buildings).
Forward outlook
- Local home prices are declining (-3.0%/yr); year-one equity from $830 of loan paydown is wiped out by about $4k of value loss. Plan a longer hold.
- Hidalgo County population projected at +28% by 2050 — long-run rental-demand tailwind backs the buy-and-hold thesis.
Negotiation context
- Only 13 days on market — expect competitive offers; lowballing is unlikely to land.
- 2 sale attempts with the ask held roughly flat each time — persistent listings suggest the price (not the market) is what's stuck; bring a comps-based counter.
Risks & watch-outs
- Climate carrying-cost: severe wind risk, 99% chance of damaging wind over 30y; extreme-heat days projected 7→21/yr by 2055 (HVAC capex compounding) — expect insurance premiums to compound above CPI over the hold.
Questions for the listing agent
- Is there a deadline driving the sale (1031 exchange, divorce, estate, relocation)? That informs how much negotiation room exists.
- Schools are D-rated, which usually means shorter tenancies and higher turnover. Who's the typical renter profile here, and what's been the actual vacancy rate?
- What's the average days-on-market for RENTAL listings here right now (not sales)? A rising rental-DOM trend means longer vacancies and softer asking-rent achievability than the comps imply.
- What's the recent tenant-quality profile in this submarket — average credit score on applications, eviction rate, late-payment / NSF rate, and stable-employment percentage? A property-management company in the area should have these aggregated.
- How much new for-sale + rental construction is in the pipeline within 1–3 miles? Heavy new supply typically softens prices + rents 12–24 months out; constrained supply supports both.
Investment metrics
- 1% rule
- 1.07% ✓
- Cap rate
- 7.61%
- Cash-on-cash
- 4.71%
- DSCR
- 1.21
- GRM
- 7.8
CMA / ARV
- ARV (median comp)
- $200,603
- List price
- $120,000
- Delta
- -37.69%
- Verdict
- UNDERPRICED
- Comps
- 20 within 1.0 mi
Show comp detail 2 sales within ~0.75 mi
| Address | Dist | Beds/Ba | Sqft | Sold | Price | $/sf | Match |
|---|---|---|---|---|---|---|---|
| 814 Starshine Dr | 0.00mi | 4/2.0 (+1) | 1,272 (+13%) | 0mo | $120,000 | $94 | 70 |
| 810 Esperanza St | 0.30mi | 3/2.0 | 1,260 (+12%) | 15mo | $125,000 | $99 | 50 |
Match score weights: distance 35% · size 25% · config 20% · recency 20%. Top-matched comps best support the ARV.
Projected returns pro-forma
-3.0% appreciation · 0.0% rent growth · sell at horizon
- IRR
- -12.6%
- Equity multiple
- 0.56×
- Total profit
- $-14,761
- Equity at exit
- $17,892
- IRR
- -9.2%
- Equity multiple
- 0.51×
- Total profit
- $-16,405
- Equity at exit
- $10,375
Cash invested: $33,600 (down + closing). Projections, not guarantees.
Landlord ↔ Tenant lean methodology
- Overall (STATE)
- 87 Strongly Landlord-Friendly
- State Texas
- 87 Strongly Landlord-Friendly · R+5
- County
- — inherits STATE
- City
- — inherits STATE
ZIP-level market 78542
- Home prices YoY
- -13.4%
- Rents YoY
- -1.1%
- Active inventory
- 1011
- Price-to-rent
- 7.8×
Monthly cashflow live
- Estimated rent
- $1,289 high interval (Pro) →
- Mortgage (P&I)
- −$629
- Tax from tax record
- −$207 /mo · $2,483/yr
- Insurance
- −$50
- HOA
- −$0
- Vacancy / Maint / Mgmt
- −$271
- Net cashflow
- $132
Break-even live
Sensitivity live
| Price | -10% $200 | -5% $166 | +0% $132 | +5% $98 | +10% $64 |
|---|---|---|---|---|---|
| Rent | -10% $30 | -5% $81 | +0% $132 | +5% $183 | +10% $234 |
| Rate | -1.0pp $192 | -0.5pp $163 | base $132 | +0.5pp $101 | +1.0pp $69 |
UW: 25.0% down · 7.5% · 30yr · 1.5% tax · 5.0% vac · 8.0% maint · 8.0% mgmt
Financing live
Cash to close
- Down payment
- $30,000
- Closing costs
- $3,600
- Reserves months
- —
- Total cash needed
- —
Loan-product check · same deal, 3 products live
Conventional
25% down · 7.5% · 30yr
- Down + closing
- —
- Monthly P&I
- —
- Monthly cashflow
- —
- DSCR
- —
- Eligible?
- —
Personal DTI + credit; lowest rate.
DSCR
20% down · 8.5% · 30yr
- Down + closing
- —
- Monthly P&I
- —
- Monthly cashflow
- —
- DSCR
- —
- Eligible?
- —
No personal income docs; deal must DSCR.
Hard money
10% down · 12.0% · 12mo
- Down + closing
- —
- Monthly P&I
- —
- Monthly cashflow
- —
- DSCR
- —
- Eligible?
- —
Short-term bridge; refi at stabilization.
Rent comps 27 comps
| Address | Beds | Baths | Sqft | Rent | $/sqft | DOM | Units | Dist |
|---|---|---|---|---|---|---|---|---|
| 4724 N Ebony St Apt 4 Pharr, TX | 3.0 | 2.0 | 1040 | $1,100 | $1.06 | 45d | 1 | 1.03mi |
| 5006 N Crown Pt Unit 2 Pharr, TX | 3.0 | 2.0 | 1100 | $1,350 | $1.23 | 45d | 1 | 1.25mi |
| 5006 N Crown Pt Unit 4 Pharr, TX | 3.0 | 2.0 | 1100 | $1,300 | $1.18 | 45d | 1 | 1.25mi |
| 2606 Garman St Edinburg, TX | 3.0 | 2.0 | 1445 | $1,900 | $1.31 | 20d | 1 | 1.26mi |
| 5202 N Hiawatha Dr Pharr, TX | 3.0 | 2.0 | 1073 | $1,250 | $1.16 | 45d | 1 | 1.27mi |
| 5106 N Hiawatha Dr Unit 2 Pharr, TX | 3.0 | 2.0 | 1050 | $1,250 | $1.19 | 45d | 1 | 1.29mi |
| 5205 N Hiawatha Dr Unit DRIVE5205-04 Pharr, TX | 3.0 | 2.0 | 1050 | $1,100 | $1.05 | 24d | 1 | 1.29mi |
| 5201 N Hiawatha Dr Unit 1 Pharr, TX | 3.0 | 2.0 | 1050 | $1,150 | $1.10 | 45d | 1 | 1.30mi |
| 5102 N Hiawatha Dr Unit 3 Pharr, TX | 3.0 | 2.0 | 1043 | $1,150 | $1.10 | 45d | 1 | 1.31mi |
| 2700 Garman St Edinburg, TX | 3.0 | 2.0 | 1272 | $1,950 | $1.53 | 15d | 1 | 1.31mi |
| 5103 N Hiawatha Dr Apt 3 Pharr, TX | 3.0 | 2.0 | 1043 | $1,145 | $1.10 | 20d | 1 | 1.33mi |
| 4106 Linda Vista St Pharr, TX | 3.0 | 2.0 | 1072 | $1,400 | $1.31 | 45d | 1 | 1.34mi |
| 5004 N Hiawatha Dr Unit 1 Pharr, TX | 3.0 | 2.0 | 1050 | $1,200 | $1.14 | 24d | 1 | 1.34mi |
| 5201 N Winona Dr Unit 3 Pharr, TX | 3.0 | 2.0 | 1050 | $1,250 | $1.19 | 24d | 1 | 1.35mi |
| 4906 N Hiawatha Dr Unit 1 Pharr, TX | 3.0 | 2.0 | 1073 | $1,150 | $1.07 | 45d | 1 | 1.36mi |
| 5202 N Dahlia St Unit 2 Pharr, TX | 3.0 | 2.0 | 1080 | $1,250 | $1.16 | 45d | 1 | 1.37mi |
| 5007 N Winona Dr Unit 3 Pharr, TX | 3.0 | 2.0 | 1050 | $1,250 | $1.19 | 45d | 1 | 1.40mi |
| 4900 N Hiawatha Dr Unit 1 Pharr, TX | 2.0 | 2.0 | 1099 | $1,100 | $1.00 | 24d | 1 | 1.40mi |
| 4903 N Hiawatha Dr Pharr, TX | 3.0 | 2.0 | 1050 | $1,100 | $1.05 | 45d | 1 | 1.41mi |
| 5228 S Sugar Rd Edinburg, TX | 2.0 | 2.0 | 965 | $1,139 | $1.18 | 45d | 1 | 1.43mi |
| 5006 N Dahlia St Unit 1 Pharr, TX | 3.0 | 2.0 | 1100 | $1,300 | $1.18 | 24d | 1 | 1.44mi |
| 5006 N Dahlia St Unit 3 Pharr, TX | 3.0 | 2.0 | 1100 | $1,350 | $1.23 | 24d | 1 | 1.44mi |
| 304 Lauryn Dr Unit 1 San Juan, TX | 2.0 | 2.0 | 948 | $1,195 | $1.26 | 24d | 1 | 1.45mi |
| 5001 N Dahlia St Unit 3 Pharr, TX | 3.0 | 2.0 | 1100 | $1,300 | $1.18 | 45d | 1 | 1.47mi |
| 5001 N Dahlia St Unit 3 Pharr, TX | 3.0 | 2.0 | 1100 | $1,300 | $1.18 | 20d | 1 | 1.47mi |
| 4901 N Winona Dr Unit 3 Pharr, TX | 3.0 | 2.0 | 1050 | $1,200 | $1.14 | 45d | 1 | 1.47mi |
| 304 S Ridge Ln Unit 1 San Juan, TX | 2.0 | 2.0 | 1120 | $975 | $0.87 | 45d | 1 | 1.50mi |
Listing history 16 events
-
2026-06-14statusdays on market $120,000 Pending 13 DOM
-
2026-06-13days on market $120,000 Active 12 DOM
-
2026-06-10days on market $120,000 Active 10 DOM
-
2026-06-09days on market $120,000 Active 9 DOM
-
2026-06-08days on market $120,000 Active 8 DOM
-
2026-06-07days on market $120,000 Active 7 DOM
-
2026-06-03days on market $120,000 Active 3 DOM
-
2026-06-02days on market $120,000 Active 2 DOM
-
2026-06-01pricedays on market $120,000 Active 1 DOM
-
2026-05-31days on market $125,000 Active 229 DOM
-
2026-05-07price $125,000 595-char remark
-
2026-04-11price $130,000 595-char remark
-
2026-02-09price $140,000 595-char remark
-
2025-10-13$145,000 Active 595-char remark
-
2024-03-15soldstatus
-
2006-04-20soldstatus
ⓘ Source: listings_history table (triggers on properties + properties_extension) + one-shot
backfill from property_details.listing_events for pre-trigger history.
Tax reassessment forecast TX · Resets to sale price
- Current annual tax
- $2,483 · $207/mo
- Projected year-2 tax
- $2,483 · $207/mo
- Expected delta
- $0/yr ($0/mo · 0.0%)
ⓘ Screening estimate from a state-policy table — verify with the county assessor before closing.
Climate risk First Street
- Flood 1/10 Low FEMA zone X (shaded) · 0% chance over 30 yrs
- Wildfire 4/10 Moderate
- Heat 9/10 Extreme 7 d/yr ≥111°F today · 21 d/yr by 30 yrs out
- Wind 8/10 Severe 99% chance of damaging wind over 30 yrs
- Air quality 3/10 Moderate 1 unhealthy d/yr today · 4 by 30 yrs out
Nearby sold comps map
Loading sold comps map…
Walkable amenities ~0.75 mi
Loading nearby amenities…
Taxation est. · year 1
- Rental income
- $15,466
- − Mortgage interest
- −$6,722
- − Property taxes
- −$2,483
- − Insurance
- −$600
- − Repairs & maintenance
- −$1,237
- − Management
- −$1,237
- − Depreciation
- −$3,491
- Taxable loss
- −$304
- Est. tax savings @ 24.0%
- +$73
- After-tax cash flow
- $1,657/yr
For passive investors: Depreciation is non-cash, so a rental often shows a tax loss while cash-flowing — sheltering income. Rental losses are passive: they offset passive income freely, and up to $25,000/yr can offset ordinary (W-2) income if you actively participate and your MAGI is under $100k (phasing out to $0 by $150k); unused losses carry forward. On sale, claimed depreciation is recaptured at up to 25%, and gains may owe capital-gains tax (a 1031 exchange can defer both). Figures are a year-1 estimate at your 24.0% rate — not tax advice; consult a CPA.
Schools (NCES district)
- District
- Edinburg CISD
- NCES district ID
- 4818180
- Math proficiency
- 20% ▼ -34.00%
- Reading proficiency
- 34% ▼ -11.00%
- Median HH income
- $36,985
- Composite
- 22.42/100
- National rank
- #8114
- State rank
- #699 of 826 in TX
Livability — Edinburg
- Score
- 64/100
- State rank
- #784
- US rank
- #14319
Category grades
Schools grade is shown separately in the Schools card above.
Census & demographics
- Census place
- Edinburg, TX
- County
- Hidalgo County · 623,128 people
- City population
- 178,279
- Metro
- McAllen-Edinburg-Mission, TX
- Population (ZIP)
- 89,401
- Household income
- $55,243
- Rent vs Own
- Severe rent burden
- 1240.0
Population outlook (Hidalgo County) Hauer SSP2
- Today (2025)
- 955,232 people
- By 2030
- 1,009,774 · +5.7%
- By 2040
- 1,120,332 · +17.3%
- By 2050
- 1,225,036 · +28.2%
- By 2075
- 1,439,189 · +50.7%
- By 2100
- 1,533,429 · +60.5%
Race, ethnicity, and origin ACS 2023
- Neighborhood character
- Predominantly Hispanic (95%)
- Race & ethnicity
- Hispanic / Latino 95% Two or more races 59% White 4%
- Hispanic origin (detail)
- Mexican 91%
- Foreign-born
- 25% · Canada
- Languages at home
- 15% English-only · Spanish 84%
Political lean MEDSL · Hidalgo
- 2024 margin
- Toss-up / Even · D 48.1% · R 51.0%
- 2008→2024 swing
- -41.6pp toward R · 2008: 38.7pp · 2024: -2.9pp
- All cycles
- 2024: R+2.9 2020: D+17.1 2016: D+40.5 2012: D+41.8 2008: D+38.7
Not yet ingested
- Civics
- —
Market trends
- HPI YoY
- ▼ -34.17%
- Current HPI
- 220.921
- Rent YoY
- ▼ -1.07%
- Metro
- McAllen-Edinburg-Mission, TX
- State GDP YoY
- ▲ 3.95%
- F500 in state
- 110
Industry mix (Fortune 500 HQ in TX)
| Industry | F500 HQs | Revenue |
|---|---|---|
| Energy | 16 | $1,198B |
|
||
| Technology | 5 | $198B |
|
||
| Engineering / Construction | 4 | $72B |
|
||
| Energy Services | 3 | $60B |
|
||
| Utilities | 3 | $41B |
|
||
| Healthcare | 2 | $330B |
|
||
Price history
-17.2% since first listed9 events — show timeline
- 2026-06-16 Sold (MLS) — MCALLENMLS
- 2026-06-14 Pending — MCALLENMLS
- 2026-05-31 Listed $120,000 MCALLENMLS
- 2026-05-07 Price Changed $125,000 MCALLENMLS
- 2026-04-11 Price Changed $130,000 MCALLENMLS
- 2026-02-09 Price Changed $140,000 MCALLENMLS
- 2025-10-13 Listed $145,000 MCALLENMLS
- 2024-03-15 Sold (Public Records) — Public Records
- 2006-04-20 Sold (Public Records) — Public Records
Property tax history
+6.8%/yrLatest (2025): $2,483 · +18.4% YoY. Source: county tax records.
Cash-flow waterfall
monthlySold comps — $/sqft
last 12 mo · ≤1 miLoading sold comps…