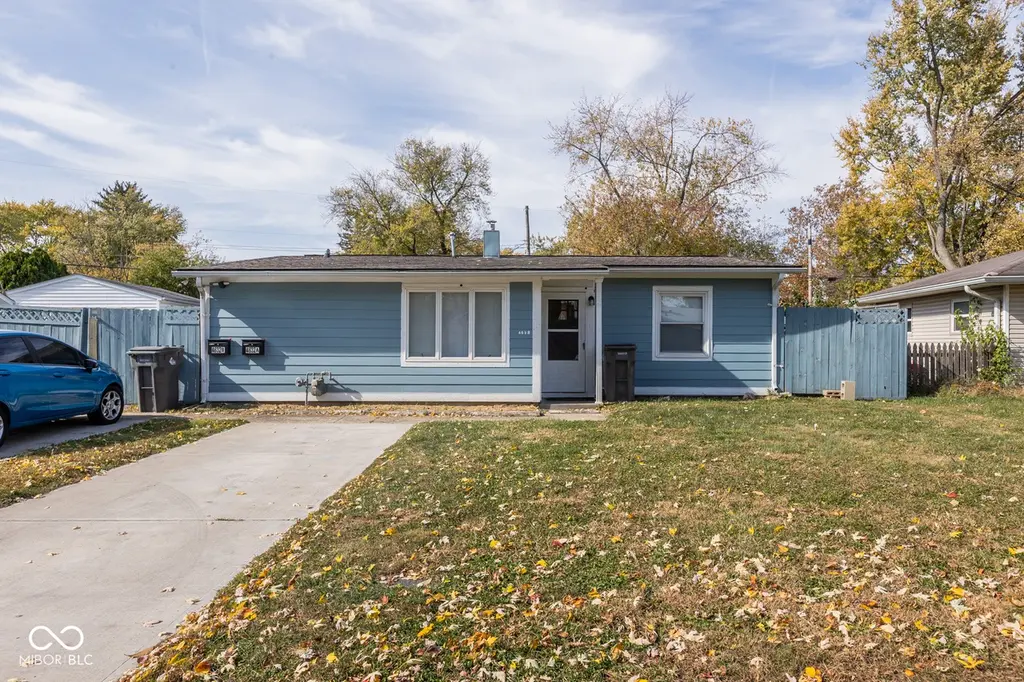
4632 Bertrand Rd · Indianapolis city (balance), IN
Flood risk 1/10 · Minimal
- FEMA flood zone
- X (unshaded)
- Chance of flooding over 30 yrs
- 0.0%
- Est. flood insurance / yr
- $507 – $1,088
Fire risk 1/10 · Minimal
- Est. fire insurance / yr
- $717 – $1,331
Heat risk 3/10 · Minor
- Hot days now (above 101°F)
- 7 days/yr
- Hot days in 30 yrs
- 19 days/yr
Wind risk 2/10 · Minimal
- Chance of severe wind over 30 yrs
- —
Air-quality risk 4/10 · Minor
- Unhealthy air days now
- 5 days/yr
- Unhealthy air days in 30 yrs
- 7 days/yr
Risk factors via First Street. Map © Google.
Why this score? — see what drove the F grade
The composite is a weighted blend of 9 inputs, each scored 0–100. Each bar is that input's sub-score; the figure is the points it added to the 100-point composite (weight × sub-score).
- ARV discount +6.6/15.0
- Cash flow +5.6/30.0
- Rent growth +3.1/5.0
- 1% rule +3.0/10.0
- Livability +2.5/5.0
- Condition / age +2.5/5.0
- Schools +1.4/10.0
- DSCR +0.0/10.0
- Appreciation +0.0/10.0
$169,000
🖨 Deal sheet (PDF) 📄 Offer letter ✓ Due diligence
Listing remarks MLS
Come Check out this Unique 3 Bedroom Ranch with a In-Law Quarters in Eagledale! You get 2 Homes for the Price of One: Front Home has 3 Bedrooms and 1 Full Bath, Spacious Living Room, Open Concept Updated Kitchen with New Appliances, Nice Dining Area. The In Law Quarters has an Open Concept Full Kitchen with a Living Room, Full Bathroom and a Large Bedroom. Private Fenced Back Yard with Drive Way Gate. It Also has a 8x8 Storage Room to the Side of Home....Updates Include: New Water Heater, Newer HVAC 18', Newly Painted Siding, New Plumbing in Bathrooms, Updated Cabinets and Brand New Roof to be Installed this Weekend.
Key facts
- 6,665 sq ft lot
- Built 1955
Property features AI
Finance
- Other: Current use: Apartments (under 20 units)
- Financial info: Gross income reported: $3,275; Expenses reported: $23,979; Two rental units with reported monthly rents of $1,095 and $1,490
Exterior
- Parking: No dedicated parking
- Utilities: No municipal solid waste service listed
- Home design: Duplex (residential income property); Single-story
- Construction: Conversion: No
- Exterior features: Asphalt roof; Access road
Interior
- Kitchen: Kitchen (both units approximately 13 x 12)
- Bedrooms: One 2-bedroom unit; One 3-bedroom unit
- Heating & cooling: Forced air heating (natural gas); Central air conditioning
- Interior features: Central air conditioning; Forced air heating fueled by natural gas
Neighborhood map
What this means for you Summary
Snapshot
- This is a 3-bed/1.0-bath single-family listed at $169k.
Deal economics
- At list price, monthly cash flow is $-355 ($-4k/yr) — negative.
- To cash-flow at today's rent, offer at most $110k (34.7% below list).
- To meet the 1% rule (rent ≥ 1% of price), the offer needs to be $134k (20.5% below list).
- Recommended offer: $110k (34.7% below list) — sets the bar for cash-flow.
Location & tenants
- Location reads: area grade F — affects rentability + tenant quality, not the cash-flow math above.
- Indianapolis Public Schools (urban): math 14% / reading 20% proficiency, ranked #286 of 301 in IN (top 95%) — low school quality limits family demand, transient renter base, plan for 1-2y turnover; 77% free/reduced lunch — lower-income household profile, screen leases tightly.
- Zoned schools: Clarence Farrington School 61 (math 6% / reading 9%, grade F, #949 of 994 statewide, top 97%, 467 students, 81% FRL); H L Harshman Middle School (math 3% / reading 16%, grade F, #316 of 330 statewide, top 96%, 549 students, 84% FRL); George Washington High School (math 2% / reading 17%, grade F, #366 of 369 statewide, top 99%, 753 students, 68% FRL) — zoned schools at 78% FRL track the district average.
- Market conditions: Rents rising (+2.5%/yr); 174 active listings in the ZIP; 18 comparable units currently listed for rent nearby; rentals at typical pace (median 22d on market — plan ~3-4 weeks tenant-placement turnaround); 1,906 units permitted in Marion County in 2024 (621 in 5+ unit buildings).
- This rent runs 32% of the median local income ($51k/yr) — at the standard rent-burdened threshold; future hikes will face affordability resistance.
Forward outlook
- Local home prices are declining (-3.0%/yr); year-one equity from $1k of loan paydown is wiped out by about $5k of value loss. Plan a longer hold.
- Marion County population projected at +18% by 2050 — long-run rental-demand tailwind backs the buy-and-hold thesis.
Negotiation context
- Only 1 days on market — expect competitive offers; lowballing is unlikely to land.
- 3 sale attempts since 6y ago with the ask held roughly flat each time — persistent listings suggest the price (not the market) is what's stuck; bring a comps-based counter.
- Current owner paid $115k; 47% above their basis — modest negotiation headroom, anchor on the comps not their cost.
Risks & watch-outs
- Watch-outs: property tax is 3.3% of price; built in 1955 — expect roof / HVAC / electrical / plumbing capex.
Questions for the listing agent
- What do current leases actually rent for vs. the listed asking? Can we see a recent rent roll and the last 12 months of T-12 income?
- Built in 1955 — when were the roof, HVAC, electrical panel, plumbing, and water heater last replaced?
- Property tax is high relative to price — has the assessment been appealed recently, and will the sale trigger a re-assessment?
- Is there a deadline driving the sale (1031 exchange, divorce, estate, relocation)? That informs how much negotiation room exists.
- The area grade is low — what's the realistic commute time and amenity access for the typical tenant pool here? Any planned neighborhood developments (good or bad) we should know about?
- What's the average days-on-market for RENTAL listings here right now (not sales)? A rising rental-DOM trend means longer vacancies and softer asking-rent achievability than the comps imply.
- What's the recent tenant-quality profile in this submarket — average credit score on applications, eviction rate, late-payment / NSF rate, and stable-employment percentage? A property-management company in the area should have these aggregated.
- How much new for-sale + rental construction is in the pipeline within 1–3 miles? Heavy new supply typically softens prices + rents 12–24 months out; constrained supply supports both.
Investment metrics
- 1% rule
- 0.80% ✗
- Cap rate
- 3.77%
- Cash-on-cash
- -8.99%
- DSCR
- 0.60
- GRM
- 10.5
CMA / ARV
- ARV (on-the-fly)
- $165,620
- Comps found
- 12
Show comp detail 12 sales within ~0.75 mi
| Address | Dist | Beds/Ba | Sqft | Sold | Price | $/sf | Match |
|---|---|---|---|---|---|---|---|
| 3116 Georgetown Rd | 0.13mi | 3/1.0 | 925 (-6%) | 1mo | $205,000 | $222 | 84 |
| 3148 Keswick Rd | 0.05mi | 3/1.0 | 900 (-8%) | 3mo | $132,500 | $147 | 82 |
| 3148 Donald Ave | 0.16mi | 4/1.5 (+1) | 1,000 (+2%) | 2mo | $160,000 | $160 | 81 |
| 4047 Arcadia St | 0.42mi | 3/1.0 | 972 (-1%) | 2mo | $178,900 | $184 | 78 |
| 3035 Auburn Rd | 0.33mi | 3/1.0 | 1,025 (+5%) | 0mo | $167,000 | $163 | 77 |
| 3914 Thrush Dr | 0.57mi | 3/1.0 | 984 (+0%) | 1mo | $121,500 | $123 | 72 |
| 2825 Mussman Dr | 0.44mi | 3/1.5 | 936 (-4%) | 2mo | $202,000 | $216 | 68 |
| 3107 Winton Ave | 0.45mi | 3/1.0 | 925 (-6%) | 2mo | $156,000 | $169 | 68 |
| 4131 Breton St | 0.36mi | 3/1.0 | 888 (-9%) | 2mo | $132,000 | $149 | 66 |
| 3042 Danbury Rd | 0.56mi | 3/2.0 | 1,056 (+8%) | 2mo | $225,000 | $213 | 55 |
| 3234 Chrysler St | 0.28mi | 4/1.5 (+1) | 1,125 (+15%) | 1mo | $207,000 | $184 | 54 |
| 2650 Shirley Dr | 0.68mi | 3/1.0 | 888 (-9%) | 1mo | $134,900 | $152 | 52 |
Match score weights: distance 35% · size 25% · config 20% · recency 20%. Top-matched comps best support the ARV.
Projected returns pro-forma
-3.0% appreciation · 2.46% rent growth · sell at horizon
- IRR
- -32.9%
- Equity multiple
- -0.07×
- Total profit
- $-50,526
- Equity at exit
- $25,198
- IRR
- -42.5%
- Equity multiple
- -0.59×
- Total profit
- $-75,327
- Equity at exit
- $14,612
Cash invested: $47,320 (down + closing). Projections, not guarantees.
Landlord ↔ Tenant lean methodology
- Overall (STATE)
- 90 Strongly Landlord-Friendly
- State Indiana
- 90 Strongly Landlord-Friendly · R+11
- County
- — inherits STATE
- City
- — inherits STATE
ZIP-level market 46222
- Home prices YoY
- -16.7%
- Rents YoY
- 2.5%
- Active inventory
- 174
- Price-to-rent
- 10.5×
Monthly cashflow live
- Estimated rent
- $1,344 high interval (Pro) →
- Mortgage (P&I)
- −$886
- Tax from tax record
- −$460 /mo · $5,519/yr
- Insurance
- −$70
- HOA
- −$0
- Vacancy / Maint / Mgmt
- −$282
- Net cashflow
- $-355
Break-even live
Sensitivity live
| Price | -10% $-259 | -5% $-307 | +0% $-355 | +5% $-402 | +10% $-450 |
|---|---|---|---|---|---|
| Rent | -10% $-461 | -5% $-408 | +0% $-355 | +5% $-302 | +10% $-248 |
| Rate | -1.0pp $-270 | -0.5pp $-312 | base $-355 | +0.5pp $-398 | +1.0pp $-443 |
UW: 25.0% down · 7.5% · 30yr · 1.5% tax · 5.0% vac · 8.0% maint · 8.0% mgmt
Financing live
Cash to close
- Down payment
- $42,250
- Closing costs
- $5,070
- Reserves months
- —
- Total cash needed
- —
Loan-product check · same deal, 3 products live
Conventional
25% down · 7.5% · 30yr
- Down + closing
- —
- Monthly P&I
- —
- Monthly cashflow
- —
- DSCR
- —
- Eligible?
- —
Personal DTI + credit; lowest rate.
DSCR
20% down · 8.5% · 30yr
- Down + closing
- —
- Monthly P&I
- —
- Monthly cashflow
- —
- DSCR
- —
- Eligible?
- —
No personal income docs; deal must DSCR.
Hard money
10% down · 12.0% · 12mo
- Down + closing
- —
- Monthly P&I
- —
- Monthly cashflow
- —
- DSCR
- —
- Eligible?
- —
Short-term bridge; refi at stabilization.
Rent comps 18 comps
| Address | Beds | Baths | Sqft | Rent | $/sqft | DOM | Units | Dist |
|---|---|---|---|---|---|---|---|---|
| 3138 Midvale Dr Indianapolis, IN | 3.0 | 1.0 | 900 | $1,495 | $1.66 | 45d | 1 | 0.08mi |
| 3060 Midvale Dr Indianapolis, IN | 3.0 | 1.0 | 900 | $1,200 | $1.33 | 25d | 1 | 0.16mi |
| 3232 Normandy Rd Indianapolis, IN | 3.0 | 1.0 | 900 | $1,250 | $1.39 | 21d | 1 | 0.24mi |
| 3245 Chrysler St Indianapolis, IN | 3.0 | 1.0 | 945 | $1,345 | $1.42 | 6d | 1 | 0.27mi |
| 4014 Alberta St Indianapolis, IN | 3.0 | 1.0 | 988 | $1,195 | $1.21 | 22d | 1 | 0.43mi |
| 3417 N Rybolt Ave Indianapolis, IN | 2.0 | 1.0 | 616 | $1,179 | $1.91 | 0d | 9 | 0.47mi |
| 2907 Corvallis Cres Indianapolis, IN | 3.0 | 1.5 | 1104 | $1,200 | $1.09 | 25d | 1 | 0.62mi |
| 2907 Corvallis Cres Indianapolis, IN | 3.0 | 1.0 | 1104 | $1,200 | $1.09 | 45d | 1 | 0.62mi |
| 2 Philip Ct Indianapolis, IN | 3.0 | 1.0 | 1000 | $1,295 | $1.29 | 25d | 1 | 0.62mi |
| 3201 Watergate Rd Indianapolis, IN | 3.0 | 1.0–2.0 | 826 | $1,269 | $1.54 | 5d | 20 | 0.68mi |
| 2930 Lafayette Rd Indianapolis, IN | 2.0 | 1.0 | 642 | $1,108 | $1.72 | 3d | 5 | 1.03mi |
| 5505 Scarlet Dr Indianapolis, IN | 3.0 | 1.0–1.5 | 883 | $1,669 | $1.89 | 0d | 7 | 1.10mi |
| 3215 N Alton Ave Indianapolis, IN | 1.0–3.0 | 1.0–2.0 | 970 | $1,379 | $1.42 | 0d | 9 | 1.11mi |
| 3215 N Alton Ave Unit 33S3323B Indianapolis, IN | 2.0 | 2.0 | 1064 | $1,109 | $1.04 | 45d | 1 | 1.13mi |
| 3215 N Alton Ave Unit 3326C Indianapolis, IN | 2.0 | 2.0 | 1064 | $1,109 | $1.04 | 22d | 1 | 1.13mi |
| 3451 Sherburne Ln Indianapolis, IN | 1.0–2.0 | 1.0 | 850 | $1,386 | $1.63 | 0d | 37 | 1.22mi |
| 3621 Lawnview Ln Indianapolis, IN | 1.0–3.0 | 1.0–1.5 | 997 | $1,259 | $1.26 | 0d | 12 | 1.39mi |
| 3120 Nobscot Dr Indianapolis, IN | 1.0–3.0 | 1.0–2.0 | 1023 | $1,370 | $1.34 | 0d | 14 | 1.46mi |
Listing history 9 events
-
2026-05-12status Pending
-
2026-05-11$169,000 Active
-
2025-02-07historical
-
2025-02-03$169,000 Active
-
2022-08-05price $1,400
-
2020-10-28soldstatus $115,000 Sold 625-char remark
Show marketing remark (625 chars)
Come Check out this Unique 3 Bedroom Ranch with a In-Law Quarters in Eagledale! You get 2 Homes for the Price of One: Front Home has 3 Bedrooms and 1 Full Bath, Spacious Living Room, Open Concept Updated Kitchen with New Appliances, Nice Dining Area. The In Law Quarters has an Open Concept Full Kitchen with a Living Room, Full Bathroom and a Large Bedroom. Private Fenced Back Yard with Drive Way Gate. It Also has a 8x8 Storage Room to the Side of Home....Updates Include: New Water Heater, Newer HVAC 18', Newly Painted Siding, New Plumbing in Bathrooms, Updated Cabinets and Brand New Roof to be Installed this Weekend.
-
2020-09-18status Pending 625-char remark
Show marketing remark (625 chars)
Come Check out this Unique 3 Bedroom Ranch with a In-Law Quarters in Eagledale! You get 2 Homes for the Price of One: Front Home has 3 Bedrooms and 1 Full Bath, Spacious Living Room, Open Concept Updated Kitchen with New Appliances, Nice Dining Area. The In Law Quarters has an Open Concept Full Kitchen with a Living Room, Full Bathroom and a Large Bedroom. Private Fenced Back Yard with Drive Way Gate. It Also has a 8x8 Storage Room to the Side of Home....Updates Include: New Water Heater, Newer HVAC 18', Newly Painted Siding, New Plumbing in Bathrooms, Updated Cabinets and Brand New Roof to be Installed this Weekend.
-
2020-09-11$115,000 Active 625-char remark
Show marketing remark (625 chars)
Come Check out this Unique 3 Bedroom Ranch with a In-Law Quarters in Eagledale! You get 2 Homes for the Price of One: Front Home has 3 Bedrooms and 1 Full Bath, Spacious Living Room, Open Concept Updated Kitchen with New Appliances, Nice Dining Area. The In Law Quarters has an Open Concept Full Kitchen with a Living Room, Full Bathroom and a Large Bedroom. Private Fenced Back Yard with Drive Way Gate. It Also has a 8x8 Storage Room to the Side of Home....Updates Include: New Water Heater, Newer HVAC 18', Newly Painted Siding, New Plumbing in Bathrooms, Updated Cabinets and Brand New Roof to be Installed this Weekend.
-
2019-01-24soldstatus $50,000
ⓘ Source: listings_history table (triggers on properties + properties_extension) + one-shot
backfill from property_details.listing_events for pre-trigger history.
Tax reassessment forecast IN · Partial reset (capped growth)
- Current annual tax
- $5,519 · $460/mo
- Projected year-2 tax
- $5,519 · $460/mo
- Expected delta
- $0/yr ($0/mo · 0.0%)
ⓘ Screening estimate from a state-policy table — verify with the county assessor before closing.
Climate risk First Street
- Flood 1/10 Low FEMA zone X (unshaded) · 0% chance over 30 yrs
- Wildfire 1/10 Low
- Heat 3/10 Moderate 7 d/yr ≥101°F today · 19 d/yr by 30 yrs out
- Wind 2/10 Low
- Air quality 4/10 Moderate 5 unhealthy d/yr today · 7 by 30 yrs out
Nearby sold comps map
Loading sold comps map…
Walkable amenities ~0.75 mi
Loading nearby amenities…
Taxation est. · year 1
- Rental income
- $16,131
- − Mortgage interest
- −$9,467
- − Property taxes
- −$5,519
- − Insurance
- −$845
- − Repairs & maintenance
- −$1,290
- − Management
- −$1,290
- − Depreciation
- −$4,916
- Taxable loss
- −$7,197
- Est. tax savings @ 24.0%
- +$1,727
- After-tax cash flow
- $-2,528/yr
For passive investors: Depreciation is non-cash, so a rental often shows a tax loss while cash-flowing — sheltering income. Rental losses are passive: they offset passive income freely, and up to $25,000/yr can offset ordinary (W-2) income if you actively participate and your MAGI is under $100k (phasing out to $0 by $150k); unused losses carry forward. On sale, claimed depreciation is recaptured at up to 25%, and gains may owe capital-gains tax (a 1031 exchange can defer both). Figures are a year-1 estimate at your 24.0% rate — not tax advice; consult a CPA.
Schools (NCES district)
- District
- Indianapolis Public Schools
- NCES district ID
- 1804770
- Math proficiency
- 14% ▼ -7.00%
- Reading proficiency
- 20% ▼ -3.00%
- Median HH income
- $32,034
- Composite
- 13.69/100
- National rank
- #9499
- State rank
- #286 of 301 in IN
Livability — Indianapolis city (balance)
No livability data for this city. (Only ~50 U.S. cities are tracked.)
Census & demographics
- Census place
- Indianapolis city (balance), IN
- County
- Marion County · 998,460 people
- City population
- 881,119
- Metro
- Indianapolis-Carmel-Anderson, IN
- Population (ZIP)
- 38,887
- Household income
- $50,783
- Rent vs Own
- Severe rent burden
- 1750.0
Population outlook (Marion County) Hauer SSP2
- Today (2025)
- 1,025,572 people
- By 2030
- 1,065,727 · +3.9%
- By 2040
- 1,141,577 · +11.3%
- By 2050
- 1,208,920 · +17.9%
- By 2075
- 1,367,288 · +33.3%
- By 2100
- 1,438,201 · +40.2%
Race, ethnicity, and origin ACS 2023
- Neighborhood character
- Highly diverse neighborhood (Simpson 0.72)
- Race & ethnicity
- White 32% Black 30% Hispanic / Latino 30% Two or more races 12% Asian 2%
- Hispanic origin (detail)
- Mexican 24% Puerto Rican 1%
- Common ancestry
- Lithuanian 1% Iranian 1% Slovak 1%
- Foreign-born
- 21% · Canada, Jamaica
- Languages at home
- 67% English-only · Spanish 25% Other Indo-European 3% Arabic 2%
Political lean MEDSL · Marion
- 2024 margin
- Strong D (+27.7) · D 63.0% · R 35.3% · Other 1.7%
- 2008→2024 swing
- -0.7pp no change · 2008: 28.4pp · 2024: 27.7pp
- All cycles
- 2024: D+27.7 2020: D+29.1 2016: D+22.8 2012: D+22.2 2008: D+28.4
Not yet ingested
- Civics
- —
Market trends
- HPI YoY
- ▼ -75.47%
- Current HPI
- 375.8479
- Rent YoY
- ▲ 2.46%
- Metro
- Indianapolis-Carmel-Anderson, IN
- State GDP YoY
- ▲ 2.90%
- F500 in state
- 18
Industry mix (Fortune 500 HQ in IN)
| Industry | F500 HQs | Revenue |
|---|---|---|
| Industrial Machinery | 2 | $37B |
|
||
| Healthcare | 1 | $177B |
|
||
| Pharmaceuticals | 1 | $45B |
|
||
| Metals / Steel | 1 | $18B |
|
||
| Agriculture | 1 | $17B |
|
||
| Packaging | 1 | $12B |
|
||
Price history
+238.0% since first listed9 events — show timeline
- 2026-05-12 Pending — MIBOR as Distributed by MLS Grid
- 2026-05-11 Listed $169,000 MIBOR as Distributed by MLS Grid
- 2025-02-07 Listing Removed — MIBOR as Distributed by MLS Grid
- 2025-02-03 Listed $169,000 MIBOR as Distributed by MLS Grid
- 2022-08-05 Price Changed $1,400 RENT.
- 2020-10-28 Sold (MLS) $115,000 MIBOR as Distributed by MLS Grid
- 2020-09-18 Pending — MIBOR as Distributed by MLS Grid
- 2020-09-11 Listed $115,000 MIBOR as Distributed by MLS Grid
- 2019-01-24 Sold (Public Records) $50,000 Public Records
Property tax history
+14.4%/yrLatest (2025): $5,519 · +28.2% YoY. Source: county tax records.
Cash-flow waterfall
monthlySold comps — $/sqft
last 12 mo · ≤1 miLoading sold comps…