 Duplex
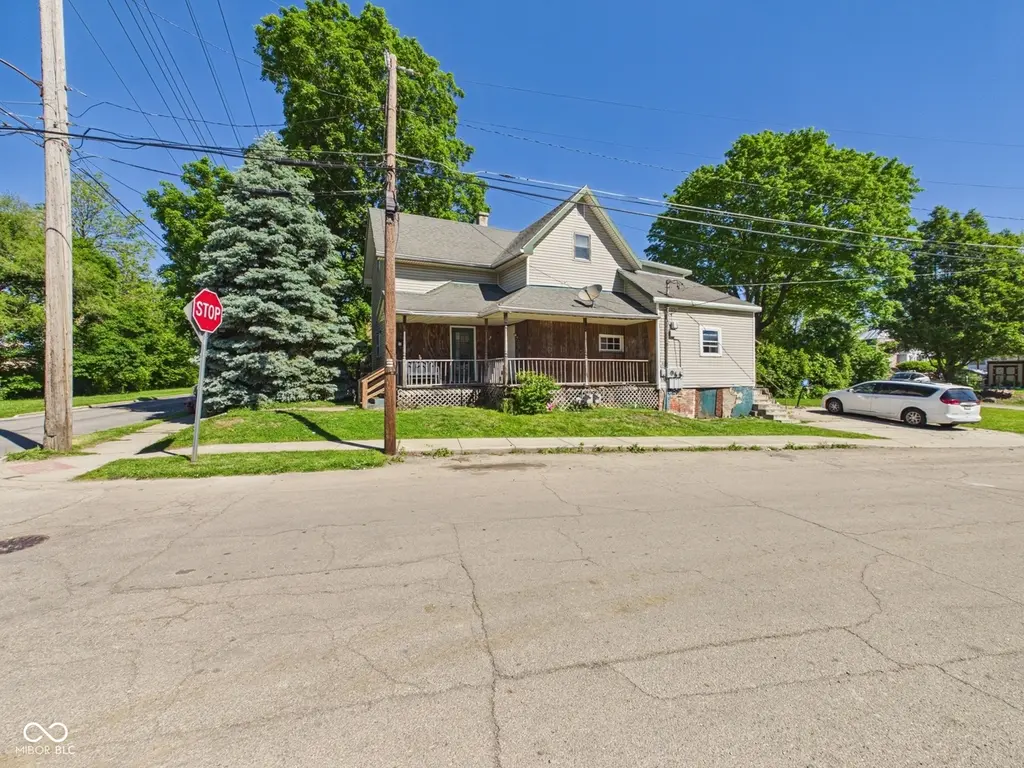
1308-1310 Cincinnati Ave · Anderson, IN
Flood risk 4/10 · Minor
- FEMA flood zone
- X (unshaded)
- Chance of flooding over 30 yrs
- 0.13%
- Est. flood insurance / yr
- $507 – $1,088
Fire risk 1/10 · Minimal
- Est. fire insurance / yr
- $717 – $1,331
Heat risk 3/10 · Minor
- Hot days now (above 100°F)
- 7 days/yr
- Hot days in 30 yrs
- 18 days/yr
Wind risk 2/10 · Minimal
- Chance of severe wind over 30 yrs
- 0.0%
Air-quality risk 3/10 · Minor
- Unhealthy air days now
- 2 days/yr
- Unhealthy air days in 30 yrs
- 3 days/yr
Risk factors via First Street. Map © Google.
Why this score? — see what drove the B+ grade
The composite is a weighted blend of 9 inputs, each scored 0–100. Each bar is that input's sub-score; the figure is the points it added to the 100-point composite (weight × sub-score).
- Cash flow +30.0/30.0
- ARV discount +15.0/15.0
- 1% rule +10.0/10.0
- DSCR +10.0/10.0
- Rent growth +4.5/5.0
- Livability +3.0/5.0
- Condition / age +2.5/5.0
- Schools +1.6/10.0
- Appreciation +0.0/10.0
$87,900
🖨 Deal sheet (PDF) 📄 Offer letter ✓ Due diligence
Multi-family units
County records classify this as Multi-Family (2-4 Unit). Listing-text estimate: 2 units. confirmed
Listing remarks MLS
Corporate owned. Property being sold "As Is, Where Is". Please allow 3-5 days to respond to offers. Gross operating income is an estimate.
Key facts
- 3,330 sq ft lot
- Built 1876
- Listed 32 days
Property features AI
Finance
- Financial info: Property configured as two units; Gross reported income: 21000; One unit rents for $208 weekly; Reported expenses: 0
Exterior
- Parking: 2-car parking
- Utilities: Municipal solid waste service; Owner pays lawn care, sewer, and water
- Home design: Duplex residential income property; Two levels (building has two stories)
- Construction: Crawl space foundation
- Exterior features: Frontage road access; Lot under 1/4 acre
Interior
- Kitchen: 10x10 kitchen in one unit
- Bedrooms: One unit is a 3-bedroom (two-level unit)
- Heating & cooling: Forced air heating; No central air
- Interior features: Exterior entry basement; Conversion property
Neighborhood map
What this means for you Summary
Snapshot
- This is a 2 × 3-bed/1.0-bath units multifamily listed at $88k.
Deal economics
- At list price, monthly cash flow is $1k ($14k/yr) — positive. Per door: $576/mo.
- The deal already cash-flows at list — no discount required.
- Meets the 1% rule at list price ($2k rent vs $88k).
- Recommended offer: $85k (3.0% below list) — sets the bar for market timing.
- Cap rate 22.0% vs local median 6.1% in Anderson — top-decile yield for the area; either an underpriced asset or a hidden risk that comps aren't pricing in. Stress-test before assuming the spread holds.
Location & tenants
- Location reads 60/100 on livability (#521 in IN) — a middle-class / working-renter tenant base. Strengths: cost of living A+, housing A+; Watch: crime D-, amenities F, commute F.
- Anderson Community School Corporation (urban): math 15% / reading 23% proficiency, ranked #280 of 301 in IN (top 93%) — low school quality limits family demand, transient renter base, plan for 1-2y turnover; 70% free/reduced lunch — lower-income household profile, screen leases tightly.
- Zoned schools: Tenth Street Elementary School (math 13% / reading 10%, grade F, #904 of 994 statewide, top 91%, 462 students, 89% FRL); Highland Middle School (math 9% / reading 22%, grade F, #293 of 330 statewide, top 90%, 914 students, 81% FRL); Anderson High School (math 21% / reading 51%, grade F, #261 of 369 statewide, top 71%, 1,790 students, 76% FRL).
- Market conditions: Rents rising fast (+7.9%/yr); 188 active listings in the ZIP; 1 comparable units currently listed for rent nearby; lower-income renter base — watch delinquency; 184 units permitted in Madison County in 2024 (0 in 5+ unit buildings).
- At $2,190/mo this rent would consume 73% of the median local household income ($36k/yr) (locally 1193% of renters already pay >50% of income on rent) — very limited rent-growth headroom before tenants either downsize or default.
Forward outlook
- Local home prices are declining (-3.0%/yr); year-one equity from $608 of loan paydown is wiped out by about $3k of value loss. Plan a longer hold.
- Madison County population projected at -14% by 2050 — secular population decline; favor cash flow + early exit over multi-decade hold.
- At projected returns (-3.0% appreciation + 7.9% rent growth), your $25k cash investment doubles in ~2 years — after that, you're playing with house money.
Negotiation context
- It's been on market 32 days — a 3% lower offer ($85k) is reasonable based on typical stale-listing flexibility.
- 2 sale attempts since 18y ago with the ask held roughly flat each time — persistent listings suggest the price (not the market) is what's stuck; bring a comps-based counter.
- Current owner paid $11k; list at $88k implies a 699% gain — meaningful room to come down on a strong offer.
Risks & watch-outs
- Watch-outs: built in 1876 — expect roof / HVAC / electrical / plumbing capex.
Questions for the listing agent
- It's been on market 32 days. Have you received any prior offers? Is the seller open to a 3% concession, seller financing, or rate buy-down credit?
- Can we see the unit-by-unit rent roll, current vacancy, and any below-market leases? What's the average tenancy length?
- What capital expenditures (roof, boiler, parking lot, exteriors) have been made in the last 5 years, and what's planned in the next 2?
- Built in 1876 — when were the roof, HVAC, electrical panel, plumbing, and water heater last replaced?
- Is there a deadline driving the sale (1031 exchange, divorce, estate, relocation)? That informs how much negotiation room exists.
- Schools are F-rated, which usually means shorter tenancies and higher turnover. Who's the typical renter profile here, and what's been the actual vacancy rate?
- Crime grade is D in this area — have there been break-ins, vandalism, or insurance claims at this property in the last 3 years? What carrier currently insures it and at what premium?
- What's the average days-on-market for RENTAL listings here right now (not sales)? A rising rental-DOM trend means longer vacancies and softer asking-rent achievability than the comps imply.
- What's the recent tenant-quality profile in this submarket — average credit score on applications, eviction rate, late-payment / NSF rate, and stable-employment percentage? A property-management company in the area should have these aggregated.
- How much new apartment / multifamily construction is in the pipeline within 1–3 miles? Heavy new supply (>2% of stock underway) typically softens rents 12–24 months out; light construction supports rent growth.
Investment metrics
- 1% rule
- 2.49% ✓
- Cap rate
- 22.02%
- Cash-on-cash
- 56.16%
- DSCR
- 3.50
- GRM
- 3.3
CMA / ARV
- ARV (on-the-fly)
- $146,160
- Comps found
- 5
Show comp detail 5 sales within ~0.75 mi
| Address | Dist | Beds/Ba | Sqft | Sold | Price | $/sf | Match |
|---|---|---|---|---|---|---|---|
| 807 E 21st St | 0.52mi | 6/3.0 | 2,044 (-2%) | 1mo | $190,000 | $93 | 64 |
| 2105 Central Ave | 0.64mi | 6/4.0 | 2,000 (-4%) | 2mo | $185,000 | $93 | 50 |
| 1609 Brown St | 0.68mi | 5/2.0 (-1) | 1,934 (-7%) | 10mo | $135,000 | $70 | 38 |
| 2213 Noble St | 0.61mi | 5/2.0 (-1) | 2,314 (+11%) | 11mo | $70,000 | $30 | 35 |
| 2116 Pearl St | 0.58mi | 5/3.0 (-1) | 2,357 (+13%) | 24mo | $125,000 | $53 | 19 |
Match score weights: distance 35% · size 25% · config 20% · recency 20%. Top-matched comps best support the ARV.
Projected returns pro-forma
-3.0% appreciation · 7.88% rent growth · sell at horizon
- IRR
- 59.9%
- Equity multiple
- 3.86×
- Total profit
- $70,411
- Equity at exit
- $13,106
- IRR
- 66.3%
- Equity multiple
- 9.41×
- Total profit
- $207,055
- Equity at exit
- $7,600
Cash invested: $24,612 (down + closing). Projections, not guarantees.
Landlord ↔ Tenant lean methodology
- Overall (STATE)
- 90 Strongly Landlord-Friendly
- State Indiana
- 90 Strongly Landlord-Friendly · R+11
- County
- — inherits STATE
- City
- — inherits STATE
ZIP-level market 46016
- Home prices YoY
- -3.5%
- Rents YoY
- 7.9%
- Active inventory
- 188
- Price-to-rent
- 6.7×
Monthly cashflow live
- Estimated rent
- $2,190 high interval (Pro) →
- Mortgage (P&I)
- −$461
- Tax from tax record
- −$81 /mo · $969/yr
- Insurance
- −$37
- HOA
- −$0
- Vacancy / Maint / Mgmt
- −$460
- Net cashflow
- $1,152
Break-even live
Sensitivity live
| Price | -10% $1,202 | -5% $1,177 | +0% $1,152 | +5% $1,127 | +10% $1,102 |
|---|---|---|---|---|---|
| Rent | -10% $979 | -5% $1,065 | +0% $1,152 | +5% $1,238 | +10% $1,325 |
| Rate | -1.0pp $1,196 | -0.5pp $1,174 | base $1,152 | +0.5pp $1,129 | +1.0pp $1,106 |
2-unit breakdown (identical units grouped — click to expand)
| Units | Beds | Baths | Est. rent |
|---|---|---|---|
| 2× units | 3 | 1 | $2,190 |
| #1 | 3 | 1 | $1,095 |
| #2 | 3 | 1 | $1,095 |
| Total (2 units) | $2,190 | ||
UW: 25.0% down · 7.5% · 30yr · 1.5% tax · 5.0% vac · 8.0% maint · 8.0% mgmt
Financing live
Cash to close
- Down payment
- $21,975
- Closing costs
- $2,637
- Reserves months
- —
- Total cash needed
- —
Loan-product check · same deal, 3 products live
Conventional
25% down · 7.5% · 30yr
- Down + closing
- —
- Monthly P&I
- —
- Monthly cashflow
- —
- DSCR
- —
- Eligible?
- —
Personal DTI + credit; lowest rate.
DSCR
20% down · 8.5% · 30yr
- Down + closing
- —
- Monthly P&I
- —
- Monthly cashflow
- —
- DSCR
- —
- Eligible?
- —
No personal income docs; deal must DSCR.
Hard money
10% down · 12.0% · 12mo
- Down + closing
- —
- Monthly P&I
- —
- Monthly cashflow
- —
- DSCR
- —
- Eligible?
- —
Short-term bridge; refi at stabilization.
Rent comps 1 comps
| Address | Beds | Baths | Sqft | Rent | $/sqft | DOM | Units | Dist |
|---|---|---|---|---|---|---|---|---|
| 621 S Madison Ave Anderson, IN | 6.0 | 2.0 | 1961 | $1,375 | $0.70 | 18d | 1 | 1.25mi |
Listing history 17 events
-
2026-06-21days on market $87,900 Active 32 DOM
-
2026-06-18days on market $87,900 Active 29 DOM
-
2026-06-17pricedays on market $87,900 Active 28 DOM
-
2026-06-16days on market $88,900 Active 27 DOM
-
2026-06-15days on market $88,900 Active 26 DOM
-
2026-06-13days on market $88,900 Active 24 DOM
-
2026-06-09days on market $88,900 Active 20 DOM
-
2026-06-08days on market $88,900 Active 19 DOM
-
2026-06-07days on market $88,900 Active 18 DOM
-
2026-06-05days on market $88,900 Active 15 DOM
-
2026-06-03days on market $88,900 Active 14 DOM
-
2026-06-02days on market $88,900 Active 13 DOM
-
2026-06-01days on market $88,900 Active 12 DOM
-
2026-05-31days on market $88,900 Active 11 DOM
-
2026-05-20$89,900 Active
-
2008-03-05soldstatus $11,000 148-char remark
Show marketing remark (148 chars)
Corporate owned. Property being sold "As Is, Where Is". Please allow 3-5 days to respond to offers. Gross operating income is an estimate.
-
2008-01-18$14,900 148-char remark
Show marketing remark (148 chars)
Corporate owned. Property being sold "As Is, Where Is". Please allow 3-5 days to respond to offers. Gross operating income is an estimate.
ⓘ Source: listings_history table (triggers on properties + properties_extension) + one-shot
backfill from property_details.listing_events for pre-trigger history.
Tax reassessment forecast IN · Partial reset (capped growth)
- Current annual tax
- $969 · $81/mo
- Projected year-2 tax
- $969 · $81/mo
- Expected delta
- $0/yr ($0/mo · 0.0%)
ⓘ Screening estimate from a state-policy table — verify with the county assessor before closing.
Climate risk First Street
- Flood 4/10 Moderate FEMA zone X (unshaded) · 13% chance over 30 yrs
- Wildfire 1/10 Low
- Heat 3/10 Moderate 7 d/yr ≥100°F today · 18 d/yr by 30 yrs out
- Wind 2/10 Low 0% chance of damaging wind over 30 yrs
- Air quality 3/10 Moderate 2 unhealthy d/yr today · 3 by 30 yrs out
Nearby sold comps map
Loading sold comps map…
Walkable amenities ~0.75 mi
Loading nearby amenities…
Taxation est. · year 1
- Rental income
- $26,280
- − Mortgage interest
- −$4,924
- − Property taxes
- −$969
- − Insurance
- −$440
- − Repairs & maintenance
- −$2,102
- − Management
- −$2,102
- − Depreciation
- −$2,557
- Taxable income
- $13,186
- Est. tax owed @ 24.0%
- −$3,165
- After-tax cash flow
- $10,657/yr
For passive investors: Depreciation is non-cash, so a rental often shows a tax loss while cash-flowing — sheltering income. Rental losses are passive: they offset passive income freely, and up to $25,000/yr can offset ordinary (W-2) income if you actively participate and your MAGI is under $100k (phasing out to $0 by $150k); unused losses carry forward. On sale, claimed depreciation is recaptured at up to 25%, and gains may owe capital-gains tax (a 1031 exchange can defer both). Figures are a year-1 estimate at your 24.0% rate — not tax advice; consult a CPA.
Schools (NCES district)
- District
- Anderson Community School Corporation
- NCES district ID
- 1800150
- Math proficiency
- 15% ▼ -14.00%
- Reading proficiency
- 23% ▼ -7.00%
- Median HH income
- $38,208
- Composite
- 15.93/100
- National rank
- #9250
- State rank
- #280 of 301 in IN
Livability — Anderson
- Score
- 60/100
- State rank
- #521
- US rank
- #18709
Category grades
Schools grade is shown separately in the Schools card above.
Census & demographics
- Census place
- Anderson, IN
- County
- Madison County · 69,445 people
- City population
- 57,762
- Metro
- Indianapolis-Carmel-Anderson, IN
- Population (ZIP)
- 17,834
- Household income
- $36,029
- Rent vs Own
- Severe rent burden
- 1193.0
Population outlook (Madison County) Hauer SSP2
- Today (2025)
- 125,800 people
- By 2030
- 122,640 · -2.5%
- By 2040
- 115,420 · -8.3%
- By 2050
- 108,148 · -14.0%
- By 2075
- 91,838 · -27.0%
- By 2100
- 75,670 · -39.8%
Race, ethnicity, and origin ACS 2023
- Neighborhood character
- Diverse neighborhood (Simpson 0.58)
- Race & ethnicity
- White 61% Black 18% Hispanic / Latino 13% Two or more races 11% Native American 1%
- Hispanic origin (detail)
- Mexican 10% Puerto Rican 1%
- Common ancestry
- Italian 2% Slovak 1% Iranian 1%
- Foreign-born
- 4% · Canada
- Languages at home
- 86% English-only · Spanish 12%
Political lean MEDSL · Madison
- 2024 margin
- Strong R (+26.9) · D 35.6% · R 62.5% · Other 1.9%
- 2008→2024 swing
- -33.5pp toward R · 2008: 6.5pp · 2024: -26.9pp
- All cycles
- 2024: R+26.9 2020: R+22.6 2016: R+25.7 2012: R+4.5 2008: D+6.5
Not yet ingested
- Civics
- —
Market trends
- HPI YoY
- ▼ -11.12%
- Current HPI
- 302.7437
- Rent YoY
- ▲ 7.88%
- Metro
- Indianapolis-Carmel-Anderson, IN
- State GDP YoY
- ▲ 2.90%
- F500 in state
- 18
Industry mix (Fortune 500 HQ in IN)
| Industry | F500 HQs | Revenue |
|---|---|---|
| Industrial Machinery | 2 | $37B |
|
||
| Healthcare | 1 | $177B |
|
||
| Pharmaceuticals | 1 | $45B |
|
||
| Metals / Steel | 1 | $18B |
|
||
| Agriculture | 1 | $17B |
|
||
| Packaging | 1 | $12B |
|
||
Price history
+489.9% since first listed5 events — show timeline
- 2026-06-16 Price Changed $87,900 MIBOR as Distributed by MLS Grid
- 2026-05-29 Price Changed $88,900 MIBOR as Distributed by MLS Grid
- 2026-05-20 Listed $89,900 MIBOR as Distributed by MLS Grid
- 2008-03-05 Sold (MLS) $11,000 MIBOR as Distributed by MLS Grid
- 2008-01-18 Listed $14,900 MIBOR as Distributed by MLS Grid
Property tax history
+3.8%/yrLatest (2024): $969 · +8.6% YoY. Source: county tax records.
Cash-flow waterfall
monthlySold comps — $/sqft
last 12 mo · ≤1 miLoading sold comps…