 Triplex
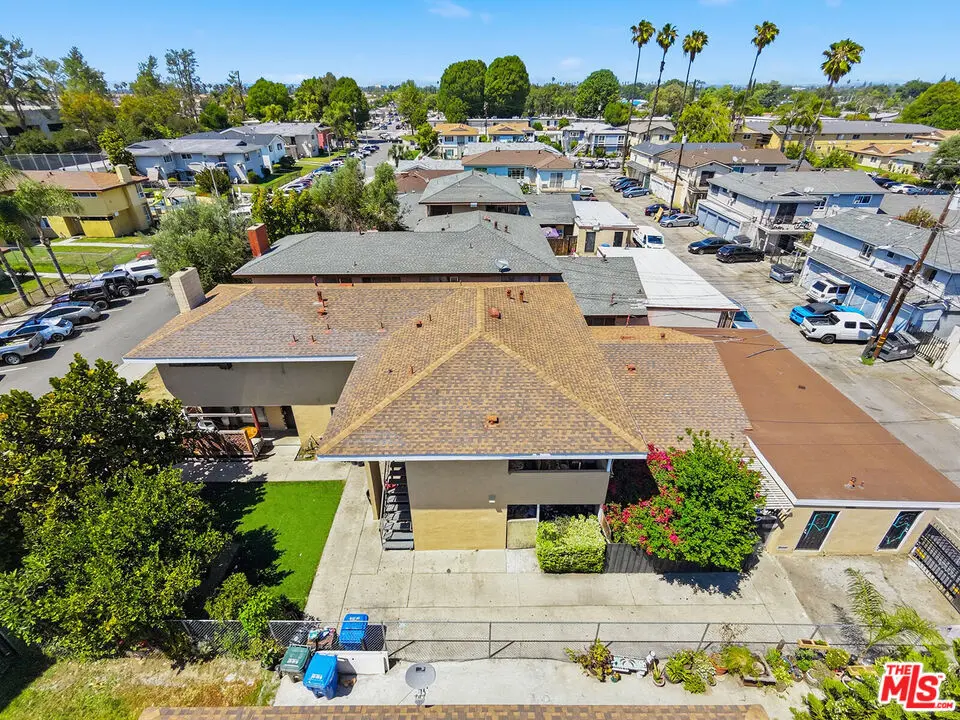
2418 Angela St · Pomona, CA
Flood risk 1/10 · Minimal
- FEMA flood zone
- X (unshaded)
- Chance of flooding over 30 yrs
- 0.0%
- Est. flood insurance / yr
- $507 – $1,088
Fire risk 1/10 · Minimal
- Est. fire insurance / yr
- $659 – $1,223
Heat risk 7/10 · Major
- Hot days now (above 100°F)
- 7 days/yr
- Hot days in 30 yrs
- 20 days/yr
Wind risk 1/10 · Minimal
- Chance of severe wind over 30 yrs
- —
Air-quality risk 7/10 · Major
- Unhealthy air days now
- 15 days/yr
- Unhealthy air days in 30 yrs
- 17 days/yr
Risk factors via First Street. Map © Google.
Why this score? — see what drove the D grade
The composite is a weighted blend of 9 inputs, each scored 0–100. Each bar is that input's sub-score; the figure is the points it added to the 100-point composite (weight × sub-score).
- Cash flow +14.8/30.0
- ARV discount +7.2/15.0
- DSCR +4.5/10.0
- 1% rule +3.9/10.0
- Rent growth +2.9/5.0
- Livability +2.9/5.0
- Condition / age +2.5/5.0
- Schools +2.0/10.0
- Appreciation +0.0/10.0
$1,000,000
🖨 Deal sheet 📄 Offer letter ✓ Due diligence
Multi-family units
County records classify this as Multi-Family (2-4 Unit). Listing-text estimate: 3 units. confirmed
Listing remarks MLS
Great investment property in Pomona. Close to 71 and 60 Fwy. 5 mins drive to Costco, Home Depot and Supper Markets, 15 mins drive to Cal Ploy Pomona. This 4 units complex has: - Unit 1: Front unit at entry level, 3 bedrooms and 2.5 baths. - Unit 2: Main building at entry level, 2 bedrooms and 1.5 bath. - Unit 3: Main building at 2nd floor, 2 bedrooms and 1.5 bath. - Unit 4: Back Unit at entry level, 1 bedroom and 1 bath. Each unit comes with a 1 car garage access in the back of alley. Shared laundry.
Key facts
- Value add potential
- Immediate income
- 7,180 sq ft lot
Tags
Property features AI
Finance
- Other: Zoning: POR31000*
- Financial info: Gross income reported: $57,468; Gross operating income reported: $57,468; Unit rents (actual): $1,271; $2,340 (for two units); $998; Projected unit rents: $2,550; $2,350 (for two units); $1,900; Unit mix: three 1-bed/2-bed/3-bed unit types across 4 units; One building on the parcel
- HOA & community: Four units in the complex (total)
Exterior
- Parking: 4+ car garage
- Home design: Residential income property; Two-level building
- Exterior features: Other detached structures on the property; Property consists of 4 total residential units
Interior
- Bedrooms: One 3-bedroom unit; Two 2-bedroom units; One 1-bedroom unit
- Bathrooms: Unit baths: 1.5, 1.5, 1.0, 1.5 (varies by unit)
- Heating & cooling: Wall heat; Wall/window unit cooling
- Interior features: Wall/window cooling units; Wall heating
Neighborhood map
What this means for you Summary
Snapshot
- This is a 3 × 3-bed/?-bath units multifamily listed at $1.00M.
Deal economics
- At list price, monthly cash flow is $270 ($3k/yr) — positive. Per door: $90/mo.
- The deal already cash-flows at list — no discount required.
- To meet the 1% rule (rent ≥ 1% of price), the offer needs to be $893k (10.7% below list).
- Recommended offer: $893k (10.7% below list) — sets the bar for 1% rule.
- Cap rate 6.6% vs local median 2.8% in Pomona — top-decile yield for the area; either an underpriced asset or a hidden risk that comps aren't pricing in. Stress-test before assuming the spread holds.
Location & tenants
- Location reads 58/100 on livability (#676 in CA) — a working-class tenant base; expect higher turnover. Strengths: commute A+; Watch: schools D, crime F, amenities F.
- Pomona Unified (suburban): math 12% / reading 31% proficiency, ranked #444 of 517 in CA (top 86%) — low school quality limits family demand, transient renter base, plan for 1-2y turnover; 73% free/reduced lunch — lower-income household profile, screen leases tightly.
- Market conditions: Rents rising (+1.7%/yr); 110 active listings in the ZIP; solid renter incomes; 19,697 units permitted in Los Angeles County in 2024 (9,426 in 5+ unit buildings).
- At $8,933/mo this rent would consume 131% of the median local household income ($82k/yr) (locally 2479% of renters already pay >50% of income on rent) — very limited rent-growth headroom before tenants either downsize or default.
Forward outlook
- Local home prices are declining (-3.0%/yr); year-one equity from $7k of loan paydown is wiped out by about $30k of value loss. Plan a longer hold.
- Los Angeles County population projected at +9% by 2050 — modest demand growth; plan on rents tracking national, not racing it.
Negotiation context
- Only 10 days on market — expect competitive offers; lowballing is unlikely to land.
- 11 sale attempts since 29y ago with the ask held roughly flat each time — persistent listings suggest the price (not the market) is what's stuck; bring a comps-based counter.
Risks & watch-outs
- Climate carrying-cost: extreme-heat days projected 7→20/yr by 2055 (HVAC capex compounding) — expect insurance premiums to compound above CPI over the hold.
Questions for the listing agent
- Can we see the unit-by-unit rent roll, current vacancy, and any below-market leases? What's the average tenancy length?
- What capital expenditures (roof, boiler, parking lot, exteriors) have been made in the last 5 years, and what's planned in the next 2?
- Built in 1964 — when were the roof, HVAC, electrical panel, plumbing, and water heater last replaced?
- Is there a deadline driving the sale (1031 exchange, divorce, estate, relocation)? That informs how much negotiation room exists.
- Schools are D-rated, which usually means shorter tenancies and higher turnover. Who's the typical renter profile here, and what's been the actual vacancy rate?
- Crime grade is F in this area — have there been break-ins, vandalism, or insurance claims at this property in the last 3 years? What carrier currently insures it and at what premium?
- The area grade is low — what's the realistic commute time and amenity access for the typical tenant pool here? Any planned neighborhood developments (good or bad) we should know about?
- What's the average days-on-market for RENTAL listings here right now (not sales)? A rising rental-DOM trend means longer vacancies and softer asking-rent achievability than the comps imply.
- What's the recent tenant-quality profile in this submarket — average credit score on applications, eviction rate, late-payment / NSF rate, and stable-employment percentage? A property-management company in the area should have these aggregated.
- How much new apartment / multifamily construction is in the pipeline within 1–3 miles? Heavy new supply (>2% of stock underway) typically softens rents 12–24 months out; light construction supports rent growth.
Investment metrics
- 1% rule
- 0.89% ✗
- Cap rate
- 6.62%
- Cash-on-cash
- 1.16%
- DSCR
- 1.05
- GRM
- 9.3
CMA / ARV
- ARV (on-the-fly)
- $992,500
- Comps found
- 3
Show comp detail 3 sales within ~0.75 mi
| Address | Dist | Beds/Ba | Sqft | Sold | Price | $/sf | Match |
|---|---|---|---|---|---|---|---|
| 2405 Angela St | 0.04mi | 8/7.0 | 3,970 (0%) | 3mo | $960,000 | $242 | 88 |
| 2430 Angela St | 0.02mi | 8/5.5 | 3,828 (-4%) | 2mo | $958,000 | $250 | 78 |
| 2406 Angela St | 0.02mi | 8/6.0 | 3,828 (-4%) | 22mo | $965,000 | $252 | 63 |
Match score weights: distance 35% · size 25% · config 20% · recency 20%. Top-matched comps best support the ARV.
Projected returns pro-forma
-3.0% appreciation · 1.66% rent growth · sell at horizon
- IRR
- -15.9%
- Equity multiple
- 0.44×
- Total profit
- $-156,668
- Equity at exit
- $149,103
- IRR
- -10.0%
- Equity multiple
- 0.42×
- Total profit
- $-161,509
- Equity at exit
- $86,462
Cash invested: $280,000 (down + closing). Projections, not guarantees.
Landlord ↔ Tenant lean methodology
- Overall (STATE)
- 18 Strongly Tenant-Friendly
- State California
- 18 Strongly Tenant-Friendly · D+13
- County
- — inherits STATE
- City
- — inherits STATE
ZIP-level market 91766
- Rents YoY
- 1.7%
- Active inventory
- 110
- Price-to-rent
- 28.0×
Monthly cashflow live
- Estimated rent
- $8,933 high interval (Pro) →
- Mortgage (P&I)
- −$5,244
- Tax from tax record
- −$1,126 /mo · $13,514/yr
- Insurance
- −$417
- HOA
- −$0
- Vacancy / Maint / Mgmt
- −$1,876
- Net cashflow
- $270
Break-even live
3-unit breakdown (identical units grouped — click to expand)
| Units | Beds | Baths | Est. rent |
|---|---|---|---|
| 3× units | 3 | — | $8,934 |
| #1 | 3 | — | $2,978 |
| #2 | 3 | — | $2,978 |
| #3 | 3 | — | $2,978 |
| Total (3 units) | $8,933 | ||
UW: 25.0% down · 7.5% · 30yr · 1.5% tax · 5.0% vac · 8.0% maint · 8.0% mgmt
Financing live
Cash to close
- Down payment
- $250,000
- Closing costs
- $30,000
- Reserves months
- —
- Total cash needed
- —
Loan-product check · same deal, 3 products live
Conventional
25% down · 7.5% · 30yr
- Down + closing
- —
- Monthly P&I
- —
- Monthly cashflow
- —
- DSCR
- —
- Eligible?
- —
Personal DTI + credit; lowest rate.
DSCR
20% down · 8.5% · 30yr
- Down + closing
- —
- Monthly P&I
- —
- Monthly cashflow
- —
- DSCR
- —
- Eligible?
- —
No personal income docs; deal must DSCR.
Hard money
10% down · 12.0% · 12mo
- Down + closing
- —
- Monthly P&I
- —
- Monthly cashflow
- —
- DSCR
- —
- Eligible?
- —
Short-term bridge; refi at stabilization.
Listing history 8 events
-
2026-06-18days on market $1,000,000 Active 10 DOM
-
2026-06-17days on market $1,000,000 Active 9 DOM
-
2026-06-16days on market $1,000,000 Active 8 DOM
-
2026-06-15days on market $1,000,000 Active 7 DOM
-
2026-06-13days on market $1,000,000 Active 5 DOM
-
2026-06-13days on market $1,000,000 Active 4 DOM
-
2026-06-08remarks 699-char remark
-
2026-06-08$1,000,000 Active 1 DOM
ⓘ Source: listings_history table (triggers on properties + properties_extension) + one-shot
backfill from property_details.listing_events for pre-trigger history.
Tax reassessment forecast CA · Resets to sale price
- Current annual tax
- $13,514 · $1,126/mo
- Projected year-2 tax
- $13,514 · $1,126/mo
- Expected delta
- $0/yr ($0/mo · 0.0%)
ⓘ Screening estimate from a state-policy table — verify with the county assessor before closing.
Climate risk First Street
- Flood 1/10 Low FEMA zone X (unshaded) · 0% chance over 30 yrs
- Wildfire 1/10 Low
- Heat 7/10 Severe 7 d/yr ≥100°F today · 20 d/yr by 30 yrs out
- Wind 1/10 Low
- Air quality 7/10 Severe 15 unhealthy d/yr today · 17 by 30 yrs out
Nearby sold comps map
Loading sold comps map…
Walkable amenities ~0.75 mi
Loading nearby amenities…
Taxation est. · year 1
- Rental income
- $107,196
- − Mortgage interest
- −$56,016
- − Property taxes
- −$13,514
- − Insurance
- −$5,000
- − Repairs & maintenance
- −$8,576
- − Management
- −$8,576
- − Depreciation
- −$29,091
- Taxable loss
- −$13,576
- Est. tax savings @ 24.0%
- +$3,258
- After-tax cash flow
- $6,499/yr
For passive investors: Depreciation is non-cash, so a rental often shows a tax loss while cash-flowing — sheltering income. Rental losses are passive: they offset passive income freely, and up to $25,000/yr can offset ordinary (W-2) income if you actively participate and your MAGI is under $100k (phasing out to $0 by $150k); unused losses carry forward. On sale, claimed depreciation is recaptured at up to 25%, and gains may owe capital-gains tax (a 1031 exchange can defer both). Figures are a year-1 estimate at your 24.0% rate — not tax advice; consult a CPA.
Schools (NCES district)
- District
- Pomona Unified
- NCES district ID
- 0631320
- Math proficiency
- 12% ▼ -15.00%
- Reading proficiency
- 31% ▼ -10.00%
- Median HH income
- $54,839
- Composite
- 19.54/100
- National rank
- #8761
- State rank
- #444 of 517 in CA
Livability — Pomona
- Score
- 58/100
- State rank
- #676
- US rank
- #20782
Category grades
Schools grade is shown separately in the Schools card above.
Census & demographics
- Census place
- Pomona, CA
- County
- Los Angeles County · 9,444,647 people
- City population
- 152,679
- Metro
- Los Angeles-Long Beach-Anaheim, CA
- Population (ZIP)
- 69,327
- Household income
- $81,991
- Rent vs Own
- Severe rent burden
- 2479.0
Population outlook (Los Angeles County) Hauer SSP2
- Today (2025)
- 10,940,515 people
- By 2030
- 11,256,481 · +2.9%
- By 2040
- 11,729,929 · +7.2%
- By 2050
- 11,948,407 · +9.2%
- By 2075
- 11,818,114 · +8.0%
- By 2100
- 10,842,928 · -0.9%
Race, ethnicity, and origin ACS 2023
- Neighborhood character
- Predominantly Hispanic (72%)
- Race & ethnicity
- Hispanic / Latino 72% Two or more races 20% Asian 13% White 8% Black 5% Native American 2%
- Hispanic origin (detail)
- Mexican 62%
- Foreign-born
- 37% · Canada, China, South Korea
- Languages at home
- 31% English-only · Spanish 57% Chinese 5% Tagalog/Filipino 2%
Political lean MEDSL · Los Angeles
- 2024 margin
- Solid D (+32.9) · D 64.8% · R 31.9% · Other 3.3%
- 2008→2024 swing
- -7.4pp toward R · 2008: 40.4pp · 2024: 32.9pp
- All cycles
- 2024: D+32.9 2020: D+44.2 2016: D+48.0 2012: D+40.0 2008: D+40.4
Not yet ingested
- Civics
- —
Market trends
- HPI YoY
- ▼ -691.41%
- Current HPI
- 405.6315
- Rent YoY
- ▲ 1.66%
- Metro
- Los Angeles-Long Beach-Anaheim, CA
- State GDP YoY
- ▲ 3.21%
- F500 in state
- 116
Industry mix (Fortune 500 HQ in CA)
| Industry | F500 HQs | Revenue |
|---|---|---|
| Technology | 27 | $1,492B |
|
||
| Financial Services | 3 | $174B |
|
||
| Retail | 3 | $44B |
|
||
| Insurance | 3 | $26B |
|
||
| Media / Entertainment | 2 | $115B |
|
||
| Pharmaceuticals / Biotech | 2 | $62B |
|
||
Price history
+354.5% since first listed30 events — show timeline
- 2026-06-08 Listed $1,000,000 TheMLS
- 2026-03-07 Listing Removed — CRMLS
- 2025-06-07 Listed $949,000 CRMLS
- 2025-06-04 Coming Soon — CRMLS
- 2024-01-30 Sold (Public Records) $953,000 Public Records
- 2024-01-30 Sold (MLS) $953,000 CRMLS
- 2024-01-03 Contingent — CRMLS
- 2023-12-07 Listed $950,000 CRMLS
- 2023-10-31 Listing Removed — CRMLS
- 2023-10-13 Relisted — CRMLS
- 2023-08-04 Listed $999,999 CRMLS
- 2023-05-02 Listed $1,030,000 CRMLS
- 2016-08-09 Sold (Public Records) $570,000 Public Records
- 2016-08-09 Sold (MLS) $570,000 SDMLS
- 2016-08-09 Sold (MLS) $570,000 CRMLS
- 2016-07-29 Pending — CRMLS
- 2016-07-20 Relisted — CRMLS
- 2016-07-14 Pending — CRMLS
- 2016-07-06 Listed $588,000 CRMLS
- 2016-07-04 Listed $588,000 SDMLS
- 2003-06-27 Sold (Public Records) $305,000 Public Records
- 2002-05-02 Sold (Public Records) $241,000 Public Records
- 2002-05-01 Sold (MLS) $242,000 CRMLS
- 2002-02-24 Listed $248,000 CRMLS
- 1998-04-06 Sold (Public Records) $175,000 Public Records
- 1998-04-06 Sold (MLS) $175,000 CRMLS
- 1997-09-24 Listed $179,000 CRMLS
- 1993-12-13 Sold (Public Records) $150,000 Public Records
- 1990-07-18 Sold (Public Records) $275,000 Public Records
- 1988-12-21 Sold (Public Records) $220,000 Public Records
Property tax history
+6.8%/yrLatest (2025): $13,514 · +54.2% YoY. Source: county tax records.
Cash-flow waterfall
monthlySold comps — $/sqft
last 12 mo · ≤1 miLoading sold comps…