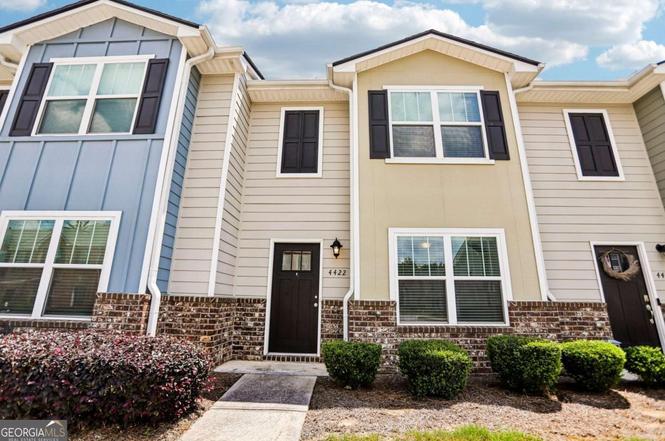
4422 Pinscher St · South Fulton, GA
Flood risk 1/10 · Minimal
- FEMA flood zone
- X (unshaded)
- Chance of flooding over 30 yrs
- 0.0%
- Est. flood insurance / yr
- $507 – $1,088
Fire risk 3/10 · Minor
- Est. fire insurance / yr
- $963 – $1,789
Heat risk 6/10 · Moderate
- Hot days now (above 105°F)
- 7 days/yr
- Hot days in 30 yrs
- 19 days/yr
Wind risk 6/10 · Moderate
- Chance of severe wind over 30 yrs
- 27.0%
Air-quality risk 4/10 · Minor
- Unhealthy air days now
- 4 days/yr
- Unhealthy air days in 30 yrs
- 6 days/yr
Risk factors via First Street. Map © Google.
Why this score? — see what drove the D- grade
The composite is a weighted blend of 9 inputs, each scored 0–100. Each bar is that input's sub-score; the figure is the points it added to the 100-point composite (weight × sub-score).
- Appreciation +10.0/10.0
- Cash flow +7.9/30.0
- Schools +4.5/10.0
- 1% rule +3.1/10.0
- Rent growth +3.1/5.0
- Livability +2.5/5.0
- Condition / age +2.5/5.0
- DSCR +2.0/10.0
- ARV discount +0.0/15.0
$235,000
🖨 Deal sheet (PDF) 📄 Offer letter ✓ Due diligence
Listing remarks MLS
Freshly painted and thoughtfully renovated, this move-in-ready home offers an open and inviting floor plan designed for comfortable everyday living and easy entertaining. Recent improvements include a new HVAC system, providing added peace of mind for the next owner. The spacious layout features abundant natural light, seamless living spaces, and a functional design that accommodates a variety of lifestyles. Conveniently located in Union City, the property offers close proximity to Atlanta, Hartsfield-Jackson Atlanta International Airport, major highways, shopping, dining, and entertainment. Whether you're a first-time homebuyer or looking for your next home, this property is ready for immediate enjoyment.
Key facts
- Open floor plan
- New hvac system
- $98 HOA
Tags
Property features AI
Finance
- Other: Paved city street frontage; Directions available
- HOA & community: Homeowners association with a $98 monthly fee that includes grounds maintenance; One unit in the community
Exterior
- Parking: Deeded parking (2 spaces)
- Utilities: Public water; Public sewer; Electricity available (110 volts); Underground utilities; Sewer available; Water available
- Home design: Two levels; Resale property; Fee simple ownership
- Construction: HardiPlank-type siding; Composition roof; Slab foundation; Built using energy-efficient appliances
- Exterior features: Back yard fencing; Patio
Interior
- Kitchen: Dishwasher; Electric cooktop; Electric range; Range hood; Refrigerator; Pantry; Stone counters
- Bedrooms: Oversized master; Three upper-level bedrooms
- Flooring: Other flooring
- Bathrooms: Two full bathrooms; One half bathroom; Master bathroom with double vanity and tub/shower combo
- Heating & cooling: Central heating; Central air
- Interior features: Double vanity; Walk-in closet(s); Double pane windows; 2+ common walls; Open concept dining area; Pantry; Stone countertops
- Laundry & utility: Dedicated laundry room
Neighborhood map
What this means for you Summary
Snapshot
- This is a 3-bed/2.5-bath townhouse listed at $235k.
Deal economics
- At list price, monthly cash flow is $-247 ($-3k/yr) — negative.
- To cash-flow at today's rent, offer at most $191k (18.5% below list).
- To meet the 1% rule (rent ≥ 1% of price), the offer needs to be $191k (18.9% below list).
- Recommended offer: $191k (18.9% below list) — sets the bar for 1% rule.
Location & tenants
- Location reads: area grade D — affects rentability + tenant quality, not the cash-flow math above.
- Fulton County (suburban): math 49% / reading 53% proficiency, ranked #12 of 174 in GA (top 7%) — acceptable for families but not a draw, mixed tenant base, ~2y average lease.
- Zoned schools: Oakley Elementary School (math 22% / reading 22%, grade F, #810 of 1,228 statewide, top 69%, 712 students, 100% FRL); Bear Creek Middle School (math 17% / reading 26%, grade F, #339 of 470 statewide, top 72%, 1,108 students, 100% FRL); Creekside High School (math 30% / reading 24%, grade F, #160 of 424 statewide, top 38%, 1,768 students, 100% FRL) — zoned schools average 100% FRL vs 41% district-wide (59 pts higher); higher-poverty schools than district average — tighter screening recommended.
- Zoned-school proficiency averages 24% at this address vs 51% district-wide (-27 pts) — the specific schools serving this property underperform the Fulton County average; the district grade overstates school quality for this exact location.
- Market conditions: Rents rising (+2.2%/yr); 174 active listings in the ZIP; 25 comparable units currently listed for rent nearby; rentals at typical pace (median 23d on market — plan ~3-4 weeks tenant-placement turnaround); 11,565 units permitted in Fulton County in 2024 (8,159 in 5+ unit buildings).
- At $1,905/mo this rent would consume 47% of the median local household income ($48k/yr) (locally 1778% of renters already pay >50% of income on rent) — very limited rent-growth headroom before tenants either downsize or default.
Forward outlook
- In year one you build about $25k of equity ($2k loan paydown + $24k appreciation (10.0% local appreciation)).
- Fulton County population projected at +38% by 2050 — long-run rental-demand tailwind backs the buy-and-hold thesis.
- By year 2, paydown + projected appreciation supports a ~$40k cash-out refi (75% LTV) — recoverable capital for the next deal without selling this one.
Negotiation context
- Only 9 days on market — expect competitive offers; lowballing is unlikely to land.
- 2 sale attempts with the ask held roughly flat each time — persistent listings suggest the price (not the market) is what's stuck; bring a comps-based counter.
Risks & watch-outs
- Climate carrying-cost: major wind risk, 27% chance of damaging wind over 30y; extreme-heat days projected 7→19/yr by 2055 (HVAC capex compounding) — expect insurance premiums to compound above CPI over the hold.
Questions for the listing agent
- What do current leases actually rent for vs. the listed asking? Can we see a recent rent roll and the last 12 months of T-12 income?
- What does the HOA fee cover, when was the last increase, and are there any pending special assessments or reserve-fund shortfalls?
- Is there a deadline driving the sale (1031 exchange, divorce, estate, relocation)? That informs how much negotiation room exists.
- The area grade is low — what's the realistic commute time and amenity access for the typical tenant pool here? Any planned neighborhood developments (good or bad) we should know about?
- What's the average days-on-market for RENTAL listings here right now (not sales)? A rising rental-DOM trend means longer vacancies and softer asking-rent achievability than the comps imply.
- What's the recent tenant-quality profile in this submarket — average credit score on applications, eviction rate, late-payment / NSF rate, and stable-employment percentage? A property-management company in the area should have these aggregated.
- How much new for-sale + rental construction is in the pipeline within 1–3 miles? Heavy new supply typically softens prices + rents 12–24 months out; constrained supply supports both.
Investment metrics
- 1% rule
- 0.81% ✗
- Cap rate
- 5.03%
- Cash-on-cash
- -4.50%
- DSCR
- 0.80
- GRM
- 10.3
CMA / ARV
- ARV (on-the-fly)
- $198,120
- Comps found
- 7
Show comp detail 7 sales within ~0.75 mi
| Address | Dist | Beds/Ba | Sqft | Sold | Price | $/sf | Match |
|---|---|---|---|---|---|---|---|
| 309 Ashigan St | 0.07mi | 3/2.5 | 1,620 (+4%) | 3mo | $205,000 | $127 | 88 |
| 316 Ashigan St | 0.07mi | 4/2.5 (+1) | 1,648 (+6%) | 17mo | $251,000 | $152 | 68 |
| 6334 Hickory Lane Cir | 0.67mi | 4/3.0 (+1) | 1,693 (+8%) | 4mo | $195,000 | $115 | 44 |
| 6338 Hickory Lane Cir | 0.67mi | 4/3.0 (+1) | 1,693 (+8%) | 8mo | $178,000 | $105 | 41 |
| 7113 Forest Ln | 0.52mi | 2/2.0 (-1) | 1,700 (+9%) | 22mo | $220,000 | $129 | 35 |
| 7141 Woodridge Ln | 0.42mi | 2/2.0 (-1) | 1,779 (+14%) | 19mo | $220,000 | $124 | 34 |
| 6356 Hickory Lane Cir | 0.66mi | 4/3.0 (+1) | 1,773 (+14%) | 15mo | $226,000 | $127 | 27 |
Match score weights: distance 35% · size 25% · config 20% · recency 20%. Top-matched comps best support the ARV.
Projected returns pro-forma
10.0% appreciation · 2.2% rent growth · sell at horizon
- IRR
- 20.9%
- Equity multiple
- 2.68×
- Total profit
- $110,869
- Equity at exit
- $211,707
- IRR
- 18.8%
- Equity multiple
- 6.11×
- Total profit
- $336,065
- Equity at exit
- $456,553
Cash invested: $65,800 (down + closing). Projections, not guarantees.
Landlord ↔ Tenant lean methodology
- Overall (STATE)
- 90 Strongly Landlord-Friendly
- State Georgia
- 90 Strongly Landlord-Friendly · R+3
- County
- — inherits STATE
- City
- — inherits STATE
ZIP-level market 30291
- Home prices YoY
- 11.1%
- Rents YoY
- 2.2%
- Active inventory
- 174
- Price-to-rent
- 10.3×
Monthly cashflow live
- Estimated rent
- $1,905 high interval (Pro) →
- Mortgage (P&I)
- −$1,232
- Tax from tax record
- −$323 /mo · $3,881/yr
- Insurance
- −$98
- HOA
- −$98
- Vacancy / Maint / Mgmt
- −$400
- Net cashflow
- $-247
Break-even live
Sensitivity live
| Price | -10% $-114 | -5% $-180 | +0% $-247 | +5% $-313 | +10% $-380 |
|---|---|---|---|---|---|
| Rent | -10% $-397 | -5% $-322 | +0% $-247 | +5% $-171 | +10% $-96 |
| Rate | -1.0pp $-128 | -0.5pp $-187 | base $-247 | +0.5pp $-307 | +1.0pp $-369 |
UW: 25.0% down · 7.5% · 30yr · 1.5% tax · 5.0% vac · 8.0% maint · 8.0% mgmt
Financing live
Cash to close
- Down payment
- $58,750
- Closing costs
- $7,050
- Reserves months
- —
- Total cash needed
- —
Loan-product check · same deal, 3 products live
Conventional
25% down · 7.5% · 30yr
- Down + closing
- —
- Monthly P&I
- —
- Monthly cashflow
- —
- DSCR
- —
- Eligible?
- —
Personal DTI + credit; lowest rate.
DSCR
20% down · 8.5% · 30yr
- Down + closing
- —
- Monthly P&I
- —
- Monthly cashflow
- —
- DSCR
- —
- Eligible?
- —
No personal income docs; deal must DSCR.
Hard money
10% down · 12.0% · 12mo
- Down + closing
- —
- Monthly P&I
- —
- Monthly cashflow
- —
- DSCR
- —
- Eligible?
- —
Short-term bridge; refi at stabilization.
Rent comps 25 comps
| Address | Beds | Baths | Sqft | Rent | $/sqft | DOM | Units | Dist |
|---|---|---|---|---|---|---|---|---|
| 4456 Pinscher St Union City, GA | 3.0 | 2.5 | 1560 | $1,600 | $1.03 | 45d | 1 | 0.06mi |
| 306 Ashigan St Union City, GA | 3.0 | 2.5 | 1560 | $1,695 | $1.09 | 45d | 1 | 0.07mi |
| 7200 Grosbeak St Union City, GA | 2.0 | 2.5 | 1560 | $1,500 | $0.96 | 45d | 1 | 0.08mi |
| 4300 Longleaf Ln Union City, GA | 2.0–3.0 | 2.5 | 1407 | $2,685 | $1.91 | 0d | 5 | 0.09mi |
| 313 Ashigan St Union City, GA | 3.0 | 2.5 | 1529 | $1,775 | $1.16 | 23d | 1 | 0.09mi |
| 7190 Gotland St Union City, GA | 2.0 | 2.5 | 1500 | $1,450 | $0.97 | 14d | 1 | 0.10mi |
| 7190 Flagstone Pl Union City, GA | 4.0 | 2.5 | 2246 | $2,255 | $1.00 | 6d | 1 | 0.58mi |
| 6202 Hickory Lane Cir Union City, GA | 3.0 | 2.5 | 1744 | $1,995 | $1.14 | 45d | 1 | 0.73mi |
| 6294 Hickory Lane Cir Union City, GA | 3.0 | 2.5 | 1568 | $1,700 | $1.08 | 45d | 1 | 0.74mi |
| 6237 Hickory Lane Cir Union City, GA | 4.0 | 2.5 | 1420 | $2,300 | $1.62 | 26d | 1 | 0.83mi |
| 217 Elkhound Ct Union City, GA | 3.0 | 2.0 | 1485 | $1,600 | $1.08 | 7d | 1 | 0.91mi |
| 7915 Bluefin Trl Union City, GA | 3.0 | 2.0 | 1514 | $1,815 | $1.20 | 22d | 1 | 1.07mi |
| 5200 Alexander St Union City, GA | 3.0 | 2.0 | 1221 | $1,695 | $1.39 | 45d | 1 | 1.16mi |
| 5205 Alexander St Union City, GA | 3.0 | 2.0 | 1326 | $1,681 | $1.27 | 45d | 1 | 1.16mi |
| 4050 Morgan Rd Union City, GA | 1.0–3.0 | 1.0–2.0 | 988 | $1,750 | $1.77 | 7d | 21 | 1.19mi |
| 7528 Congregation St Fairburn, GA | 3.0 | 2.5 | 1600 | $2,249 | $1.41 | 4d | 1 | 1.33mi |
| 835 Buffington Ct Union City, GA | 4.0 | 2.5 | 1723 | $2,165 | $1.26 | 45d | 1 | 1.36mi |
| 6770 Buffington Rd Union City, GA | 1.0–3.0 | 1.0–2.0 | 950 | $1,699 | $1.79 | 0d | 23 | 1.37mi |
| 6425 Oakley Rd Union City, GA | 1.0–3.0 | 1.0–2.0 | 1037 | $1,506 | $1.45 | 0d | 17 | 1.40mi |
| 6350 Oakley Rd Union City, GA | 2.0–3.0 | 1.0–2.5 | 1360 | $1,925 | $1.42 | 0d | 5 | 1.41mi |
| 4500 Shannon Blvd Unit 7A Union City, GA | 3.0 | 2.5 | 2205 | $1,750 | $0.79 | 26d | 1 | 1.42mi |
| 4500 Shannon Blvd Unit 7A Union City, GA | 3.0 | 2.5 | 2205 | $2,000 | $0.91 | 45d | 1 | 1.42mi |
| 4500 Shannon Blvd Unit 7 Union City, GA | 3.0 | 2.5 | 1503 | $1,750 | $1.16 | 6d | 1 | 1.42mi |
| 5201 Summer Brooke Ct Union City, GA | 3.0 | 2.5 | 1484 | $2,000 | $1.35 | 3d | 1 | 1.42mi |
| 420 Buffington Dr Union City, GA | 3.0 | 2.0 | 2118 | $2,050 | $0.97 | 22d | 1 | 1.42mi |
HOA detail
- Monthly dues
- $98 · $1,176/yr
Listing history 7 events
-
2026-06-21days on market $235,000 Active 9 DOM
-
2026-06-18days on market $235,000 Active 6 DOM
-
2026-06-17days on market $235,000 Active 5 DOM
-
2026-06-16days on market $235,000 Active 4 DOM
-
2026-06-15days on market $235,000 Active 3 DOM
-
2026-06-13remarks 699-char remark
-
2026-06-13$235,000 Active 1 DOM
ⓘ Source: listings_history table (triggers on properties + properties_extension) + one-shot
backfill from property_details.listing_events for pre-trigger history.
Tax reassessment forecast GA · Resets to sale price
- Current annual tax
- $3,881 · $323/mo
- Projected year-2 tax
- $3,881 · $323/mo
- Expected delta
- $0/yr ($0/mo · 0.0%)
ⓘ Screening estimate from a state-policy table — verify with the county assessor before closing.
Climate risk First Street
- Flood 1/10 Low FEMA zone X (unshaded) · 0% chance over 30 yrs
- Wildfire 3/10 Moderate
- Heat 6/10 Major 7 d/yr ≥105°F today · 19 d/yr by 30 yrs out
- Wind 6/10 Major 27% chance of damaging wind over 30 yrs
- Air quality 4/10 Moderate 4 unhealthy d/yr today · 6 by 30 yrs out
Nearby sold comps map
Loading sold comps map…
Walkable amenities ~0.75 mi
Loading nearby amenities…
Taxation est. · year 1
- Rental income
- $22,863
- − Mortgage interest
- −$13,164
- − Property taxes
- −$3,881
- − Insurance
- −$1,175
- − Repairs & maintenance
- −$1,829
- − Management
- −$1,829
- − HOA
- −$1,176
- − Depreciation
- −$6,836
- Taxable loss
- −$7,027
- Est. tax savings @ 24.0%
- +$1,687
- After-tax cash flow
- $-1,272/yr
For passive investors: Depreciation is non-cash, so a rental often shows a tax loss while cash-flowing — sheltering income. Rental losses are passive: they offset passive income freely, and up to $25,000/yr can offset ordinary (W-2) income if you actively participate and your MAGI is under $100k (phasing out to $0 by $150k); unused losses carry forward. On sale, claimed depreciation is recaptured at up to 25%, and gains may owe capital-gains tax (a 1031 exchange can defer both). Figures are a year-1 estimate at your 24.0% rate — not tax advice; consult a CPA.
Schools (NCES district)
- District
- Fulton County
- NCES district ID
- 1302280
- Math proficiency
- 49% ▼ -2.00%
- Reading proficiency
- 53% ▬ 0.00%
- Median HH income
- $68,035
- Composite
- 45.33/100
- National rank
- #2640
- State rank
- #12 of 174 in GA
Livability — South Fulton
No livability data for this city. (Only ~50 U.S. cities are tracked.)
Census & demographics
- Census place
- South Fulton, GA
- County
- Fulton County · 1,094,430 people
- City population
- 127,674
- Metro
- Atlanta-Sandy Springs-Alpharetta, GA
- Population (ZIP)
- 25,130
- Household income
- $48,184
- Rent vs Own
- Severe rent burden
- 1778.0
Population outlook (Fulton County) Hauer SSP2
- Today (2025)
- 1,203,707 people
- By 2030
- 1,299,706 · +8.0%
- By 2040
- 1,488,256 · +23.6%
- By 2050
- 1,664,580 · +38.3%
- By 2075
- 2,036,072 · +69.2%
- By 2100
- 2,222,402 · +84.6%
Race, ethnicity, and origin ACS 2023
- Neighborhood character
- Predominantly Black (86%)
- Race & ethnicity
- Black 86% Hispanic / Latino 7% Two or more races 6% White 3%
- Hispanic origin (detail)
- Mexican 4%
- Common ancestry
- Italian 1%
- Foreign-born
- 5% · Canada
- Languages at home
- 92% English-only · Spanish 6%
Political lean MEDSL · Fulton
- 2024 margin
- Solid D (+44.9) · D 71.9% · R 27.0% · Other 1.1%
- 2008→2024 swing
- +9.8pp toward D · 2008: 35.0pp · 2024: 44.9pp
- All cycles
- 2024: D+44.9 2020: D+46.4 2016: D+42.1 2012: D+29.6 2008: D+35.0
Not yet ingested
- Civics
- —
Market trends
- HPI YoY
- ▲ 23.98%
- Current HPI
- 239.3471
- Rent YoY
- ▲ 2.20%
- Metro
- Atlanta-Sandy Springs-Alpharetta, GA
- State GDP YoY
- ▲ 2.66%
- F500 in state
- 28
Industry mix (Fortune 500 HQ in GA)
| Industry | F500 HQs | Revenue |
|---|---|---|
| Paper / Packaging | 2 | $29B |
|
||
| Retail | 1 | $160B |
|
||
| Transportation / Logistics | 1 | $91B |
|
||
| Airlines | 1 | $62B |
|
||
| Consumer Goods | 1 | $47B |
|
||
| Utilities | 1 | $25B |
|
||
Price history
+0.0% since first listed2 events — show timeline
- 2026-06-12 Listed $235,000 GAMLS
- 2026-06-12 Listed $235,000 FMLS
Property tax history
+80.0%/yrLatest (2025): $3,881 · -0.0% YoY. Source: county tax records.
Cash-flow waterfall
monthlySold comps — $/sqft
last 12 mo · ≤1 miLoading sold comps…