9140 N Starr Loop · Hayden, ID
Flood risk No data
- FEMA flood zone
- —
- Chance of flooding over 30 yrs
- —
- Est. flood insurance / yr
- —
Fire risk No data
- Est. fire insurance / yr
- —
Heat risk No data
- Hot days now (above threshold)
- —
- Hot days in 30 yrs
- —
Wind risk No data
- Chance of severe wind over 30 yrs
- —
Air-quality risk No data
- Unhealthy air days now
- —
- Unhealthy air days in 30 yrs
- —
Risk factors via First Street. Map © Google.
Why this score? — see what drove the B grade
The composite is a weighted blend of 9 inputs, each scored 0–100. Each bar is that input's sub-score; the figure is the points it added to the 100-point composite (weight × sub-score).
- Cash flow +30.0/30.0
- DSCR +10.0/10.0
- 1% rule +9.6/10.0
- ARV discount +7.5/15.0
- Schools +4.4/10.0
- Livability +3.2/5.0
- Rent growth +2.8/5.0
- Condition / age +2.5/5.0
- Appreciation +0.0/10.0
$128,600
🖨 Deal sheet 📄 Offer letter ✓ Due diligence
Listing remarks
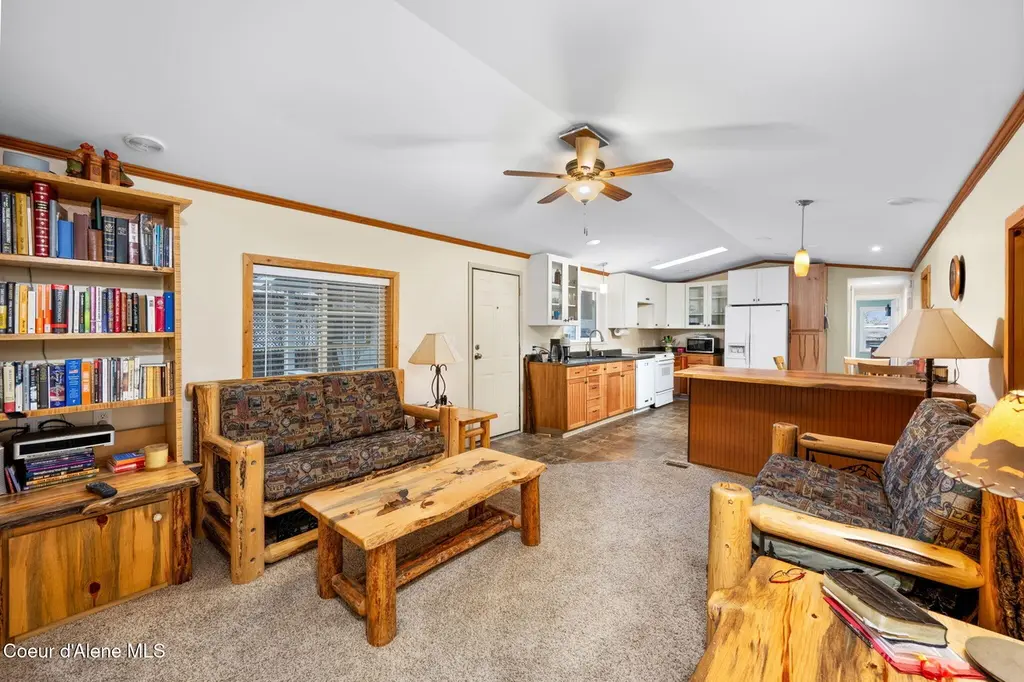
Nicely updated home located in the Hayden Pines 55+ community. PLUS your Lot Rent is PAID for a FULL YEAR! Just blocks to all of the conveniences in Hayden! Dining, Shopping, Fitness, Movies, Medical, and Groceries. This park offers some of the lowest lot fees around. Very well maintained and 95% upgraded with many thoughtful updates. A bright open-concept kitchen with solid alder cabinets, tons of storage and counter space, new flooring, paint, and a freshly fully renovated bathroom. Upgraded electrical and a newer roof. Outside, a large attached carport with a covered and elevated porch, a covered front porch, and a large storage shed. Such a great location in a quiet setting with friendl
Key facts
- Covered front porch
- Open-concept kitchen
- Solid alder cabinets
Tags
Property features AI
Finance
- HOA & community: Association covers sewer, snow removal and trash; Sidewalks in the community
Exterior
- Parking: Paved parking
- Utilities: Public water; Public sewer; Cable TV available; Paved private road with road maintenance agreement (private maintained road)
- Home design: Manufactured home; Gala make/model
- Construction: T1-11 exterior siding; Composition roof; Pillar/post/pier, slab and block foundation
- Exterior features: Covered porch; Covered deck; Patio; Fruit trees; Exterior lighting; Rain gutters; Lawn; Shed(s); Partially fenced backyard; Open, landscaped, level lot
Interior
- Kitchen: Electric range; Dishwasher; Refrigerator
- Bedrooms: 2 bedrooms on the main level
- Flooring: Laminate flooring; Carpet
- Bathrooms: 2 bathrooms on the main level
- Heating & cooling: Electric forced-air furnace; Wall cooling unit(s)
- Interior features: Cable internet and high-speed internet available; DSL available; Skylight(s); Crawl space (no full basement)
- Laundry & utility: Washer; Electric dryer (electric dryer hookup); Electric water heater
Neighborhood map
What this means for you Summary
Snapshot
- This is a 2-bed/2.0-bath manufactured listed at $129k.
Deal economics
- At list price, monthly cash flow is $595 ($7k/yr) — positive.
- The deal already cash-flows at list — no discount required.
- Meets the 1% rule at list price ($2k rent vs $129k).
- Recommended offer: $125k (3.0% below list) — sets the bar for market timing.
- Cap rate 11.8% vs local median 2.2% in Hayden — top-decile yield for the area; either an underpriced asset or a hidden risk that comps aren't pricing in. Stress-test before assuming the spread holds.
Location & tenants
- Location reads 64/100 on livability (#150 in ID) — a middle-class / working-renter tenant base. Strengths: crime A+, housing A+; Watch: schools D+, amenities F, commute F.
- Coeur D'Alene District (urban): math 44% / reading 60% proficiency, ranked #23 of 92 in ID (top 25%) — acceptable for families but not a draw, mixed tenant base, ~2y average lease.
- Market conditions: Rents rising (+1.2%/yr); 383 active listings in the ZIP; 4 comparable units currently listed for rent nearby; rentals leasing fast (median 13d on market — plan ~1-2 weeks tenant-placement turnaround); solid renter incomes; 1,606 units permitted in Kootenai County in 2024 (154 in 5+ unit buildings).
Forward outlook
- Local home prices are declining (-3.0%/yr); year-one equity from $889 of loan paydown is wiped out by about $4k of value loss. Plan a longer hold.
- Kootenai County population projected at +33% by 2050 — long-run rental-demand tailwind backs the buy-and-hold thesis.
- At projected returns (-3.0% appreciation + 1.2% rent growth), your $36k cash investment doubles in ~7 years — after that, you're playing with house money.
Negotiation context
- It's been on market 53 days — a 3% lower offer ($125k) is reasonable based on typical stale-listing flexibility.
- 7 sale attempts since 17y ago with the ask held roughly flat each time — persistent listings suggest the price (not the market) is what's stuck; bring a comps-based counter.
Questions for the listing agent
- It's been on market 53 days. Have you received any prior offers? Is the seller open to a 3% concession, seller financing, or rate buy-down credit?
- Is there a deadline driving the sale (1031 exchange, divorce, estate, relocation)? That informs how much negotiation room exists.
- Schools are D-rated, which usually means shorter tenancies and higher turnover. Who's the typical renter profile here, and what's been the actual vacancy rate?
- What's the average days-on-market for RENTAL listings here right now (not sales)? A rising rental-DOM trend means longer vacancies and softer asking-rent achievability than the comps imply.
- What's the recent tenant-quality profile in this submarket — average credit score on applications, eviction rate, late-payment / NSF rate, and stable-employment percentage? A property-management company in the area should have these aggregated.
- How much new for-sale + rental construction is in the pipeline within 1–3 miles? Heavy new supply typically softens prices + rents 12–24 months out; constrained supply supports both.
Investment metrics
- 1% rule
- 1.46% ✓
- Cap rate
- 11.84%
- Cash-on-cash
- 19.82%
- DSCR
- 1.88
- GRM
- 5.7
CMA / ARV
No comps found within radius.
Projected returns pro-forma
-3.0% appreciation · 1.16% rent growth · sell at horizon
- IRR
- 9.8%
- Equity multiple
- 1.38×
- Total profit
- $13,659
- Equity at exit
- $19,175
- IRR
- 17.4%
- Equity multiple
- 2.31×
- Total profit
- $47,288
- Equity at exit
- $11,119
Cash invested: $36,008 (down + closing). Projections, not guarantees.
Landlord ↔ Tenant lean methodology
- Overall (STATE)
- 91 Strongly Landlord-Friendly
- State Idaho
- 91 Strongly Landlord-Friendly · R+18
- County
- — inherits STATE
- City
- — inherits STATE
ZIP-level market 83835
- Rents YoY
- 1.2%
- Active inventory
- 383
- Price-to-rent
- 5.7×
Monthly cashflow live
- Estimated rent
- $1,878 medium interval (Pro) →
- Mortgage (P&I)
- −$674
- Tax est. 1.5%
- −$161 /mo · $1,929/yr
- Insurance
- −$54
- HOA
- −$0
- Vacancy / Maint / Mgmt
- −$394
- Net cashflow
- $595
Break-even live
UW: 25.0% down · 7.5% · 30yr · 1.5% tax · 5.0% vac · 8.0% maint · 8.0% mgmt
Financing live
Cash to close
- Down payment
- $32,150
- Closing costs
- $3,858
- Reserves months
- —
- Total cash needed
- —
Loan-product check · same deal, 3 products live
Conventional
25% down · 7.5% · 30yr
- Down + closing
- —
- Monthly P&I
- —
- Monthly cashflow
- —
- DSCR
- —
- Eligible?
- —
Personal DTI + credit; lowest rate.
DSCR
20% down · 8.5% · 30yr
- Down + closing
- —
- Monthly P&I
- —
- Monthly cashflow
- —
- DSCR
- —
- Eligible?
- —
No personal income docs; deal must DSCR.
Hard money
10% down · 12.0% · 12mo
- Down + closing
- —
- Monthly P&I
- —
- Monthly cashflow
- —
- DSCR
- —
- Eligible?
- —
Short-term bridge; refi at stabilization.
Rent comps 4 comps
| Address | Beds | Baths | Sqft | Rent | $/sqft | DOM | Units | Dist |
|---|---|---|---|---|---|---|---|---|
| 705 Shiloh Loop Unit 705-302 Hayden, ID | 2.0 | 2.0 | 1000 | $1,550 | $1.55 | 13d | 1 | 0.67mi |
| 7534 N Culture Way Coeur d'Alene, ID | 2.0–3.0 | 2.0 | 1213 | $1,730 | $1.43 | 13d | 4 | 0.70mi |
| 1586 W Switchgrass Ln Coeur d'Alene, ID | 1.0–3.0 | 1.0–2.5 | 1062 | $1,995 | $1.88 | 13d | 5 | 1.01mi |
| 1070 W Rustic Lodge Dr Unit 204 Coeur d'Alene, ID | 2.0 | 2.0 | 1025 | $1,715 | $1.67 | 21d | 1 | 1.23mi |
Listing history 29 events
-
2026-06-19days on market $128,600 Active 53 DOM
-
2026-06-18days on market $128,600 Active 52 DOM
-
2026-06-17days on market $128,600 Active 51 DOM
-
2026-06-16days on market $128,600 Active 50 DOM
-
2026-06-15days on market $128,600 Active 49 DOM
-
2026-06-14days on market $128,600 Active 47 DOM
-
2026-06-13days on market $128,600 Active 46 DOM
-
2026-06-10days on market $128,600 Active 44 DOM
-
2026-06-09days on market $128,600 Active 43 DOM
-
2026-06-09price $128,600 Active 42 DOM
-
2026-06-08days on market $130,000 Active 42 DOM
-
2026-06-07days on market $130,000 Active 41 DOM
-
2026-06-03days on market $130,000 Active 37 DOM
-
2026-06-02days on market $130,000 Active 36 DOM
-
2026-06-01days on market $130,000 Active 35 DOM
-
2026-05-31days on market $130,000 Active 34 DOM
-
2026-05-30days on market $130,000 Active 33 DOM
-
2026-04-27$130,000 Active
-
2026-04-24historical
-
2026-04-22$130,000 Active
-
2026-01-22$145,000 Active
-
2026-01-22$145,000 Active
-
2026-01-22$145,000 Active
-
2021-11-30status Pending
-
2021-11-29price $100,000
-
2021-11-09price $112,000
-
2021-10-15$119,000 Active
-
2009-08-31soldstatus
-
2009-06-10$16,000
ⓘ Source: listings_history table (triggers on properties + properties_extension) + one-shot
backfill from property_details.listing_events for pre-trigger history.
Nearby sold comps map
Loading sold comps map…
Walkable amenities ~0.75 mi
Loading nearby amenities…
Taxation est. · year 1
- Rental income
- $22,535
- − Mortgage interest
- −$7,204
- − Property taxes
- −$1,929
- − Insurance
- −$643
- − Repairs & maintenance
- −$1,803
- − Management
- −$1,803
- − Depreciation
- −$3,741
- Taxable income
- $5,412
- Est. tax owed @ 24.0%
- −$1,299
- After-tax cash flow
- $5,839/yr
For passive investors: Depreciation is non-cash, so a rental often shows a tax loss while cash-flowing — sheltering income. Rental losses are passive: they offset passive income freely, and up to $25,000/yr can offset ordinary (W-2) income if you actively participate and your MAGI is under $100k (phasing out to $0 by $150k); unused losses carry forward. On sale, claimed depreciation is recaptured at up to 25%, and gains may owe capital-gains tax (a 1031 exchange can defer both). Figures are a year-1 estimate at your 24.0% rate — not tax advice; consult a CPA.
Schools (NCES district)
- District
- Coeur D'Alene District
- NCES district ID
- 1600780
- Math proficiency
- 44% ▼ -6.00%
- Reading proficiency
- 60% ▼ -2.00%
- Median HH income
- $47,652
- Composite
- 44.16/100
- National rank
- #2858
- State rank
- #23 of 92 in ID
Livability — Hayden
- Score
- 64/100
- State rank
- #150
- US rank
- #14103
Category grades
Schools grade is shown separately in the Schools card above.
Census & demographics
- Census place
- Hayden, ID
- County
- Kootenai County · 146,553 people
- City population
- 24,238
- Metro
- Coeur d'Alene, ID
- Population (ZIP)
- 24,238
- Household income
- $91,316
- Rent vs Own
- Severe rent burden
- 345.0
Population outlook (Kootenai County) Hauer SSP2
- Today (2025)
- 177,692 people
- By 2030
- 190,689 · +7.3%
- By 2040
- 214,704 · +20.8%
- By 2050
- 236,510 · +33.1%
- By 2075
- 285,984 · +60.9%
- By 2100
- 316,459 · +78.1%
Race, ethnicity, and origin ACS 2023
- Neighborhood character
- Predominantly White (91%)
- Race & ethnicity
- White 91% Two or more races 6% Hispanic / Latino 4%
- Common ancestry
- Portuguese 6% Italian 3% Slovak 3%
- Foreign-born
- 3% · Canada
- Languages at home
- 98% English-only · Spanish 1%
Political lean MEDSL · Kootenai
- 2024 margin
- Solid R (+51.9) · D 22.9% · R 74.8% · Other 2.2%
- 2008→2024 swing
- -25.6pp toward R · 2008: -26.3pp · 2024: -51.9pp
- All cycles
- 2024: R+51.9 2020: R+42.9 2016: R+42.5 2012: R+34.3 2008: R+26.3
Not yet ingested
- Civics
- —
Market trends
- HPI YoY
- ▼ -271.03%
- Current HPI
- 256.927
- Rent YoY
- ▲ 1.16%
- Metro
- Coeur d'Alene, ID
- State GDP YoY
- ▲ 4.51%
- F500 in state
- 6
Industry mix (Fortune 500 HQ in ID)
| Industry | F500 HQs | Revenue |
|---|---|---|
| Retail | 1 | $79B |
|
||
| Technology | 1 | $25B |
|
||
| Food / Agriculture | 1 | $6B |
|
||
Price history
+712.5% since first listed12 events — show timeline
- 2026-04-27 Listed $130,000 CDAMLS
- 2026-04-24 Listing Removed — SPOKANEMLS as Distributed by MLS Grid
- 2026-04-22 Listed $130,000 SELMLS
- 2026-01-22 Listed $145,000 CDAMLS
- 2026-01-22 Listed $145,000 SPOKANEMLS as Distributed by MLS Grid
- 2026-01-22 Listed $145,000 SELMLS
- 2021-11-30 Pending — CDAMLS
- 2021-11-29 Price Changed $100,000 CDAMLS
- 2021-11-09 Price Changed $112,000 CDAMLS
- 2021-10-15 Listed $119,000 CDAMLS
- 2009-08-31 Sold (MLS) — CDAMLS
- 2009-06-10 Listed $16,000 CDAMLS
Cash-flow waterfall
monthlySold comps — $/sqft
last 12 mo · ≤1 miLoading sold comps…