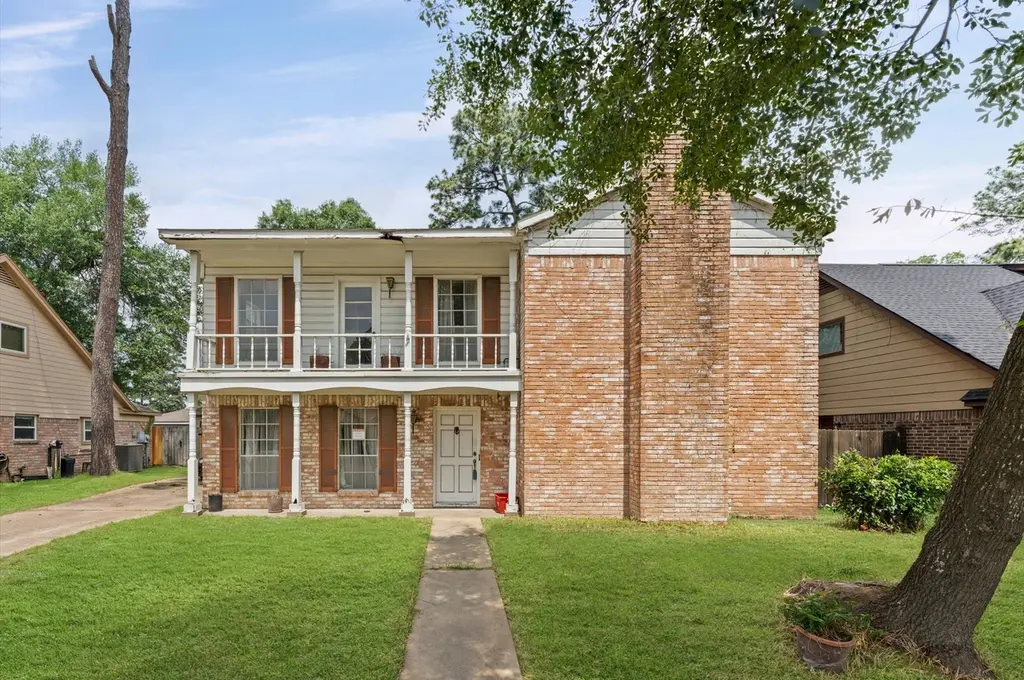
9634 Dornoch Dr · Houston, TX
Flood risk 1/10 · Minimal
- FEMA flood zone
- X (unshaded)
- Chance of flooding over 30 yrs
- 0.0%
- Est. flood insurance / yr
- $507 – $1,088
Fire risk 1/10 · Minimal
- Est. fire insurance / yr
- $1,222 – $2,270
Heat risk 9/10 · Severe
- Hot days now (above 111°F)
- 7 days/yr
- Hot days in 30 yrs
- 23 days/yr
Wind risk 9/10 · Severe
- Chance of severe wind over 30 yrs
- 99.0%
Air-quality risk 3/10 · Minor
- Unhealthy air days now
- 2 days/yr
- Unhealthy air days in 30 yrs
- 3 days/yr
Risk factors via First Street. Map © Google.
Why this score? — see what drove the C- grade
The composite is a weighted blend of 9 inputs, each scored 0–100. Each bar is that input's sub-score; the figure is the points it added to the 100-point composite (weight × sub-score).
- Cash flow +16.7/30.0
- ARV discount +13.7/15.0
- 1% rule +5.9/10.0
- DSCR +5.2/10.0
- Schools +4.1/10.0
- Livability +3.7/5.0
- Condition / age +2.5/5.0
- Rent growth +2.0/5.0
- Appreciation +0.0/10.0
$213,000
🖨 Deal sheet 📄 Offer letter ✓ Due diligence
Listing remarks MLS
Nestled in a charming, established neighborhood in Spring, this home at 9634 Dornoch Dr offers a fantastic opportunity to create something truly special. With great bones and a functional layout, this property is ready for your personal touch and updates. Ideal for investors or buyers looking to customize their dream home, the spacious lot and inviting setting provide the perfect canvas for renovation. Enjoy the quiet streets, mature trees, and convenient access to nearby shopping, dining, and major roadways. Bring your vision and unlock the potential this hidden gem has to offer!
Key facts
- Convenient access
- Spacious lot
- Mature trees
Tags
Neighborhood map
What this means for you Summary
Snapshot
- This is a 4-bed/2.5-bath single-family listed at $213k.
Deal economics
- At list price, monthly cash flow is $132 ($2k/yr) — positive.
- The deal already cash-flows at list — no discount required.
- Meets the 1% rule at list price ($2k rent vs $213k).
- Recommended offer: $207k (3.0% below list) — sets the bar for market timing.
- Cap rate 7.0% vs local median 3.2% in Houston — top-decile yield for the area; either an underpriced asset or a hidden risk that comps aren't pricing in. Stress-test before assuming the spread holds.
Location & tenants
- Location reads 74/100 on livability (#184 in TX, #4,771 nationally) — a middle-class / working-renter tenant base. Strengths: amenities A+, cost of living A+, housing A+; Watch: schools D, crime F.
- Klein ISD (suburban): math 41% / reading 48% proficiency, ranked #213 of 826 in TX (top 26%) — families likely to look elsewhere, expect single-tenant / working-renter base with shorter leases.
- Market conditions: Rents soft (-1.9%/yr); 622 active listings in the ZIP; 10 comparable units currently listed for rent nearby; rentals lingering (median 44d on market — plan ~5-8 weeks vacancy on turnover, expect pricing pressure); 50% of comp listings sitting > 30 days — soft ceiling on asking rent; solid renter incomes; 29,883 units permitted in Harris County in 2024 (8,621 in 5+ unit buildings).
Forward outlook
- Local home prices are declining (-3.0%/yr); year-one equity from $1k of loan paydown is wiped out by about $6k of value loss. Plan a longer hold.
- Harris County population projected at +47% by 2050 — long-run rental-demand tailwind backs the buy-and-hold thesis.
Negotiation context
- It's been on market 57 days — a 3% lower offer ($207k) is reasonable based on typical stale-listing flexibility.
Risks & watch-outs
- Watch-outs: property tax is 2.6% of price.
- Climate carrying-cost: severe wind risk, 99% chance of damaging wind over 30y; extreme-heat days projected 7→23/yr by 2055 (HVAC capex compounding) — expect insurance premiums to compound above CPI over the hold.
Questions for the listing agent
- It's been on market 57 days. Have you received any prior offers? Is the seller open to a 3% concession, seller financing, or rate buy-down credit?
- Built in 1972 — when were the roof, HVAC, electrical panel, plumbing, and water heater last replaced?
- Property tax is high relative to price — has the assessment been appealed recently, and will the sale trigger a re-assessment?
- What does the HOA fee cover, when was the last increase, and are there any pending special assessments or reserve-fund shortfalls?
- Is there a deadline driving the sale (1031 exchange, divorce, estate, relocation)? That informs how much negotiation room exists.
- Schools are D-rated, which usually means shorter tenancies and higher turnover. Who's the typical renter profile here, and what's been the actual vacancy rate?
- Crime grade is F in this area — have there been break-ins, vandalism, or insurance claims at this property in the last 3 years? What carrier currently insures it and at what premium?
- What's the average days-on-market for RENTAL listings here right now (not sales)? A rising rental-DOM trend means longer vacancies and softer asking-rent achievability than the comps imply.
- What's the recent tenant-quality profile in this submarket — average credit score on applications, eviction rate, late-payment / NSF rate, and stable-employment percentage? A property-management company in the area should have these aggregated.
- How much new for-sale + rental construction is in the pipeline within 1–3 miles? Heavy new supply typically softens prices + rents 12–24 months out; constrained supply supports both.
Investment metrics
- 1% rule
- 1.09% ✓
- Cap rate
- 7.04%
- Cash-on-cash
- 2.65%
- DSCR
- 1.12
- GRM
- 7.7
CMA / ARV
- ARV (median comp)
- $246,860
- List price
- $213,000
- Delta
- -13.72%
- Verdict
- UNDERPRICED
- Comps
- 20 within 1.0 mi
Show comp detail 12 sales within ~0.75 mi
| Address | Dist | Beds/Ba | Sqft | Sold | Price | $/sf | Match |
|---|---|---|---|---|---|---|---|
| 17215 Chaseloch St | 0.31mi | 3/2.5 (-1) | 2,587 (+4%) | 3mo | $250,000 | $97 | 72 |
| 9602 Ballin David Dr | 0.25mi | 4/2.0 | 2,264 (-9%) | 6mo | $305,000 | $135 | 66 |
| 16810 Methil Dr | 0.26mi | 4/2.0 | 2,269 (-9%) | 8mo | $269,000 | $119 | 65 |
| 9715 Ballin David Dr | 0.20mi | 3/2.0 (-1) | 2,200 (-12%) | 1mo | $239,000 | $109 | 63 |
| 9018 Heather Springs Dr | 0.62mi | 3/2.0 (-1) | 2,470 (-1%) | 3mo | $339,000 | $137 | 60 |
| 17406 Bonnie Sean Dr | 0.42mi | 4/2.0 | 2,265 (-9%) | 9mo | $309,900 | $137 | 56 |
| 9422 Tallow Tree Dr | 0.66mi | 4/2.5 | 2,396 (-4%) | 9mo | $345,000 | $144 | 56 |
| 10022 Jan Glen Ln | 0.44mi | 3/2.0 (-1) | 2,322 (-7%) | 8mo | $375,000 | $161 | 54 |
| 17030 Highworth Dr | 0.58mi | 4/2.5 | 2,251 (-10%) | 9mo | $289,999 | $129 | 50 |
| 17606 Forest Haven Trl | 0.74mi | 3/2.0 (-1) | 2,363 (-5%) | 6mo | $324,387 | $137 | 45 |
| 9230 Silverton Star Ln | 0.64mi | 3/2.0 (-1) | 2,166 (-13%) | 1mo | $359,900 | $166 | 41 |
| 9319 Bayou Bluff Dr | 0.70mi | 3/2.0 (-1) | 2,140 (-14%) | 1mo | $225,000 | $105 | 36 |
Match score weights: distance 35% · size 25% · config 20% · recency 20%. Top-matched comps best support the ARV.
Projected returns pro-forma
-3.0% appreciation · 0.0% rent growth · sell at horizon
- IRR
- -16.0%
- Equity multiple
- 0.45×
- Total profit
- $-32,737
- Equity at exit
- $31,759
- IRR
- -15.1%
- Equity multiple
- 0.28×
- Total profit
- $-43,231
- Equity at exit
- $18,416
Cash invested: $59,640 (down + closing). Projections, not guarantees.
Landlord ↔ Tenant lean methodology
- Overall (STATE)
- 87 Strongly Landlord-Friendly
- State Texas
- 87 Strongly Landlord-Friendly · R+5
- County
- — inherits STATE
- City
- — inherits STATE
ZIP-level market 77379
- Home prices YoY
- -34.7%
- Rents YoY
- -1.9%
- Active inventory
- 622
- Price-to-rent
- 7.7×
Monthly cashflow live
- Estimated rent
- $2,317 high interval (Pro) →
- Mortgage (P&I)
- −$1,117
- Tax from tax record
- −$464 /mo · $5,565/yr
- Insurance
- −$89
- HOA
- −$29
- Vacancy / Maint / Mgmt
- −$487
- Net cashflow
- $132
Break-even live
UW: 25.0% down · 7.5% · 30yr · 1.5% tax · 5.0% vac · 8.0% maint · 8.0% mgmt
Financing live
Cash to close
- Down payment
- $53,250
- Closing costs
- $6,390
- Reserves months
- —
- Total cash needed
- —
Loan-product check · same deal, 3 products live
Conventional
25% down · 7.5% · 30yr
- Down + closing
- —
- Monthly P&I
- —
- Monthly cashflow
- —
- DSCR
- —
- Eligible?
- —
Personal DTI + credit; lowest rate.
DSCR
20% down · 8.5% · 30yr
- Down + closing
- —
- Monthly P&I
- —
- Monthly cashflow
- —
- DSCR
- —
- Eligible?
- —
No personal income docs; deal must DSCR.
Hard money
10% down · 12.0% · 12mo
- Down + closing
- —
- Monthly P&I
- —
- Monthly cashflow
- —
- DSCR
- —
- Eligible?
- —
Short-term bridge; refi at stabilization.
Rent comps 10 comps
| Address | Beds | Baths | Sqft | Rent | $/sqft | DOM | Units | Dist |
|---|---|---|---|---|---|---|---|---|
| 17226 Modbury St Spring, TX | 3.0 | 2.0 | 1640 | $1,889 | $1.15 | 43d | 1 | 0.42mi |
| 9131 Landry Blvd Spring, TX | 4.0 | 3.5 | 3156 | $2,681 | $0.85 | 7d | 1 | 0.49mi |
| 17615 Forest Haven Trl Tomball, TX | 4.0 | 2.5 | 2692 | $2,500 | $0.93 | 43d | 1 | 0.74mi |
| 16834 Scenic Gardens Dr Spring, TX | 3.0 | 2.5 | 1900 | $1,945 | $1.02 | 43d | 1 | 0.77mi |
| 9715 Haleys Comet Cir Tomball, TX | 3.0 | 3.0 | 2400 | $1,899 | $0.79 | 43d | 1 | 0.79mi |
| 9127 Cypress Square Dr Spring, TX | 4.0 | 2.0 | 1837 | $2,099 | $1.14 | 5d | 1 | 0.83mi |
| 9331 Charter Pine St Houston, TX | 4.0 | 2.0 | 1806 | $2,145 | $1.19 | 22d | 1 | 0.84mi |
| 9131 Durango Point Ln Houston, TX | 4.0 | 4.0 | 2989 | $2,650 | $0.89 | 43d | 1 | 0.93mi |
| 9738 Birdsnest Ct Spring, TX | 5.0 | 4.0 | 3006 | $3,400 | $1.13 | 19d | 1 | 1.14mi |
| 15500 Cutten Rd Houston, TX | 1.0–3.0 | 1.0–3.0 | 1422 | $2,790 | $1.96 | 2d | 29 | 1.19mi |
HOA detail
- Monthly dues
- $29 · $348/yr
Listing history 16 events
-
2026-06-18days on market $213,000 Active 57 DOM
-
2026-06-17days on market $213,000 Active 56 DOM
-
2026-06-16days on market $213,000 Active 55 DOM
-
2026-06-15days on market $213,000 Active 54 DOM
-
2026-06-13days on market $213,000 Active 52 DOM
-
2026-06-09days on market $213,000 Active 48 DOM
-
2026-06-08days on market $213,000 Active 47 DOM
-
2026-06-07pricedays on market $213,000 Active 46 DOM
-
2026-06-04days on market $218,000 Active 43 DOM
-
2026-06-03days on market $218,000 Active 42 DOM
-
2026-06-02days on market $218,000 Active 41 DOM
-
2026-06-01days on market $218,000 Active 40 DOM
-
2026-05-31days on market $218,000 Active 39 DOM
-
2026-05-08price $218,000 587-char remark
Show marketing remark (587 chars)
Nestled in a charming, established neighborhood in Spring, this home at 9634 Dornoch Dr offers a fantastic opportunity to create something truly special. With great bones and a functional layout, this property is ready for your personal touch and updates. Ideal for investors or buyers looking to customize their dream home, the spacious lot and inviting setting provide the perfect canvas for renovation. Enjoy the quiet streets, mature trees, and convenient access to nearby shopping, dining, and major roadways. Bring your vision and unlock the potential this hidden gem has to offer!
-
2026-04-22$225,000 Active 587-char remark
Show marketing remark (587 chars)
Nestled in a charming, established neighborhood in Spring, this home at 9634 Dornoch Dr offers a fantastic opportunity to create something truly special. With great bones and a functional layout, this property is ready for your personal touch and updates. Ideal for investors or buyers looking to customize their dream home, the spacious lot and inviting setting provide the perfect canvas for renovation. Enjoy the quiet streets, mature trees, and convenient access to nearby shopping, dining, and major roadways. Bring your vision and unlock the potential this hidden gem has to offer!
-
1988-01-02soldstatus
ⓘ Source: listings_history table (triggers on properties + properties_extension) + one-shot
backfill from property_details.listing_events for pre-trigger history.
Tax reassessment forecast TX · Resets to sale price
- Current annual tax
- $5,565 · $464/mo
- Projected year-2 tax
- $5,565 · $464/mo
- Expected delta
- $0/yr ($0/mo · 0.0%)
ⓘ Screening estimate from a state-policy table — verify with the county assessor before closing.
Climate risk First Street
- Flood 1/10 Low FEMA zone X (unshaded) · 0% chance over 30 yrs
- Wildfire 1/10 Low
- Heat 9/10 Extreme 7 d/yr ≥111°F today · 23 d/yr by 30 yrs out
- Wind 9/10 Extreme 99% chance of damaging wind over 30 yrs
- Air quality 3/10 Moderate 2 unhealthy d/yr today · 3 by 30 yrs out
Nearby sold comps map
Loading sold comps map…
Walkable amenities ~0.75 mi
Loading nearby amenities…
Taxation est. · year 1
- Rental income
- $27,801
- − Mortgage interest
- −$11,931
- − Property taxes
- −$5,565
- − Insurance
- −$1,065
- − Repairs & maintenance
- −$2,224
- − Management
- −$2,224
- − HOA
- −$348
- − Depreciation
- −$6,196
- Taxable loss
- −$1,752
- Est. tax savings @ 24.0%
- +$421
- After-tax cash flow
- $2,002/yr
For passive investors: Depreciation is non-cash, so a rental often shows a tax loss while cash-flowing — sheltering income. Rental losses are passive: they offset passive income freely, and up to $25,000/yr can offset ordinary (W-2) income if you actively participate and your MAGI is under $100k (phasing out to $0 by $150k); unused losses carry forward. On sale, claimed depreciation is recaptured at up to 25%, and gains may owe capital-gains tax (a 1031 exchange can defer both). Figures are a year-1 estimate at your 24.0% rate — not tax advice; consult a CPA.
Schools (NCES district)
- District
- Klein ISD
- NCES district ID
- 4825740
- Math proficiency
- 41% ▼ -12.00%
- Reading proficiency
- 48% ▼ -3.00%
- Median HH income
- $78,288
- Composite
- 40.91/100
- National rank
- #3615
- State rank
- #213 of 826 in TX
Livability — Houston
- Score
- 74/100
- State rank
- #184
- US rank
- #4771
Category grades
Schools grade is shown separately in the Schools card above.
Census & demographics
- County
- Harris County · 4,702,590 people
- City population
- 3,226,434
- Metro
- Houston-The Woodlands-Sugar Land, TX
- Population (ZIP)
- 85,190
- Household income
- $107,486
- Rent vs Own
- Severe rent burden
- 2220.0
Population outlook (Harris County) Hauer SSP2
- Today (2025)
- 5,571,493 people
- By 2030
- 6,089,821 · +9.3%
- By 2040
- 7,142,806 · +28.2%
- By 2050
- 8,185,864 · +46.9%
- By 2075
- 10,574,329 · +89.8%
- By 2100
- 12,109,958 · +117.4%
Race, ethnicity, and origin ACS 2023
- Neighborhood character
- Diverse neighborhood (Simpson 0.68)
- Race & ethnicity
- White 49% Hispanic / Latino 24% Two or more races 15% Black 11% Asian 11%
- Hispanic origin (detail)
- Mexican 13% Puerto Rican 1% Cuban 1%
- Common ancestry
- Italian 2% Lithuanian 2% Slovak 2%
- Foreign-born
- 19% · Canada, Vietnam, China
- Languages at home
- 71% English-only · Spanish 16% Other Indo-European 5% Other Asian/Pacific 1%
Political lean MEDSL · Harris
- 2024 margin
- Lean D (+5.5) · D 52.0% · R 46.4% · Other 1.6%
- 2008→2024 swing
- +3.9pp toward D · 2008: 1.6pp · 2024: 5.5pp
- All cycles
- 2024: D+5.5 2020: D+13.3 2016: D+12.4 2012: D+0.1 2008: D+1.6
Not yet ingested
- Civics
- —
Market trends
- HPI YoY
- ▼ -116.58%
- Current HPI
- 218.9608
- Rent YoY
- ▼ -1.95%
- Metro
- Houston-The Woodlands-Sugar Land, TX
- State GDP YoY
- ▲ 3.95%
- F500 in state
- 110
Industry mix (Fortune 500 HQ in TX)
| Industry | F500 HQs | Revenue |
|---|---|---|
| Energy | 16 | $1,198B |
|
||
| Technology | 5 | $198B |
|
||
| Engineering / Construction | 4 | $72B |
|
||
| Energy Services | 3 | $60B |
|
||
| Utilities | 3 | $41B |
|
||
| Healthcare | 2 | $330B |
|
||
Price history
-3.1% since first listed3 events — show timeline
- 2026-05-08 Price Changed $218,000 HARMLS
- 2026-04-22 Listed $225,000 HARMLS
- 1988-01-02 Sold (Public Records) — Public Records
Property tax history
+3.1%/yrLatest (2025): $5,565 · +2.5% YoY. Source: county tax records.
Cash-flow waterfall
monthlySold comps — $/sqft
last 12 mo · ≤1 miLoading sold comps…