 Multi-family
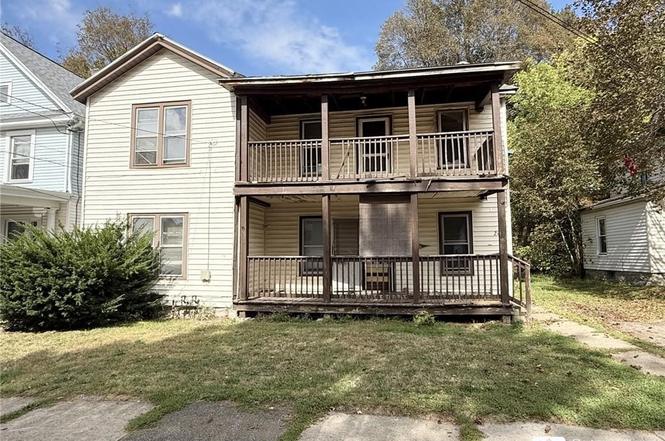
28 W 9th St · Jamestown, NY
Flood risk 1/10 · Minimal
- FEMA flood zone
- X
- Chance of flooding over 30 yrs
- 0.0%
- Est. flood insurance / yr
- $473 – $860
Fire risk 1/10 · Minimal
- Est. fire insurance / yr
- $691 – $1,283
Heat risk 2/10 · Minimal
- Hot days now (above 91°F)
- 7 days/yr
- Hot days in 30 yrs
- 17 days/yr
Wind risk 1/10 · Minimal
- Chance of severe wind over 30 yrs
- —
Air-quality risk 2/10 · Minimal
- Unhealthy air days now
- 0 days/yr
- Unhealthy air days in 30 yrs
- 1 days/yr
Risk factors via First Street. Map © Google.
Why this score? — see what drove the D grade
The composite is a weighted blend of 9 inputs, each scored 0–100. Each bar is that input's sub-score; the figure is the points it added to the 100-point composite (weight × sub-score).
- Cash flow +15.0/30.0
- ARV discount +7.5/15.0
- 1% rule +5.0/10.0
- DSCR +5.0/10.0
- Livability +3.5/5.0
- Schools +3.1/10.0
- Rent growth +2.5/5.0
- Condition / age +2.5/5.0
- Appreciation +0.0/10.0
$20,000
🖨 Deal sheet (PDF) 📄 Offer letter ✓ Due diligence
Multi-family units
County records classify this as Multi-Family (2-4 Unit). Listing-text estimate: 1 unit. estimate disagrees with records
Listing remarks
Priced to sell two unit. Lower unit is a 1 bed 1 bath and the upper is a 2 bedroom 1 bath. The downstairs unit needs a new forced air furnace. The house could also very easily be converted back to a single family home.
Key facts
- 5,445 sq ft lot
- 2 parking spots
- Built 1885
Neighborhood map
What this means for you Summary
Snapshot
- This is a 3-bed/2.0-bath multifamily listed at $20k.
Deal economics
- At list price, monthly cash flow is $915 ($11k/yr) — positive.
- The deal already cash-flows at list — no discount required.
- Meets the 1% rule at list price ($1k rent vs $20k).
- Cap rate 61.2% vs local median 16.8% in Jamestown — top-decile yield for the area; either an underpriced asset or a hidden risk that comps aren't pricing in. Stress-test before assuming the spread holds.
Location & tenants
- Location reads 69/100 on livability (#470 in NY) — a middle-class / working-renter tenant base. Strengths: cost of living A+, housing A+, health & safety A+; Watch: schools C-, amenities D, crime F.
- Jamestown City School District (town): math 33% / reading 42% proficiency, ranked #553 of 590 in NY (top 94%) — families likely to look elsewhere, expect single-tenant / working-renter base with shorter leases.
- Market conditions: 315 active listings in the ZIP; 1 comparable units currently listed for rent nearby; 127 units permitted in Chautauqua County in 2024 (0 in 5+ unit buildings).
- This rent runs 32% of the median local income ($50k/yr) — at the standard rent-burdened threshold; future hikes will face affordability resistance.
Forward outlook
- Local home prices are declining (-3.0%/yr); year-one equity from $138 of loan paydown is wiped out by about $600 of value loss. Plan a longer hold.
- Chautauqua County population projected at -22% by 2050 — secular population decline; favor cash flow + early exit over multi-decade hold.
- At projected returns (-3.0% appreciation + 3.0% rent growth), your $6k cash investment doubles in ~1 year — after that, you're playing with house money.
Negotiation context
- Only 1 days on market — expect competitive offers; lowballing is unlikely to land.
- 2 sale attempts with the ask held roughly flat each time — persistent listings suggest the price (not the market) is what's stuck; bring a comps-based counter.
Risks & watch-outs
- Watch-outs: built in 1885 — expect roof / HVAC / electrical / plumbing capex.
Questions for the listing agent
- Built in 1885 — when were the roof, HVAC, electrical panel, plumbing, and water heater last replaced?
- Is there a deadline driving the sale (1031 exchange, divorce, estate, relocation)? That informs how much negotiation room exists.
- Crime grade is F in this area — have there been break-ins, vandalism, or insurance claims at this property in the last 3 years? What carrier currently insures it and at what premium?
- The area grade is low — what's the realistic commute time and amenity access for the typical tenant pool here? Any planned neighborhood developments (good or bad) we should know about?
- What's the average days-on-market for RENTAL listings here right now (not sales)? A rising rental-DOM trend means longer vacancies and softer asking-rent achievability than the comps imply.
- What's the recent tenant-quality profile in this submarket — average credit score on applications, eviction rate, late-payment / NSF rate, and stable-employment percentage? A property-management company in the area should have these aggregated.
- How much new apartment / multifamily construction is in the pipeline within 1–3 miles? Heavy new supply (>2% of stock underway) typically softens rents 12–24 months out; light construction supports rent growth.
Investment metrics
- 1% rule
- 6.67% ✓
- Cap rate
- 61.21%
- Cash-on-cash
- 196.11%
- DSCR
- 9.73
- GRM
- 1.2
CMA / ARV
- ARV (on-the-fly)
- $63,360
- Comps found
- 11
Show comp detail 11 sales within ~0.75 mi
| Address | Dist | Beds/Ba | Sqft | Sold | Price | $/sf | Match |
|---|---|---|---|---|---|---|---|
| 7 Valley St | 0.08mi | 4/2.0 (+1) | 2,054 (+7%) | 10mo | $67,000 | $33 | 71 |
| 245 Fulton St | 0.26mi | 4/2.0 (+1) | 2,118 (+10%) | 2mo | $47,000 | $22 | 64 |
| 31 Falconer St | 0.42mi | 4/2.0 (+1) | 1,860 (-3%) | 8mo | $109,000 | $59 | 63 |
| 120 Price St | 0.36mi | 4/2.0 (+1) | 1,883 (-2%) | 16mo | $65,500 | $35 | 61 |
| 423 Lincoln St | 0.43mi | 3/2.0 | 1,661 (-14%) | 5mo | $53,000 | $32 | 54 |
| 435 Crossman St | 0.59mi | 4/2.0 (+1) | 1,882 (-2%) | 16mo | $115,000 | $61 | 51 |
| 416 W 6th St | 0.37mi | 4/2.0 (+1) | 2,149 (+12%) | 12mo | $57,000 | $27 | 48 |
| 5 Sturges St | 0.60mi | 4/2.0 (+1) | 1,892 (-2%) | 23mo | $52,000 | $27 | 45 |
| 317 Van Buren St | 0.55mi | 4/2.0 (+1) | 1,830 (-5%) | 20mo | $67,000 | $37 | 44 |
| 84 Sturges St | 0.68mi | 4/2.0 (+1) | 1,980 (+3%) | 17mo | $74,400 | $38 | 44 |
| 612 Monroe St | 0.41mi | 4/3.0 (+1) | 2,144 (+12%) | 15mo | $41,000 | $19 | 40 |
Match score weights: distance 35% · size 25% · config 20% · recency 20%. Top-matched comps best support the ARV.
Projected returns pro-forma
-3.0% appreciation · 3.0% rent growth · sell at horizon
- IRR
- —
- Equity multiple
- 10.83×
- Total profit
- $55,069
- Equity at exit
- $2,982
- IRR
- —
- Equity multiple
- 22.98×
- Total profit
- $123,092
- Equity at exit
- $1,729
Cash invested: $5,600 (down + closing). Projections, not guarantees.
Landlord ↔ Tenant lean methodology
- Overall (STATE)
- 15 Strongly Tenant-Friendly
- State New York
- 15 Strongly Tenant-Friendly · D+10
- County
- — inherits STATE
- City
- — inherits STATE
ZIP-level market 14701
- Home prices YoY
- -18.5%
- Active inventory
- 315
- Price-to-rent
- 1.2×
Monthly cashflow live
- Estimated rent
- $1,333 medium interval (Pro) →
- Mortgage (P&I)
- −$105
- Tax est. 1.5%
- −$25 /mo · $300/yr
- Insurance
- −$8
- HOA
- −$0
- Vacancy / Maint / Mgmt
- −$280
- Net cashflow
- $915
Break-even live
Sensitivity live
| Price | -10% $929 | -5% $922 | +0% $915 | +5% $908 | +10% $901 |
|---|---|---|---|---|---|
| Rent | -10% $810 | -5% $863 | +0% $915 | +5% $968 | +10% $1,021 |
| Rate | -1.0pp $925 | -0.5pp $920 | base $915 | +0.5pp $910 | +1.0pp $905 |
UW: 25.0% down · 7.5% · 30yr · 1.5% tax · 5.0% vac · 8.0% maint · 8.0% mgmt
Financing live
Cash to close
- Down payment
- $5,000
- Closing costs
- $600
- Reserves months
- —
- Total cash needed
- —
Loan-product check · same deal, 3 products live
Conventional
25% down · 7.5% · 30yr
- Down + closing
- —
- Monthly P&I
- —
- Monthly cashflow
- —
- DSCR
- —
- Eligible?
- —
Personal DTI + credit; lowest rate.
DSCR
20% down · 8.5% · 30yr
- Down + closing
- —
- Monthly P&I
- —
- Monthly cashflow
- —
- DSCR
- —
- Eligible?
- —
No personal income docs; deal must DSCR.
Hard money
10% down · 12.0% · 12mo
- Down + closing
- —
- Monthly P&I
- —
- Monthly cashflow
- —
- DSCR
- —
- Eligible?
- —
Short-term bridge; refi at stabilization.
Rent comps 1 comps
| Address | Beds | Baths | Sqft | Rent | $/sqft | DOM | Units | Dist |
|---|---|---|---|---|---|---|---|---|
| 148 Maple St Jamestown, NY | 3.0 | 1.0 | 1424 | $1,350 | $0.95 | 45d | 1 | 1.19mi |
Listing history 8 events
-
2026-01-28status Pending
-
2026-01-27$20,000 Active
-
2025-12-31historical
-
2025-11-19price $34,998
-
2025-11-03price $34,999
-
2025-09-24price $36,500
-
2025-07-14price $39,900
-
2025-06-17$42,500 Active
ⓘ Source: listings_history table (triggers on properties + properties_extension) + one-shot
backfill from property_details.listing_events for pre-trigger history.
Climate risk First Street
- Flood 1/10 Low FEMA zone X · 0% chance over 30 yrs
- Wildfire 1/10 Low
- Heat 2/10 Low 7 d/yr ≥91°F today · 17 d/yr by 30 yrs out
- Wind 1/10 Low
- Air quality 2/10 Low 0 unhealthy d/yr today · 1 by 30 yrs out
Nearby sold comps map
Loading sold comps map…
Walkable amenities ~0.75 mi
Loading nearby amenities…
Taxation est. · year 1
- Rental income
- $16,001
- − Mortgage interest
- −$1,120
- − Property taxes
- −$300
- − Insurance
- −$100
- − Repairs & maintenance
- −$1,280
- − Management
- −$1,280
- − Depreciation
- −$582
- Taxable income
- $11,339
- Est. tax owed @ 24.0%
- −$2,721
- After-tax cash flow
- $8,261/yr
For passive investors: Depreciation is non-cash, so a rental often shows a tax loss while cash-flowing — sheltering income. Rental losses are passive: they offset passive income freely, and up to $25,000/yr can offset ordinary (W-2) income if you actively participate and your MAGI is under $100k (phasing out to $0 by $150k); unused losses carry forward. On sale, claimed depreciation is recaptured at up to 25%, and gains may owe capital-gains tax (a 1031 exchange can defer both). Figures are a year-1 estimate at your 24.0% rate — not tax advice; consult a CPA.
Schools (NCES district)
- District
- Jamestown City School District
- NCES district ID
- 3615630
- Math proficiency
- 33% ▼ -3.00%
- Reading proficiency
- 42% ▲ 5.00%
- Median HH income
- $32,240
- Composite
- 30.69/100
- National rank
- #6176
- State rank
- #553 of 590 in NY
Livability — Jamestown
- Score
- 69/100
- State rank
- #470
- US rank
- #8213
Category grades
Schools grade is shown separately in the Schools card above.
Census & demographics
- Census place
- Jamestown, NY
- County
- Chautauqua County · 38,461 people
- City population
- 38,461
- Metro
- Jamestown-Dunkirk-Fredonia, NY
- Population (ZIP)
- 38,461
- Household income
- $49,685
- Rent vs Own
- Severe rent burden
- 1838.0
Population outlook (Chautauqua County) Hauer SSP2
- Today (2025)
- 123,454 people
- By 2030
- 118,509 · -4.0%
- By 2040
- 107,311 · -13.1%
- By 2050
- 96,703 · -21.7%
- By 2075
- 76,757 · -37.8%
- By 2100
- 60,984 · -50.6%
Race, ethnicity, and origin ACS 2023
- Neighborhood character
- Predominantly White (82%)
- Race & ethnicity
- White 82% Hispanic / Latino 11% Two or more races 6% Black 3%
- Hispanic origin (detail)
- Puerto Rican 8%
- Common ancestry
- Romanian 6% Lithuanian 2% Slovak 2%
- Foreign-born
- 3% · Canada
- Languages at home
- 92% English-only · Spanish 6% Other Indo-European 1% French/Haitian/Cajun 1%
Political lean MEDSL · Chautauqua
- 2024 margin
- Strong R (+22.0) · D 39.0% · R 61.0%
- 2008→2024 swing
- -22.9pp toward R · 2008: 0.9pp · 2024: -22.0pp
- All cycles
- 2024: R+22.0 2020: R+19.8 2016: R+24.6 2012: R+8.2 2008: D+0.9
Not yet ingested
- Civics
- —
Market trends
- HPI YoY
- ▼ -58.93%
- Current HPI
- 259.402
- Rent YoY
- —
- Metro
- Jamestown-Dunkirk-Fredonia, NY
- State GDP YoY
- ▲ 2.60%
- F500 in state
- 92
Industry mix (Fortune 500 HQ in NY)
| Industry | F500 HQs | Revenue |
|---|---|---|
| Financial Services | 10 | $950B |
|
||
| Consumer Goods | 9 | $162B |
|
||
| Insurance | 4 | $225B |
|
||
| Telecommunications | 2 | $144B |
|
||
| Pharmaceuticals | 2 | $112B |
|
||
| Media / Entertainment | 2 | $69B |
|
||
Price history
-52.9% since first listed8 events — show timeline
- 2026-01-28 Pending — UNYREIS
- 2026-01-27 Listed $20,000 UNYREIS
- 2025-12-31 Listing Removed — UNYREIS
- 2025-11-19 Price Changed $34,998 UNYREIS
- 2025-11-03 Price Changed $34,999 UNYREIS
- 2025-09-24 Price Changed $36,500 UNYREIS
- 2025-07-14 Price Changed $39,900 UNYREIS
- 2025-06-17 Listed $42,500 UNYREIS
Property tax history
-4.3%/yrLatest (2025): $1,316 · +4.8% YoY. Source: county tax records.
Cash-flow waterfall
monthlySold comps — $/sqft
last 12 mo · ≤1 miLoading sold comps…