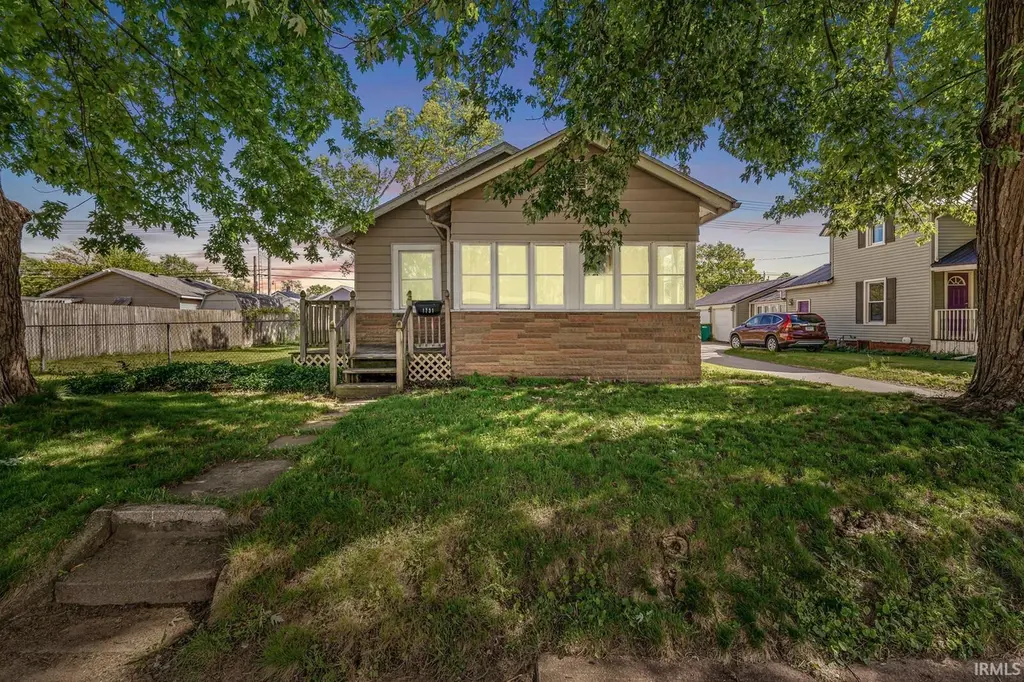
1731 Homewood Ave · Mishawaka, IN
Flood risk 1/10 · Minimal
- FEMA flood zone
- X (unshaded)
- Chance of flooding over 30 yrs
- 0.0%
- Est. flood insurance / yr
- $473 – $860
Fire risk 1/10 · Minimal
- Est. fire insurance / yr
- $717 – $1,331
Heat risk 3/10 · Minor
- Hot days now (above 100°F)
- 7 days/yr
- Hot days in 30 yrs
- 16 days/yr
Wind risk 2/10 · Minimal
- Chance of severe wind over 30 yrs
- —
Air-quality risk 3/10 · Minor
- Unhealthy air days now
- 2 days/yr
- Unhealthy air days in 30 yrs
- 3 days/yr
Risk factors via First Street. Map © Google.
Why this score? — see what drove the D grade
The composite is a weighted blend of 9 inputs, each scored 0–100. Each bar is that input's sub-score; the figure is the points it added to the 100-point composite (weight × sub-score).
- Cash flow +12.5/30.0
- ARV discount +9.0/15.0
- Rent growth +4.8/5.0
- Livability +3.8/5.0
- DSCR +3.7/10.0
- 1% rule +2.8/10.0
- Condition / age +2.5/5.0
- Schools +2.2/10.0
- Appreciation +0.0/10.0
$150,000
🖨 Deal sheet 📄 Offer letter ✓ Due diligence
Listing remarks MLS
Highest and Best due by 12 pm on Saturday, 5/21. You do not want to miss this adorable 2 bedroom, 1 bath home with newly updated flooring and paint throughout in Mishawaka! Walking distance to elementary and high school. Close to river area parks and recreation. Main floor laundry, with extra storage or pantry space. Chain link fence surrounds the oversized yard for playing or pets, along with large concrete patio for entertaining and an enclosed front porch for lemonade sipping as you watch the cars go by! Schedule your showing today, this will not last long!
Key facts
- Alley access
- Full-size basement
- Updated home
Tags
Property features AI
Finance
- Other: Lot dimensions approximately 66 x 114 (0.1727 acres)
- HOA & community: No association amenities
Exterior
- Parking: Gravel parking
- Utilities: Public water; Public sewer
- Home design: Single-family residence (site-built); One story
- Construction: Aluminum siding; Block foundation; Shingle roof; Built as a site-built home
- Exterior features: Enclosed porch; Porch; Chain link fencing; Level lot
Interior
- Kitchen: Dishwasher; Refrigerator; Electric range
- Bedrooms: Master bedroom located on the main level
- Flooring: Vinyl flooring
- Bathrooms: One full bathroom (main level)
- Heating & cooling: Central air conditioning; Ceiling fan(s); Natural gas forced-air heating
- Interior features: Ceiling fans throughout; Master bedroom on the main level; Full basement
- Laundry & utility: Washer hookup on main level; Electric dryer hookup on main level; Electric water heater
Neighborhood map
What this means for you Summary
Snapshot
- This is a 2-bed/1.0-bath single-family listed at $150k.
Deal economics
- At list price, monthly cash flow is $-23 ($-274/yr) — negative.
- To cash-flow at today's rent, offer at most $146k (2.7% below list).
- To meet the 1% rule (rent ≥ 1% of price), the offer needs to be $116k (22.5% below list).
- Recommended offer: $116k (22.5% below list) — sets the bar for 1% rule.
Location & tenants
- Location reads 76/100 on livability (#53 in IN, #3,586 nationally) — a middle-class / working-renter tenant base. Strengths: cost of living A+, housing A+, health & safety B; Watch: amenities F, employment F.
- School City Of Mishawaka (urban): math 23% / reading 30% proficiency, ranked #260 of 301 in IN (top 86%) — low school quality limits family demand, transient renter base, plan for 1-2y turnover.
- Zoned schools: Beiger Elementary School (math 30% / reading 28%, grade F, #725 of 994 statewide, top 73%, 546 students, 67% FRL); John J Young Middle School (math 17% / reading 30%, grade F, #257 of 330 statewide, top 79%, 735 students, 74% FRL); Mishawaka High School (math 24% / reading 60%, grade F, #197 of 369 statewide, top 57%, 1,488 students, 65% FRL).
- Market conditions: Rents rising fast (+9.1%/yr); 140 active listings in the ZIP; 754 units permitted in St. Joseph County in 2024 (460 in 5+ unit buildings).
Forward outlook
- Local home prices are declining (-3.0%/yr); year-one equity from $1k of loan paydown is wiped out by about $4k of value loss. Plan a longer hold.
Negotiation context
- Only 5 days on market — expect competitive offers; lowballing is unlikely to land.
- 4 sale attempts since 12y ago with the ask held roughly flat each time — persistent listings suggest the price (not the market) is what's stuck; bring a comps-based counter.
- Current owner paid $125k; 20% above their basis — modest negotiation headroom, anchor on the comps not their cost.
Risks & watch-outs
- Watch-outs: built in 1929 — expect roof / HVAC / electrical / plumbing capex.
Questions for the listing agent
- What do current leases actually rent for vs. the listed asking? Can we see a recent rent roll and the last 12 months of T-12 income?
- Built in 1929 — when were the roof, HVAC, electrical panel, plumbing, and water heater last replaced?
- Is there a deadline driving the sale (1031 exchange, divorce, estate, relocation)? That informs how much negotiation room exists.
- The area grade is low — what's the realistic commute time and amenity access for the typical tenant pool here? Any planned neighborhood developments (good or bad) we should know about?
- What's the average days-on-market for RENTAL listings here right now (not sales)? A rising rental-DOM trend means longer vacancies and softer asking-rent achievability than the comps imply.
- What's the recent tenant-quality profile in this submarket — average credit score on applications, eviction rate, late-payment / NSF rate, and stable-employment percentage? A property-management company in the area should have these aggregated.
- How much new for-sale + rental construction is in the pipeline within 1–3 miles? Heavy new supply typically softens prices + rents 12–24 months out; constrained supply supports both.
Investment metrics
- 1% rule
- 0.78% ✗
- Cap rate
- 6.11%
- Cash-on-cash
- -0.65%
- DSCR
- 0.97
- GRM
- 10.7
CMA / ARV
- ARV (median comp)
- $155,186
- List price
- $150,000
- Delta
- -3.34%
- Verdict
- FAIR
- Comps
- 20 within 1.0 mi
Show comp detail 12 sales within ~0.75 mi
| Address | Dist | Beds/Ba | Sqft | Sold | Price | $/sf | Match |
|---|---|---|---|---|---|---|---|
| 1750 Homewood Ave | 0.05mi | 2/1.0 | 660 (-9%) | 11mo | $135,000 | $205 | 73 |
| 1508 E 4th St | 0.36mi | 2/1.0 | 780 (+7%) | 3mo | $150,000 | $192 | 69 |
| 1617 E 4th St | 0.27mi | 2/1.0 | 804 (+11%) | 7mo | $80,500 | $100 | 64 |
| 2125 Linden St | 0.30mi | 3/1.0 (+1) | 768 (+6%) | 12mo | $131,000 | $171 | 61 |
| 2022 Lincolnway E | 0.23mi | 2/2.0 | 800 (+10%) | 10mo | $132,000 | $165 | 60 |
| 405 Gernhart Ave | 0.56mi | 2/1.0 | 768 (+6%) | 17mo | $172,000 | $224 | 50 |
| 213 N State St | 0.50mi | 2/1.0 | 792 (+9%) | 15mo | $169,000 | $213 | 49 |
| 332 S Brook Ave | 0.54mi | 2/1.0 | 672 (-7%) | 20mo | $120,000 | $179 | 46 |
| 630 Studebaker St | 0.68mi | 2/1.0 | 660 (-9%) | 12mo | $167,500 | $254 | 43 |
| 1118 E 4th St | 0.72mi | 2/1.0 | 780 (+7%) | 18mo | $87,630 | $112 | 38 |
| 411 N Wenger Ave | 0.73mi | 2/1.0 | 804 (+11%) | 12mo | $160,000 | $199 | 38 |
| 1311 E 7th St | 0.72mi | 2/1.0 | 625 (-14%) | 14mo | $70,000 | $112 | 32 |
Match score weights: distance 35% · size 25% · config 20% · recency 20%. Top-matched comps best support the ARV.
Projected returns pro-forma
-3.0% appreciation · 8.0% rent growth · sell at horizon
- IRR
- -12.4%
- Equity multiple
- 0.53×
- Total profit
- $-19,657
- Equity at exit
- $22,365
- IRR
- 2.4%
- Equity multiple
- 1.21×
- Total profit
- $8,813
- Equity at exit
- $12,969
Cash invested: $42,000 (down + closing). Projections, not guarantees.
Landlord ↔ Tenant lean methodology
- Overall (STATE)
- 90 Strongly Landlord-Friendly
- State Indiana
- 90 Strongly Landlord-Friendly · R+11
- County
- — inherits STATE
- City
- — inherits STATE
ZIP-level market 46544
- Rents YoY
- 9.1%
- Active inventory
- 140
- Price-to-rent
- 10.7×
Monthly cashflow live
- Estimated rent
- $1,163 medium interval (Pro) →
- Mortgage (P&I)
- −$787
- Tax from tax record
- −$92 /mo · $1,108/yr
- Insurance
- −$62
- HOA
- −$0
- Vacancy / Maint / Mgmt
- −$244
- Net cashflow
- $-23
Break-even live
UW: 25.0% down · 7.5% · 30yr · 1.5% tax · 5.0% vac · 8.0% maint · 8.0% mgmt
Financing live
Cash to close
- Down payment
- $37,500
- Closing costs
- $4,500
- Reserves months
- —
- Total cash needed
- —
Loan-product check · same deal, 3 products live
Conventional
25% down · 7.5% · 30yr
- Down + closing
- —
- Monthly P&I
- —
- Monthly cashflow
- —
- DSCR
- —
- Eligible?
- —
Personal DTI + credit; lowest rate.
DSCR
20% down · 8.5% · 30yr
- Down + closing
- —
- Monthly P&I
- —
- Monthly cashflow
- —
- DSCR
- —
- Eligible?
- —
No personal income docs; deal must DSCR.
Hard money
10% down · 12.0% · 12mo
- Down + closing
- —
- Monthly P&I
- —
- Monthly cashflow
- —
- DSCR
- —
- Eligible?
- —
Short-term bridge; refi at stabilization.
Listing history 7 events
-
2026-05-13$150,000 Active 736-char remark
-
2022-06-13soldstatus $125,000 568-char remark
Show marketing remark (568 chars)
Highest and Best due by 12 pm on Saturday, 5/21. You do not want to miss this adorable 2 bedroom, 1 bath home with newly updated flooring and paint throughout in Mishawaka! Walking distance to elementary and high school. Close to river area parks and recreation. Main floor laundry, with extra storage or pantry space. Chain link fence surrounds the oversized yard for playing or pets, along with large concrete patio for entertaining and an enclosed front porch for lemonade sipping as you watch the cars go by! Schedule your showing today, this will not last long!
-
2022-05-19$115,000 568-char remark
Show marketing remark (568 chars)
Highest and Best due by 12 pm on Saturday, 5/21. You do not want to miss this adorable 2 bedroom, 1 bath home with newly updated flooring and paint throughout in Mishawaka! Walking distance to elementary and high school. Close to river area parks and recreation. Main floor laundry, with extra storage or pantry space. Chain link fence surrounds the oversized yard for playing or pets, along with large concrete patio for entertaining and an enclosed front porch for lemonade sipping as you watch the cars go by! Schedule your showing today, this will not last long!
-
2017-01-27soldstatus $48,000
Show marketing remark (354 chars)
The Price is Right! Sweet home with new paint and flooring. New kitchen. Basement has drywall - just add flooring and ceiling & it's your ManCave! Located close to Beiger Elementary and the river area parks and recreation areas. Fenced back yard. Alley access on two sides and a side yard ideal for a quick game of catch. Call & see it today.
-
2016-08-27$49,900
Show marketing remark (354 chars)
The Price is Right! Sweet home with new paint and flooring. New kitchen. Basement has drywall - just add flooring and ceiling & it's your ManCave! Located close to Beiger Elementary and the river area parks and recreation areas. Fenced back yard. Alley access on two sides and a side yard ideal for a quick game of catch. Call & see it today.
-
2015-02-23soldstatus $24,000
-
2014-05-07$24,900
ⓘ Source: listings_history table (triggers on properties + properties_extension) + one-shot
backfill from property_details.listing_events for pre-trigger history.
Tax reassessment forecast IN · Partial reset (capped growth)
- Current annual tax
- $1,108 · $92/mo
- Projected year-2 tax
- $1,192 · $99/mo
- Expected delta
- +$83/yr (+$7/mo · 7.5%)
ⓘ Screening estimate from a state-policy table — verify with the county assessor before closing.
Climate risk First Street
- Flood 1/10 Low FEMA zone X (unshaded) · 0% chance over 30 yrs
- Wildfire 1/10 Low
- Heat 3/10 Moderate 7 d/yr ≥100°F today · 16 d/yr by 30 yrs out
- Wind 2/10 Low
- Air quality 3/10 Moderate 2 unhealthy d/yr today · 3 by 30 yrs out
Nearby sold comps map
Loading sold comps map…
Walkable amenities ~0.75 mi
Loading nearby amenities…
Taxation est. · year 1
- Rental income
- $13,954
- − Mortgage interest
- −$8,402
- − Property taxes
- −$1,108
- − Insurance
- −$750
- − Repairs & maintenance
- −$1,116
- − Management
- −$1,116
- − Depreciation
- −$4,364
- Taxable loss
- −$2,903
- Est. tax savings @ 24.0%
- +$697
- After-tax cash flow
- $423/yr
For passive investors: Depreciation is non-cash, so a rental often shows a tax loss while cash-flowing — sheltering income. Rental losses are passive: they offset passive income freely, and up to $25,000/yr can offset ordinary (W-2) income if you actively participate and your MAGI is under $100k (phasing out to $0 by $150k); unused losses carry forward. On sale, claimed depreciation is recaptured at up to 25%, and gains may owe capital-gains tax (a 1031 exchange can defer both). Figures are a year-1 estimate at your 24.0% rate — not tax advice; consult a CPA.
Schools (NCES district)
- District
- School City Of Mishawaka
- NCES district ID
- 1806840
- Math proficiency
- 23% ▼ -9.00%
- Reading proficiency
- 30% ▼ -7.00%
- Median HH income
- $39,290
- Composite
- 22.26/100
- National rank
- #8143
- State rank
- #260 of 301 in IN
Livability — Mishawaka
- Score
- 76/100
- State rank
- #53
- US rank
- #3586
Category grades
Schools grade is shown separately in the Schools card above.
Census & demographics
- Census place
- Mishawaka, IN
- County
- Saint Joseph County · 189,048 people
- City population
- 57,683
- Metro
- South Bend-Mishawaka, IN-MI
- Population (ZIP)
- 31,077
- Household income
- $58,829
- Rent vs Own
- Severe rent burden
- 685.0
Population outlook (St. Joseph County) Hauer SSP2
- Today (2025)
- 273,186 people
- By 2030
- 273,594 · +0.1%
- By 2040
- 271,641 · -0.6%
- By 2050
- 269,187 · -1.5%
- By 2075
- 263,136 · -3.7%
- By 2100
- 245,659 · -10.1%
Race, ethnicity, and origin ACS 2023
- Neighborhood character
- Predominantly White (79%)
- Race & ethnicity
- White 79% Black 9% Two or more races 7% Hispanic / Latino 6% Asian 1%
- Hispanic origin (detail)
- Mexican 5%
- Common ancestry
- Romanian 7% English 3% Lithuanian 2%
- Foreign-born
- 4% · Canada, Vietnam
- Languages at home
- 94% English-only · Spanish 3%
Political lean MEDSL · St. Joseph
- 2024 margin
- Toss-up / Even · D 50.0% · R 48.5% · Other 1.5%
- 2008→2024 swing
- -15.6pp toward R · 2008: 17.1pp · 2024: 1.5pp
- All cycles
- 2024: D+1.5 2020: D+5.8 2016: D+0.2 2012: D+3.5 2008: D+17.1
Not yet ingested
- Civics
- —
Market trends
- HPI YoY
- ▼ -116.74%
- Current HPI
- 188.9996
- Rent YoY
- ▲ 9.10%
- Metro
- South Bend-Mishawaka, IN-MI
- State GDP YoY
- ▲ 2.90%
- F500 in state
- 18
Industry mix (Fortune 500 HQ in IN)
| Industry | F500 HQs | Revenue |
|---|---|---|
| Industrial Machinery | 2 | $37B |
|
||
| Healthcare | 1 | $177B |
|
||
| Pharmaceuticals | 1 | $45B |
|
||
| Metals / Steel | 1 | $18B |
|
||
| Agriculture | 1 | $17B |
|
||
| Packaging | 1 | $12B |
|
||
Price history
+502.4% since first listed8 events — show timeline
- 2026-05-19 Pending — IRMLS
- 2026-05-13 Listed $150,000 IRMLS
- 2022-06-13 Sold (MLS) $125,000 IRMLS
- 2022-05-19 Listed $115,000 IRMLS
- 2017-01-27 Sold (MLS) $48,000 IRMLS
- 2016-08-27 Listed $49,900 IRMLS
- 2015-02-23 Sold (MLS) $24,000 IRMLS
- 2014-05-07 Listed $24,900 IRMLS
Property tax history
-5.2%/yrLatest (2025): $1,108 · -1.2% YoY. Source: county tax records.
Cash-flow waterfall
monthlySold comps — $/sqft
last 12 mo · ≤1 miLoading sold comps…