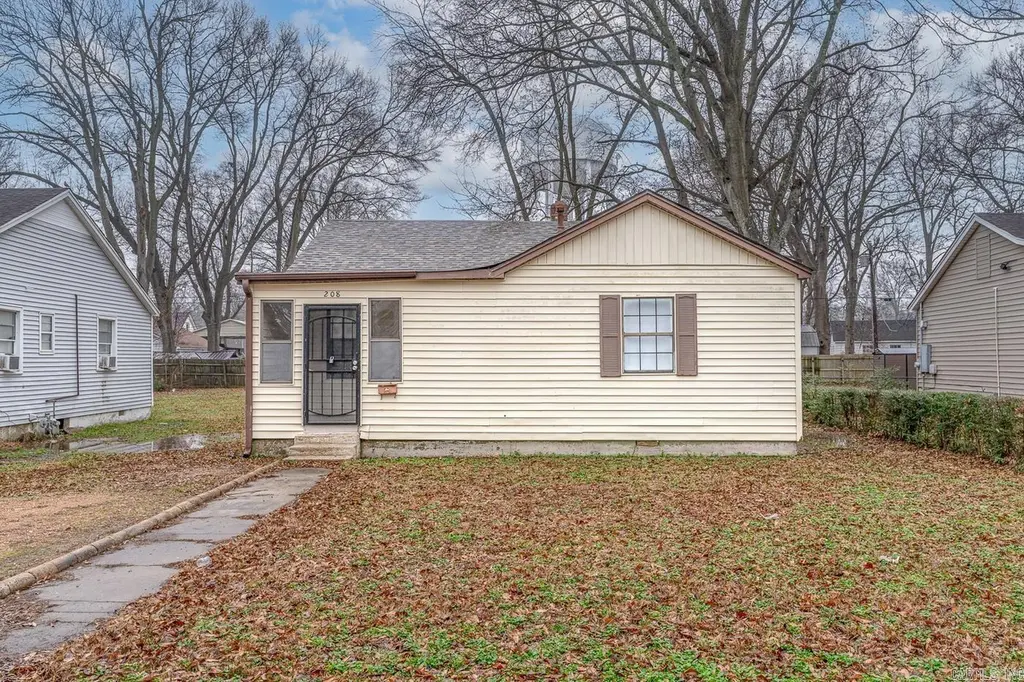
208 S Center Dr · West Memphis, AR
Flood risk 1/10 · Minimal
- FEMA flood zone
- X (shaded)
- Chance of flooding over 30 yrs
- 0.0%
- Est. flood insurance / yr
- $507 – $1,088
Fire risk 1/10 · Minimal
- Est. fire insurance / yr
- $1,499 – $2,785
Heat risk 6/10 · Moderate
- Hot days now (above 109°F)
- 7 days/yr
- Hot days in 30 yrs
- 21 days/yr
Wind risk 4/10 · Minor
- Chance of severe wind over 30 yrs
- 16.0%
Air-quality risk 2/10 · Minimal
- Unhealthy air days now
- 2 days/yr
- Unhealthy air days in 30 yrs
- 2 days/yr
Risk factors via First Street. Map © Google.
Why this score? — see what drove the B grade
The composite is a weighted blend of 9 inputs, each scored 0–100. Each bar is that input's sub-score; the figure is the points it added to the 100-point composite (weight × sub-score).
- Cash flow +30.0/30.0
- ARV discount +15.0/15.0
- 1% rule +10.0/10.0
- DSCR +10.0/10.0
- Livability +2.8/5.0
- Rent growth +2.5/5.0
- Condition / age +2.5/5.0
- Schools +1.2/10.0
- Appreciation +0.0/10.0
$69,900
🖨 Deal sheet (PDF) 📄 Offer letter ✓ Due diligence
Listing remarks MLS
Welcome to market this charming home located in the Worthington Park Subdivision perfect for an investor to add to their portfolio. 2bd/1ba cash flowing with a monthly rental amount of $750. Lease ends 05/31/2026 and professionally managed by Crestcore. Motivated Sellers! Bring all offers. DO NOT DISTURB TENANTS. Showings and inspections contingent upon an accepted contract only. Home being sold as a part of a 3 house package in the same area but can be sold separately. Cash or conventional financing only. Other properties are 1913 Sula & 1805 Goodwin
Key facts
- 7,840 sq ft lot
- Built 1967
- Listed 63 days
Neighborhood map
What this means for you Summary
Snapshot
- This is a 2-bed/1.0-bath single-family listed at $70k.
Deal economics
- At list price, monthly cash flow is $620 ($7k/yr) — positive.
- The deal already cash-flows at list — no discount required.
- Meets the 1% rule at list price ($1k rent vs $70k).
- Recommended offer: $66k (6.0% below list) — sets the bar for market timing.
- Cap rate 16.9% vs local median 6.9% in West Memphis — top-decile yield for the area; either an underpriced asset or a hidden risk that comps aren't pricing in. Stress-test before assuming the spread holds.
Location & tenants
- Location reads 55/100 on livability (#413 in AR) — a working-class tenant base; expect higher turnover. Strengths: cost of living A+, housing A; Watch: crime F, amenities F, commute F.
- West Memphis School District (suburban): math 16% / reading 15% proficiency, ranked #224 of 238 in AR (top 94%) — low school quality limits family demand, transient renter base, plan for 1-2y turnover; 96% free/reduced lunch — lower-income household profile, screen leases tightly.
- Zoned schools: Bragg Elementary School (math 24% / reading 15%, grade F, #383 of 454 statewide, top 86%, 534 students, 100% FRL); West Junior High School (math 19% / reading 25%, grade F, #175 of 201 statewide, top 88%, 507 students, 100% FRL); The Academies of West Memphis Charter School (math 7% / reading 22%, grade F, #265 of 292 statewide, top 91%, 952 students, 100% FRL, charter) — zoned schools at 100% FRL track the district average.
- Market conditions: 136 active listings in the ZIP; 4 comparable units currently listed for rent nearby; rentals leasing fast (median 13d on market — plan ~1-2 weeks tenant-placement turnaround); 69 units permitted in Crittenden County in 2024 (0 in 5+ unit buildings).
Forward outlook
- Local home prices are declining (-3.0%/yr); year-one equity from $483 of loan paydown is wiped out by about $2k of value loss. Plan a longer hold.
- Crittenden County population projected at -26% by 2050 — secular population decline; favor cash flow + early exit over multi-decade hold.
- At projected returns (-3.0% appreciation + 3.0% rent growth), your $20k cash investment doubles in ~4 years — after that, you're playing with house money.
Negotiation context
- It's been on market 63 days — a 6% lower offer ($66k) is reasonable based on typical stale-listing flexibility.
- 4 sale attempts with the ask held roughly flat each time — persistent listings suggest the price (not the market) is what's stuck; bring a comps-based counter.
Risks & watch-outs
- Climate carrying-cost: extreme-heat days projected 7→21/yr by 2055 (HVAC capex compounding) — expect insurance premiums to compound above CPI over the hold.
Questions for the listing agent
- It's been on market 63 days. Have you received any prior offers? Is the seller open to a 6% concession, seller financing, or rate buy-down credit?
- Built in 1967 — when were the roof, HVAC, electrical panel, plumbing, and water heater last replaced?
- Why hasn't it sold? Are there any deal-killer items the seller is aware of (foundation, flood, title, zoning, code violations)?
- Is there a deadline driving the sale (1031 exchange, divorce, estate, relocation)? That informs how much negotiation room exists.
- Schools are D-rated, which usually means shorter tenancies and higher turnover. Who's the typical renter profile here, and what's been the actual vacancy rate?
- Crime grade is F in this area — have there been break-ins, vandalism, or insurance claims at this property in the last 3 years? What carrier currently insures it and at what premium?
- What's the average days-on-market for RENTAL listings here right now (not sales)? A rising rental-DOM trend means longer vacancies and softer asking-rent achievability than the comps imply.
- What's the recent tenant-quality profile in this submarket — average credit score on applications, eviction rate, late-payment / NSF rate, and stable-employment percentage? A property-management company in the area should have these aggregated.
- How much new for-sale + rental construction is in the pipeline within 1–3 miles? Heavy new supply typically softens prices + rents 12–24 months out; constrained supply supports both.
Investment metrics
- 1% rule
- 1.93% ✓
- Cap rate
- 16.94%
- Cash-on-cash
- 38.04%
- DSCR
- 2.69
- GRM
- 4.3
CMA / ARV
- ARV (median comp)
- $131,249
- List price
- $69,900
- Delta
- -46.74%
- Verdict
- UNDERPRICED
- Comps
- 20 within 1.0 mi
Show comp detail 12 sales within ~0.75 mi
| Address | Dist | Beds/Ba | Sqft | Sold | Price | $/sf | Match |
|---|---|---|---|---|---|---|---|
| 208 S Center Dr | 0.00mi | 2/1.0 | 1,137 (0%) | 0mo | $50,000 | $44 | 100 |
| 227 S Worthington Dr | 0.10mi | 3/2.0 (+1) | 1,013 (-11%) | 3mo | $169,900 | $168 | 66 |
| 330 S Center Dr | 0.28mi | 3/1.0 (+1) | 1,240 (+9%) | 2mo | $165,000 | $133 | 65 |
| 1409 N Avalon St | 0.47mi | 3/1.5 (+1) | 1,172 (+3%) | 2mo | $164,900 | $141 | 65 |
| 1404 Chester Ln | 0.38mi | 3/2.0 (+1) | 1,164 (+2%) | 9mo | $173,500 | $149 | 62 |
| 516 Highland Dr | 0.53mi | 3/1.0 (+1) | 1,103 (-3%) | 6mo | $155,000 | $141 | 60 |
| 702 Don Jenkins Cv | 0.30mi | 2/2.0 | 1,255 (+10%) | 10mo | $207,000 | $165 | 56 |
| 409 Balfour Rd | 0.59mi | 3/1.0 (+1) | 1,040 (-8%) | 3mo | $155,000 | $149 | 51 |
| 603 Baylor Dr | 0.68mi | 3/1.0 (+1) | 1,050 (-8%) | 1mo | $133,000 | $127 | 50 |
| 211 E Danner Ave | 0.60mi | 2/1.0 | 1,268 (+12%) | 4mo | $60,000 | $47 | 49 |
| 508 Arlington Dr | 0.51mi | 3/1.0 (+1) | 1,014 (-11%) | 8mo | $135,000 | $133 | 47 |
| 116 W Cooper Ave | 0.45mi | 3/2.0 (+1) | 1,268 (+12%) | 10mo | $159,900 | $126 | 43 |
Match score weights: distance 35% · size 25% · config 20% · recency 20%. Top-matched comps best support the ARV.
Projected returns pro-forma
-3.0% appreciation · 3.0% rent growth · sell at horizon
- IRR
- 34.1%
- Equity multiple
- 2.44×
- Total profit
- $28,184
- Equity at exit
- $10,422
- IRR
- 41.0%
- Equity multiple
- 4.85×
- Total profit
- $75,409
- Equity at exit
- $6,044
Cash invested: $19,572 (down + closing). Projections, not guarantees.
Landlord ↔ Tenant lean methodology
- Overall (STATE)
- 92 Strongly Landlord-Friendly
- State Arkansas
- 92 Strongly Landlord-Friendly · R+14
- County
- — inherits STATE
- City
- — inherits STATE
ZIP-level market 72301
- Active inventory
- 136
- Price-to-rent
- 4.3×
Monthly cashflow live
- Estimated rent
- $1,347 medium interval (Pro) →
- Mortgage (P&I)
- −$367
- Tax from tax record
- −$48 /mo · $578/yr
- Insurance
- −$29
- HOA
- −$0
- Vacancy / Maint / Mgmt
- −$283
- Net cashflow
- $620
Break-even live
Sensitivity live
| Price | -10% $660 | -5% $640 | +0% $620 | +5% $601 | +10% $581 |
|---|---|---|---|---|---|
| Rent | -10% $514 | -5% $567 | +0% $620 | +5% $674 | +10% $727 |
| Rate | -1.0pp $656 | -0.5pp $638 | base $620 | +0.5pp $602 | +1.0pp $584 |
UW: 25.0% down · 7.5% · 30yr · 1.5% tax · 5.0% vac · 8.0% maint · 8.0% mgmt
Financing live
Cash to close
- Down payment
- $17,475
- Closing costs
- $2,097
- Reserves months
- —
- Total cash needed
- —
Loan-product check · same deal, 3 products live
Conventional
25% down · 7.5% · 30yr
- Down + closing
- —
- Monthly P&I
- —
- Monthly cashflow
- —
- DSCR
- —
- Eligible?
- —
Personal DTI + credit; lowest rate.
DSCR
20% down · 8.5% · 30yr
- Down + closing
- —
- Monthly P&I
- —
- Monthly cashflow
- —
- DSCR
- —
- Eligible?
- —
No personal income docs; deal must DSCR.
Hard money
10% down · 12.0% · 12mo
- Down + closing
- —
- Monthly P&I
- —
- Monthly cashflow
- —
- DSCR
- —
- Eligible?
- —
Short-term bridge; refi at stabilization.
Rent comps 4 comps
| Address | Beds | Baths | Sqft | Rent | $/sqft | DOM | Units | Dist |
|---|---|---|---|---|---|---|---|---|
| 911 N Avalon St Unit Future applicants West Memphis, AR | 2.0 | 2.0 | 1057 | $1,500 | $1.42 | 0d | 1 | 0.36mi |
| 1398 E Barton Ave West Memphis, AR | 3.0 | 2.0 | 1250 | $1,550 | $1.24 | 12d | 1 | 1.13mi |
| 741 N 18th St West Memphis, AR | 2.0 | 1.0 | 814 | $940 | $1.15 | 6d | 1 | 1.40mi |
| 905 Deaunta Farrow ST West Memphis, AR | 1.0 | 1.0 | 850 | $650 | $0.76 | 45d | 1 | 1.49mi |
Listing history 9 events
-
2026-05-18status Under Contract 563-char remark
Show marketing remark (563 chars)
Welcome to market this charming home located in the Worthington Park Subdivision perfect for an investor to add to their portfolio. 2bd/1ba cash flowing with a monthly rental amount of $750. Lease ends 05/31/2026 and professionally managed by Crestcore. Motivated Sellers! Bring all offers. DO NOT DISTURB TENANTS. Showings and inspections contingent upon an accepted contract only. Home being sold as a part of a 3 house package in the same area but can be sold separately. Cash or conventional financing only. Other properties are 1913 Sula & 1805 Goodwin
-
2026-03-16$69,900 New Listing 563-char remark
Show marketing remark (563 chars)
Welcome to market this charming home located in the Worthington Park Subdivision perfect for an investor to add to their portfolio. 2bd/1ba cash flowing with a monthly rental amount of $750. Lease ends 05/31/2026 and professionally managed by Crestcore. Motivated Sellers! Bring all offers. DO NOT DISTURB TENANTS. Showings and inspections contingent upon an accepted contract only. Home being sold as a part of a 3 house package in the same area but can be sold separately. Cash or conventional financing only. Other properties are 1913 Sula & 1805 Goodwin
-
2025-09-01historical
-
2025-04-17price $71,900
-
2025-02-06$74,900 New Listing
-
2025-02-02$74,900 Active
-
2025-01-13historical $750
-
2025-01-07$750
-
2016-05-19soldstatus $82,000
ⓘ Source: listings_history table (triggers on properties + properties_extension) + one-shot
backfill from property_details.listing_events for pre-trigger history.
Tax reassessment forecast AR · Resets to sale price
- Current annual tax
- $578 · $48/mo
- Projected year-2 tax
- $578 · $48/mo
- Expected delta
- $0/yr ($0/mo · 0.0%)
ⓘ Screening estimate from a state-policy table — verify with the county assessor before closing.
Climate risk First Street
- Flood 1/10 Low FEMA zone X (shaded) · 0% chance over 30 yrs
- Wildfire 1/10 Low
- Heat 6/10 Major 7 d/yr ≥109°F today · 21 d/yr by 30 yrs out
- Wind 4/10 Moderate 16% chance of damaging wind over 30 yrs
- Air quality 2/10 Low 2 unhealthy d/yr today · 2 by 30 yrs out
Nearby sold comps map
Loading sold comps map…
Walkable amenities ~0.75 mi
Loading nearby amenities…
Taxation est. · year 1
- Rental income
- $16,166
- − Mortgage interest
- −$3,915
- − Property taxes
- −$578
- − Insurance
- −$350
- − Repairs & maintenance
- −$1,293
- − Management
- −$1,293
- − Depreciation
- −$2,033
- Taxable income
- $6,703
- Est. tax owed @ 24.0%
- −$1,609
- After-tax cash flow
- $5,836/yr
For passive investors: Depreciation is non-cash, so a rental often shows a tax loss while cash-flowing — sheltering income. Rental losses are passive: they offset passive income freely, and up to $25,000/yr can offset ordinary (W-2) income if you actively participate and your MAGI is under $100k (phasing out to $0 by $150k); unused losses carry forward. On sale, claimed depreciation is recaptured at up to 25%, and gains may owe capital-gains tax (a 1031 exchange can defer both). Figures are a year-1 estimate at your 24.0% rate — not tax advice; consult a CPA.
Schools (NCES district)
- District
- West Memphis School District
- NCES district ID
- 0508040
- Math proficiency
- 16% ▼ -14.00%
- Reading proficiency
- 15% ▼ -14.00%
- Median HH income
- $29,382
- Composite
- 12.22/100
- National rank
- #9647
- State rank
- #224 of 238 in AR
Livability — West Memphis
- Score
- 55/100
- State rank
- #413
- US rank
- #23638
Category grades
Schools grade is shown separately in the Schools card above.
Census & demographics
- Census place
- West Memphis, AR
- City population
- 24,182
- Population (ZIP)
- 24,182
Population outlook (Crittenden County) Hauer SSP2
- Today (2025)
- 45,254 people
- By 2030
- 42,953 · -5.1%
- By 2040
- 38,235 · -15.5%
- By 2050
- 33,670 · -25.6%
- By 2075
- 24,315 · -46.3%
- By 2100
- 17,173 · -62.1%
Race, ethnicity, and origin ACS 2023
- Neighborhood character
- Majority Black (64%)
- Race & ethnicity
- Black 64% White 29% Two or more races 6% Hispanic / Latino 2%
- Common ancestry
- Serbian 1%
- Foreign-born
- 1% · Canada
- Languages at home
- 98% English-only · Spanish 1%
Political lean MEDSL · Crittenden
- 2024 margin
- Toss-up / Even · D 50.1% · R 47.9% · Other 2.0%
- 2008→2024 swing
- -12.4pp toward R · 2008: 14.7pp · 2024: 2.3pp
- All cycles
- 2024: D+2.3 2020: D+7.2 2016: D+9.0 2012: D+18.7 2008: D+14.7
Not yet ingested
- Civics
- —
Market trends
- HPI YoY
- ▼ -143.63%
- Current HPI
- 182.7665
- Rent YoY
- —
- Metro
- —
- State GDP YoY
- ▲ 3.80%
- F500 in state
- 10
Industry mix (Fortune 500 HQ in AR)
| Industry | F500 HQs | Revenue |
|---|---|---|
| Retail | 1 | $681B |
|
||
| Food / Agriculture | 1 | $53B |
|
||
| Retail / Energy | 1 | $22B |
|
||
| Transportation / Logistics | 1 | $12B |
|
||
| Energy | 1 | $4B |
|
||
Price history
-14.8% since first listed9 events — show timeline
- 2026-05-18 Pending — CARMLS
- 2026-03-16 Listed $69,900 CARMLS
- 2025-09-01 Listing Removed — CARMLS
- 2025-04-17 Price Changed $71,900 CARMLS
- 2025-02-06 Listed $74,900 CARMLS
- 2025-02-02 Listed $74,900 NEABOR MLS
- 2025-01-13 Rental Removed $750 MMLS
- 2025-01-07 Listed for Rent $750 MMLS
- 2016-05-19 Sold (Public Records) $82,000 Public Records
Property tax history
+2.7%/yrLatest (2025): $578 · +9.9% YoY. Source: county tax records.
Cash-flow waterfall
monthlySold comps — $/sqft
last 12 mo · ≤1 miLoading sold comps…