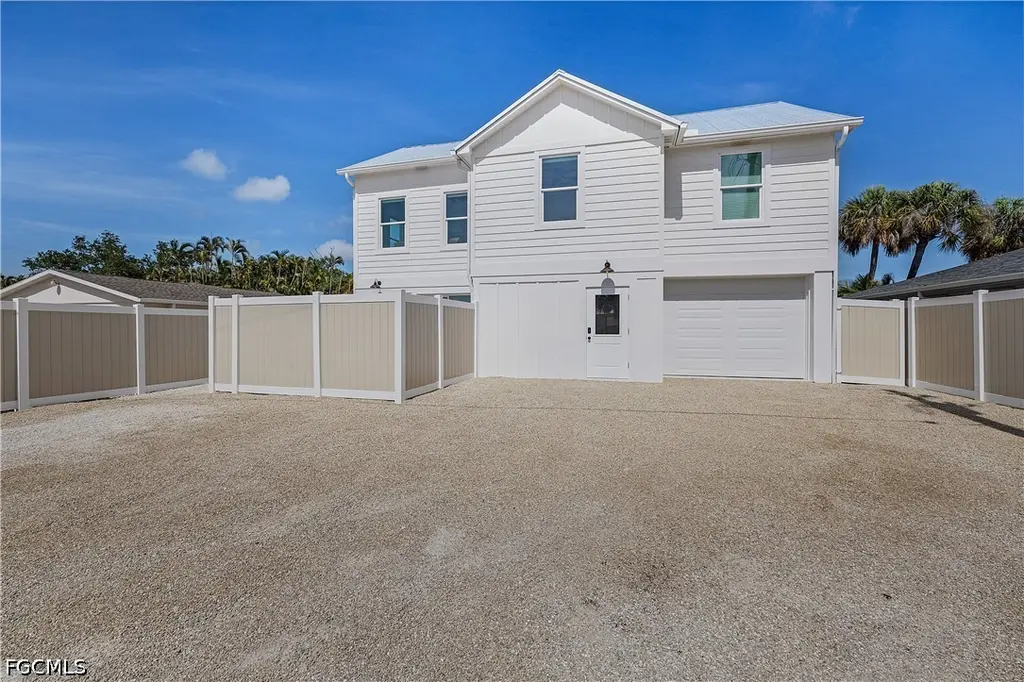
2551 Tamarind St · St. James City, FL
Flood risk 10/10 · Severe
- FEMA flood zone
- AE
- Chance of flooding over 30 yrs
- 0.99%
- Est. flood insurance / yr
- $1,737 – $8,500
Fire risk 2/10 · Minimal
- Est. fire insurance / yr
- $947 – $1,759
Heat risk 10/10 · Severe
- Hot days now (above 107°F)
- 7 days/yr
- Hot days in 30 yrs
- 28 days/yr
Wind risk 10/10 · Severe
- Chance of severe wind over 30 yrs
- 99.0%
Air-quality risk 2/10 · Minimal
- Unhealthy air days now
- 1 days/yr
- Unhealthy air days in 30 yrs
- 2 days/yr
Risk factors via First Street. Map © Google.
Why this score? — see what drove the C grade
The composite is a weighted blend of 9 inputs, each scored 0–100. Each bar is that input's sub-score; the figure is the points it added to the 100-point composite (weight × sub-score).
- Cash flow +26.2/30.0
- DSCR +8.8/10.0
- 1% rule +6.2/10.0
- ARV discount +4.4/15.0
- Schools +4.1/10.0
- Rent growth +2.5/5.0
- Livability +2.5/5.0
- Condition / age +2.5/5.0
- Appreciation +0.0/10.0
$445,000
🖨 Deal sheet (PDF) 📄 Offer letter ✓ Due diligence
Listing remarks MLS
Location. Location. Location. 3 bedroom 1 bath stilt home near the south end of Pine Island. Entry to this home is from the rear and there is lush vegetation surrounding. There is ample parking for trailers, trucks, short boats, bikes, or golf carts. Community attractions, like restaurants and parks are nearby and many people use golf carts to get around the community. This home is elevated 2 feet higher and plumbing is tucked under nicely to accommodate expansion to add a ground floor. Stilts are Cement Block and the slab is reinforced. Walking in, you have the kitchen immediately to your left and an open dining room and living room with a vaulted ceiling. The kitchen appliances are stainless. The kitchen island has wheels to move the location as you wish. At the end of the hallway, you will find an extra big bathroom with dual sinks, a large bathtub, and a walk-in shower with multiple shower heads. The master bedroom has a large walk-in closet and the other 2 bedrooms are roomy and have good-sized closets. The Laundry is in residence too. Full-size washer/dryer convey with the home. The home has a permanent generator installed. Start living the Island Life!
Key facts
- His and her sinks
- Stand alone tub
- Oversize shower
Tags
Property features AI
Finance
- Financial info: Pets allowed
- HOA & community: Non-gated community; Association fee includes trash
Exterior
- Parking: Attached garage; Garage with door opener; 1 covered garage space
- Security: Security/high impact doors; Smoke detectors
- Utilities: Public water; Septic tank sewer; Cable available; High-speed internet available; Municipal irrigation source
- Home design: 2-story building; Resale property; Faces east; West exposure in lot orientation
- Construction: Metal roof; Block, concrete, stucco and wood frame construction
- Exterior features: Deck; Patio; Porch (open, screened, lanai); Fence; Sprinkler/irrigation (automatic); Storage; Security/high impact doors; Smoke detectors
Interior
- Kitchen: Gas cooktop; Range; Self-cleaning oven; Microwave; Dishwasher; Disposal; Icemaker; Freezer; Refrigerator; Refrigerator with ice maker; Pantry; Eat-in kitchen
- Bedrooms: Includes exercise room, family room, great room and screened porch (room types listed)
- Flooring: Tile
- Bathrooms: 2 full bathrooms; 1 half bathroom
- Heating & cooling: Central heating (electric); Central air; Ceiling fans; Electric cooling; Wall units
- Interior features: Built-in features; Bathtub; Dual sinks; Eat-in kitchen; Multiple shower heads; Pantry; Separate shower; Cable TV; Bar; Walk-in closets; Air filtration; Single hung windows; Tinted windows; Impact glass; Unfurnished
- Laundry & utility: Washer hookup inside; Dryer hookup inside; Washer; Dryer; Air purifier
Neighborhood map
What this means for you Summary
Snapshot
- This is a 3-bed/1.0-bath single-family listed at $445k.
Deal economics
- At list price, monthly cash flow is $702 ($8k/yr) — positive.
- The deal already cash-flows at list — no discount required.
- Meets the 1% rule at list price ($5k rent vs $445k).
- Recommended offer: $438k (1.5% below list) — sets the bar for market timing.
- Cap rate 9.3% vs local median 4.9% in St. James City — top-decile yield for the area; either an underpriced asset or a hidden risk that comps aren't pricing in. Stress-test before assuming the spread holds.
Location & tenants
- Location reads: area grade C — affects rentability + tenant quality, not the cash-flow math above.
- Lee (suburban): math 47% / reading 50% proficiency, ranked #42 of 73 in FL (top 58%) — families likely to look elsewhere, expect single-tenant / working-renter base with shorter leases.
- Market conditions: 287 active listings in the ZIP; 5 comparable units currently listed for rent nearby; rentals at typical pace (median 25d on market — plan ~3-4 weeks tenant-placement turnaround); 15,411 units permitted in Lee County in 2024 (4,686 in 5+ unit buildings).
Forward outlook
- Local home prices are declining (-3.0%/yr); year-one equity from $3k of loan paydown is wiped out by about $13k of value loss. Plan a longer hold.
- Lee County population projected at +44% by 2050 — long-run rental-demand tailwind backs the buy-and-hold thesis.
Negotiation context
- It's been on market 16 days — a 2% lower offer ($438k) is reasonable based on typical stale-listing flexibility.
- 2 sale attempts since 4y ago with the ask held roughly flat each time — persistent listings suggest the price (not the market) is what's stuck; bring a comps-based counter.
- Current owner paid $249k; list at $445k implies a 79% gain — meaningful room to come down on a strong offer.
Risks & watch-outs
- Watch-outs: flood insurance adds $427/mo.
- Climate carrying-cost: in FEMA flood zone AE (mandatory federal flood insurance); severe wind risk, 99% chance of damaging wind over 30y; extreme-heat days projected 7→28/yr by 2055 (HVAC capex compounding) — expect insurance premiums to compound above CPI over the hold.
Questions for the listing agent
- What's the actual annual flood-insurance premium (NFIP or private), and is the property in a SFHA with mandatory coverage?
- Is there a deadline driving the sale (1031 exchange, divorce, estate, relocation)? That informs how much negotiation room exists.
- What's the average days-on-market for RENTAL listings here right now (not sales)? A rising rental-DOM trend means longer vacancies and softer asking-rent achievability than the comps imply.
- What's the recent tenant-quality profile in this submarket — average credit score on applications, eviction rate, late-payment / NSF rate, and stable-employment percentage? A property-management company in the area should have these aggregated.
- How much new for-sale + rental construction is in the pipeline within 1–3 miles? Heavy new supply typically softens prices + rents 12–24 months out; constrained supply supports both.
Investment metrics
- 1% rule
- 1.12% ✓
- Cap rate
- 9.34%
- Cash-on-cash
- 10.87%
- DSCR
- 1.48
- GRM
- 7.4
CMA / ARV
- ARV (on-the-fly)
- $415,996
- Comps found
- 7
Show comp detail 7 sales within ~0.75 mi
| Address | Dist | Beds/Ba | Sqft | Sold | Price | $/sf | Match |
|---|---|---|---|---|---|---|---|
| 2411 Oleander St | 0.27mi | 2/1.0 (-1) | 1,117 (-4%) | 22mo | $475,000 | $425 | 57 |
| 2320 Oleander St | 0.31mi | 2/1.0 (-1) | 1,007 (-13%) | 3mo | $279,000 | $277 | 56 |
| 3289 8th Ave | 0.21mi | 2/2.0 (-1) | 1,049 (-10%) | 15mo | $305,000 | $291 | 52 |
| 3947 Coconut Dr | 0.72mi | 2/2.0 (-1) | 1,167 (+0%) | 5mo | $634,000 | $543 | 52 |
| 2472 York Rd | 0.58mi | 2/1.5 (-1) | 1,104 (-5%) | 12mo | $395,000 | $358 | 48 |
| 2371 Baybreeze St | 0.22mi | 3/2.0 | 1,327 (+14%) | 23mo | $307,500 | $232 | 43 |
| 3232 Stabile Rd | 0.70mi | 2/2.0 (-1) | 1,056 (-9%) | 12mo | $599,900 | $568 | 33 |
Match score weights: distance 35% · size 25% · config 20% · recency 20%. Top-matched comps best support the ARV.
Projected returns pro-forma
-3.0% appreciation · 3.0% rent growth · sell at horizon
- IRR
- -5.9%
- Equity multiple
- 0.78×
- Total profit
- $-27,217
- Equity at exit
- $66,351
- IRR
- 3.8%
- Equity multiple
- 1.28×
- Total profit
- $34,613
- Equity at exit
- $38,475
Cash invested: $124,600 (down + closing). Projections, not guarantees.
Landlord ↔ Tenant lean methodology
- Overall (STATE)
- 87 Strongly Landlord-Friendly
- State Florida
- 87 Strongly Landlord-Friendly · R+3
- County
- — inherits STATE
- City
- — inherits STATE
ZIP-level market 33956
- Home prices YoY
- -16.3%
- Active inventory
- 287
- Price-to-rent
- 7.4×
Monthly cashflow live
- Estimated rent
- $5,002 medium interval (Pro) →
- Mortgage (P&I)
- −$2,334
- Tax from tax record
- −$304 /mo · $3,649/yr
- Insurance
- −$185
- Flood insurance flood zone
- −$427 /mo · $5,118/yr
- HOA
- −$0
- Vacancy / Maint / Mgmt
- −$1,050
- Net cashflow
- $702
Break-even live
Sensitivity live
| Price | -10% $954 | -5% $828 | +0% $702 | +5% $576 | +10% $450 |
|---|---|---|---|---|---|
| Rent | -10% $307 | -5% $504 | +0% $702 | +5% $900 | +10% $1,097 |
| Rate | -1.0pp $926 | -0.5pp $815 | base $702 | +0.5pp $587 | +1.0pp $469 |
UW: 25.0% down · 7.5% · 30yr · 1.5% tax · 5.0% vac · 8.0% maint · 8.0% mgmt
Financing live
Cash to close
- Down payment
- $111,250
- Closing costs
- $13,350
- Reserves months
- —
- Total cash needed
- —
Loan-product check · same deal, 3 products live
Conventional
25% down · 7.5% · 30yr
- Down + closing
- —
- Monthly P&I
- —
- Monthly cashflow
- —
- DSCR
- —
- Eligible?
- —
Personal DTI + credit; lowest rate.
DSCR
20% down · 8.5% · 30yr
- Down + closing
- —
- Monthly P&I
- —
- Monthly cashflow
- —
- DSCR
- —
- Eligible?
- —
No personal income docs; deal must DSCR.
Hard money
10% down · 12.0% · 12mo
- Down + closing
- —
- Monthly P&I
- —
- Monthly cashflow
- —
- DSCR
- —
- Eligible?
- —
Short-term bridge; refi at stabilization.
Rent comps 5 comps
| Address | Beds | Baths | Sqft | Rent | $/sqft | DOM | Units | Dist |
|---|---|---|---|---|---|---|---|---|
| 2744 Sanderling Ct Saint James City, FL | 2.0 | 1.0 | 841 | $5,300 | $6.30 | 24d | 1 | 0.21mi |
| 2951 York Rd Saint James City, FL | 2.0 | 2.0 | 1444 | $5,500 | $3.81 | 24d | 1 | 0.53mi |
| 3811 Emerald Ave Saint James City, FL | 3.0 | 2.5 | 1500 | $5,500 | $3.67 | 24d | 1 | 0.62mi |
| 3864 Royal Palm Dr Saint James City, FL | 2.0 | 1.0 | 960 | $1,650 | $1.72 | 24d | 1 | 0.65mi |
| 3103 Harpoon Ln Saint James City, FL | 2.0 | 2.0 | 1094 | $3,000 | $2.74 | 24d | 1 | 0.79mi |
Listing history 11 events
-
2026-06-18days on market $445,000 Active 16 DOM
-
2026-06-17days on market $445,000 Active 15 DOM
-
2026-06-16days on market $445,000 Active 14 DOM
-
2026-06-15days on market $445,000 Active 13 DOM
-
2026-06-13days on market $445,000 Active 11 DOM
-
2026-06-10days on market $445,000 Active 8 DOM
-
2026-06-09days on market $445,000 Active 7 DOM
-
2026-06-08days on market $445,000 Active 6 DOM
-
2026-06-07days on market $445,000 Active 5 DOM
-
2026-06-02remarks 681-char remark
-
2026-06-02$445,000 Active 1 DOM
ⓘ Source: listings_history table (triggers on properties + properties_extension) + one-shot
backfill from property_details.listing_events for pre-trigger history.
Tax reassessment forecast FL · Resets to sale price
- Current annual tax
- $3,649 · $304/mo
- Projected year-2 tax
- $3,694 · $308/mo
- Expected delta
- +$45/yr (+$4/mo · 1.2%)
ⓘ Screening estimate from a state-policy table — verify with the county assessor before closing.
Climate risk First Street
- Flood 10/10 Extreme FEMA zone AE · 99% chance over 30 yrs
- Wildfire 2/10 Low
- Heat 10/10 Extreme 7 d/yr ≥107°F today · 28 d/yr by 30 yrs out
- Wind 10/10 Extreme 99% chance of damaging wind over 30 yrs
- Air quality 2/10 Low 1 unhealthy d/yr today · 2 by 30 yrs out
Nearby sold comps map
Loading sold comps map…
Walkable amenities ~0.75 mi
Loading nearby amenities…
Taxation est. · year 1
- Rental income
- $60,025
- − Mortgage interest
- −$24,927
- − Property taxes
- −$3,649
- − Insurance
- −$7,344
- − Repairs & maintenance
- −$4,802
- − Management
- −$4,802
- − Depreciation
- −$12,945
- Taxable income
- $1,556
- Est. tax owed @ 24.0%
- −$373
- After-tax cash flow
- $8,050/yr
For passive investors: Depreciation is non-cash, so a rental often shows a tax loss while cash-flowing — sheltering income. Rental losses are passive: they offset passive income freely, and up to $25,000/yr can offset ordinary (W-2) income if you actively participate and your MAGI is under $100k (phasing out to $0 by $150k); unused losses carry forward. On sale, claimed depreciation is recaptured at up to 25%, and gains may owe capital-gains tax (a 1031 exchange can defer both). Figures are a year-1 estimate at your 24.0% rate — not tax advice; consult a CPA.
Schools (NCES district)
- District
- Lee
- NCES district ID
- 1201080
- Math proficiency
- 47% ▼ -11.00%
- Reading proficiency
- 50% ▼ -4.00%
- Median HH income
- $49,518
- Composite
- 41.49/100
- National rank
- #3458
- State rank
- #42 of 73 in FL
Livability — St. James City
No livability data for this city. (Only ~50 U.S. cities are tracked.)
Census & demographics
- Census place
- St. James City, FL
- Population (ZIP)
- 3,846
Population outlook (Lee County) Hauer SSP2
- Today (2025)
- 871,946 people
- By 2030
- 955,468 · +9.6%
- By 2040
- 1,113,587 · +27.7%
- By 2050
- 1,256,891 · +44.1%
- By 2075
- 1,560,270 · +78.9%
- By 2100
- 1,726,848 · +98.0%
Race, ethnicity, and origin ACS 2023
- Neighborhood character
- Predominantly White (94%)
- Race & ethnicity
- White 94% Two or more races 3% Pacific Islander 2% Hispanic / Latino 1%
- Common ancestry
- Romanian 6% Slovak 4% Iranian 3%
- Foreign-born
- 5% · Canada
- Languages at home
- 95% English-only · French/Haitian/Cajun 2% German/W. Germanic 2% Russian/Polish/Slavic 1%
Political lean MEDSL · Lee
- 2024 margin
- Strong R (+28.4) · D 35.5% · R 63.9%
- 2008→2024 swing
- -18.0pp toward R · 2008: -10.4pp · 2024: -28.4pp
- All cycles
- 2024: R+28.4 2020: R+19.2 2016: R+20.4 2012: R+16.6 2008: R+10.4
Not yet ingested
- Civics
- —
Market trends
- HPI YoY
- ▼ -58.47%
- Current HPI
- 300.1416
- Rent YoY
- —
- Metro
- —
- State GDP YoY
- ▲ 3.28%
- F500 in state
- 36
Industry mix (Fortune 500 HQ in FL)
| Industry | F500 HQs | Revenue |
|---|---|---|
| Industrial Technology | 2 | $29B |
|
||
| Insurance | 2 | $17B |
|
||
| Retail | 1 | $60B |
|
||
| Technology Distribution | 1 | $58B |
|
||
| Homebuilding | 1 | $35B |
|
||
| Technology Manufacturing | 1 | $35B |
|
||
Price history
+39.1% since first listed7 events — show timeline
- 2026-06-02 Price Changed $445,000 FORTMLS
- 2026-06-01 Listed $435,000 FORTMLS
- 2022-09-26 Sold (Public Records) $249,000 Public Records
- 2022-09-26 Sold (MLS) $249,000 FORTMLS
- 2022-09-03 Pending — FORTMLS
- 2022-08-04 Price Changed $313,000 FORTMLS
- 2022-06-24 Listed $320,000 FORTMLS
Property tax history
+7.2%/yrLatest (2025): $3,649 · +26.1% YoY. Source: county tax records.
Cash-flow waterfall
monthlySold comps — $/sqft
last 12 mo · ≤1 miLoading sold comps…