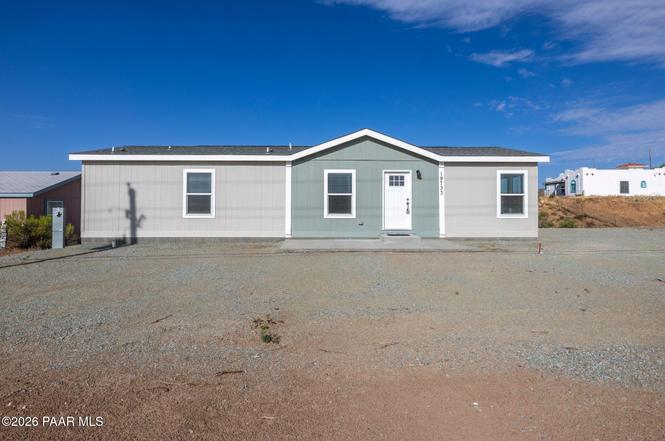
19733 E Stagecoach Trl · Cordes Lakes, AZ
Flood risk 1/10 · Minimal
- FEMA flood zone
- X (unshaded)
- Chance of flooding over 30 yrs
- 0.0%
- Est. flood insurance / yr
- $507 – $1,088
Fire risk 6/10 · Moderate
- Est. fire insurance / yr
- $610 – $1,132
Heat risk 6/10 · Moderate
- Hot days now (above 101°F)
- 7 days/yr
- Hot days in 30 yrs
- 18 days/yr
Wind risk 1/10 · Minimal
- Chance of severe wind over 30 yrs
- —
Air-quality risk 2/10 · Minimal
- Unhealthy air days now
- 1 days/yr
- Unhealthy air days in 30 yrs
- 1 days/yr
Risk factors via First Street. Map © Google.
Why this score? — see what drove the D- grade
The composite is a weighted blend of 9 inputs, each scored 0–100. Each bar is that input's sub-score; the figure is the points it added to the 100-point composite (weight × sub-score).
- Appreciation +10.0/10.0
- Cash flow +7.9/30.0
- ARV discount +7.5/15.0
- Livability +3.0/5.0
- Rent growth +2.5/5.0
- Condition / age +2.5/5.0
- 1% rule +2.4/10.0
- DSCR +2.0/10.0
- Schools +2.0/10.0
$265,000
🖨 Deal sheet (PDF) 📄 Offer letter ✓ Due diligence
Listing remarks MLS
Are you searching for a great lot, in a great location, and that's ready for your dream home? Well you found it! Enjoy great views of the surrounding mountains and valleys from this incredible Cordes Lakes lot. Quick and easy commute to Phoenix, Prescott, and the Verde Valley. No HOA, private water company, electric close by, and paved access. This great lot will not last long, come by and take a look today!
Key facts
- Oversized homesite
- Walk-in closet
- Abundant cabinetry
Tags
Property features AI
Finance
- Other: Lot approximately 0.21 acre; Zoning: R2-4; Road frontage: County road; paved/asphalt surface; county maintains road; Subdivision: Cordes Lakes; Green features include efficient hot water distribution, low-flow fixtures, energy-efficient appliances, construction, HVAC, insulation, lighting, thermostat, water heater and windows
- HOA & community: Not a senior community
Exterior
- Parking: Driveway (gravel)
- Security: Smoke detector(s)
- Utilities: 220-volt electric service; Electric water heater; Private water source; Septic (WWT - septic conventional); Individual utility meters; Underground utilities; Phone available
- Home design: Residential manufactured home (double wide); Single-story; ENERGY STAR Certified home
- Construction: Frame construction; Composition roof; Crawl space with piers and stem wall foundation; Built as a double wide manufactured home
- Exterior features: Front and rear landscaping; Gravel driveway; Deck; Level entry; Level lot with trees and views
Interior
- Kitchen: Cooktop; Electric cooktop; Electric range; Oven; Range; Dishwasher; Disposal; Refrigerator; ENERGY STAR qualified appliances
- Bedrooms: Master bedroom on main level
- Flooring: Carpet; Vinyl
- Bathrooms: 1 full bathroom; 1 three-quarter bathroom (2 total bathrooms)
- Heating & cooling: Heat pump; Electric heating; Central air
- Interior features: Ceiling fans; Solid surface counters; Eat-in kitchen; Formal dining; Kitchen island; Single-level living; Master bedroom on main level; Pantry; Walk-in closet(s); Low-flow plumbing fixtures; Smoke detector(s)
- Laundry & utility: Laundry room; Washer/Dryer connection; 50-gallon electric water heater
Neighborhood map
What this means for you Summary
Snapshot
- This is a 3-bed/2.0-bath land listed at $265k.
Deal economics
- At list price, monthly cash flow is $-279 ($-3k/yr) — negative.
- To cash-flow at today's rent, offer at most $225k (15.2% below list).
- To meet the 1% rule (rent ≥ 1% of price), the offer needs to be $196k (25.9% below list).
- Recommended offer: $196k (25.9% below list) — sets the bar for 1% rule.
Location & tenants
- Location reads 60/100 on livability (#181 in AZ) — a middle-class / working-renter tenant base. Strengths: cost of living A+, housing A+, crime A-; Watch: amenities F, commute F, employment F.
- Mayer Unified School District (4473) (rural): math 23% / reading 26% proficiency, ranked #165 of 249 in AZ (top 66%) — low school quality limits family demand, transient renter base, plan for 1-2y turnover; 80% free/reduced lunch — lower-income household profile, screen leases tightly.
- Zoned schools: Mayer Elementary School (math 26% / reading 32%, grade F, #570 of 1,109 statewide, top 52%, 373 students, 93% FRL); Mayer High School (math 5% / reading 5%, grade F, #364 of 381 statewide, top 100%, 200 students, 66% FRL) — zoned schools at 79% FRL track the district average.
- Market conditions: 244 active listings in the ZIP; 2,062 units permitted in Yavapai County in 2024 (98 in 5+ unit buildings).
Forward outlook
- In year one you build about $28k of equity ($2k loan paydown + $26k appreciation (10.0% local appreciation)).
- Yavapai County population projected at +10% by 2050 — modest demand growth; plan on rents tracking national, not racing it.
- By year 2, paydown + projected appreciation supports a ~$46k cash-out refi (75% LTV) — recoverable capital for the next deal without selling this one.
Negotiation context
- Only 2 days on market — expect competitive offers; lowballing is unlikely to land.
- 3 sale attempts since 4y ago with the ask held roughly flat each time — persistent listings suggest the price (not the market) is what's stuck; bring a comps-based counter.
- Current owner paid $28k; list at $265k implies a 846% gain — meaningful room to come down on a strong offer.
Risks & watch-outs
- Climate carrying-cost: major wildfire risk; extreme-heat days projected 7→18/yr by 2055 (HVAC capex compounding) — expect insurance premiums to compound above CPI over the hold.
Questions for the listing agent
- What do current leases actually rent for vs. the listed asking? Can we see a recent rent roll and the last 12 months of T-12 income?
- Is there a deadline driving the sale (1031 exchange, divorce, estate, relocation)? That informs how much negotiation room exists.
- Schools are F-rated, which usually means shorter tenancies and higher turnover. Who's the typical renter profile here, and what's been the actual vacancy rate?
- The area grade is low — what's the realistic commute time and amenity access for the typical tenant pool here? Any planned neighborhood developments (good or bad) we should know about?
- What's the average days-on-market for RENTAL listings here right now (not sales)? A rising rental-DOM trend means longer vacancies and softer asking-rent achievability than the comps imply.
- What's the recent tenant-quality profile in this submarket — average credit score on applications, eviction rate, late-payment / NSF rate, and stable-employment percentage? A property-management company in the area should have these aggregated.
- How much new for-sale + rental construction is in the pipeline within 1–3 miles? Heavy new supply typically softens prices + rents 12–24 months out; constrained supply supports both.
Investment metrics
- 1% rule
- 0.74% ✗
- Cap rate
- 5.03%
- Cash-on-cash
- -4.52%
- DSCR
- 0.80
- GRM
- 11.2
CMA / ARV
No comps found within radius.
Projected returns pro-forma
10.0% appreciation · 3.0% rent growth · sell at horizon
- IRR
- 21.1%
- Equity multiple
- 2.71×
- Total profit
- $126,570
- Equity at exit
- $238,733
- IRR
- 19.1%
- Equity multiple
- 6.21×
- Total profit
- $386,773
- Equity at exit
- $514,837
Cash invested: $74,200 (down + closing). Projections, not guarantees.
Landlord ↔ Tenant lean methodology
- Overall (STATE)
- 87 Strongly Landlord-Friendly
- State Arizona
- 87 Strongly Landlord-Friendly · R+3
- County
- — inherits STATE
- City
- — inherits STATE
ZIP-level market 86333
- Home prices YoY
- 17.3%
- Active inventory
- 244
- Price-to-rent
- 11.2×
Monthly cashflow live
- Estimated rent
- $1,965 medium interval (Pro) →
- Mortgage (P&I)
- −$1,390
- Tax est. 1.5%
- −$331 /mo · $3,975/yr
- Insurance
- −$110
- HOA
- −$0
- Vacancy / Maint / Mgmt
- −$413
- Net cashflow
- $-279
Break-even live
Sensitivity live
| Price | -10% $-96 | -5% $-188 | +0% $-279 | +5% $-371 | +10% $-462 |
|---|---|---|---|---|---|
| Rent | -10% $-434 | -5% $-357 | +0% $-279 | +5% $-202 | +10% $-124 |
| Rate | -1.0pp $-146 | -0.5pp $-212 | base $-279 | +0.5pp $-348 | +1.0pp $-418 |
UW: 25.0% down · 7.5% · 30yr · 1.5% tax · 5.0% vac · 8.0% maint · 8.0% mgmt
Financing live
Cash to close
- Down payment
- $66,250
- Closing costs
- $7,950
- Reserves months
- —
- Total cash needed
- —
Loan-product check · same deal, 3 products live
Conventional
25% down · 7.5% · 30yr
- Down + closing
- —
- Monthly P&I
- —
- Monthly cashflow
- —
- DSCR
- —
- Eligible?
- —
Personal DTI + credit; lowest rate.
DSCR
20% down · 8.5% · 30yr
- Down + closing
- —
- Monthly P&I
- —
- Monthly cashflow
- —
- DSCR
- —
- Eligible?
- —
No personal income docs; deal must DSCR.
Hard money
10% down · 12.0% · 12mo
- Down + closing
- —
- Monthly P&I
- —
- Monthly cashflow
- —
- DSCR
- —
- Eligible?
- —
Short-term bridge; refi at stabilization.
Listing history 2 events
-
2026-06-22remarks 699-char remark
-
2026-06-22$265,000 Active 2 DOM
ⓘ Source: listings_history table (triggers on properties + properties_extension) + one-shot
backfill from property_details.listing_events for pre-trigger history.
Climate risk First Street
- Flood 1/10 Low FEMA zone X (unshaded) · 0% chance over 30 yrs
- Wildfire 6/10 Major
- Heat 6/10 Major 7 d/yr ≥101°F today · 18 d/yr by 30 yrs out
- Wind 1/10 Low
- Air quality 2/10 Low 1 unhealthy d/yr today · 1 by 30 yrs out
Nearby sold comps map
Loading sold comps map…
Walkable amenities ~0.75 mi
Loading nearby amenities…
Taxation est. · year 1
- Rental income
- $23,576
- − Mortgage interest
- −$14,844
- − Property taxes
- −$3,975
- − Insurance
- −$1,325
- − Repairs & maintenance
- −$1,886
- − Management
- −$1,886
- − Depreciation
- −$7,709
- Taxable loss
- −$8,049
- Est. tax savings @ 24.0%
- +$1,932
- After-tax cash flow
- $-1,419/yr
For passive investors: Depreciation is non-cash, so a rental often shows a tax loss while cash-flowing — sheltering income. Rental losses are passive: they offset passive income freely, and up to $25,000/yr can offset ordinary (W-2) income if you actively participate and your MAGI is under $100k (phasing out to $0 by $150k); unused losses carry forward. On sale, claimed depreciation is recaptured at up to 25%, and gains may owe capital-gains tax (a 1031 exchange can defer both). Figures are a year-1 estimate at your 24.0% rate — not tax advice; consult a CPA.
Schools (NCES district)
- District
- Mayer Unified School District (4473)
- NCES district ID
- 0404820
- Math proficiency
- 23% ▼ -11.00%
- Reading proficiency
- 26% ▼ -13.00%
- Median HH income
- $35,108
- Composite
- 20.22/100
- National rank
- #8627
- State rank
- #165 of 249 in AZ
Livability — Cordes Lakes
- Score
- 60/100
- State rank
- #181
- US rank
- #19144
Category grades
Schools grade is shown separately in the Schools card above.
Census & demographics
- Census place
- Cordes Lakes, AZ
- Population (ZIP)
- 6,425
Population outlook (Yavapai County) Hauer SSP2
- Today (2025)
- 241,389 people
- By 2030
- 249,523 · +3.4%
- By 2040
- 259,966 · +7.7%
- By 2050
- 264,736 · +9.7%
- By 2075
- 269,334 · +11.6%
- By 2100
- 256,505 · +6.3%
Race, ethnicity, and origin ACS 2023
- Neighborhood character
- Predominantly White (77%)
- Race & ethnicity
- White 77% Two or more races 15% Hispanic / Latino 14%
- Hispanic origin (detail)
- Mexican 11% Puerto Rican 1%
- Common ancestry
- Lithuanian 6% Iranian 3% Romanian 3%
- Foreign-born
- 5% · Canada
- Languages at home
- 93% English-only · Spanish 6% Russian/Polish/Slavic 1%
Political lean MEDSL · Yavapai
- 2024 margin
- Solid R (+33.9) · D 32.6% · R 66.5%
- 2008→2024 swing
- -9.5pp toward R · 2008: -24.4pp · 2024: -33.9pp
- All cycles
- 2024: R+33.9 2020: R+29.3 2016: R+31.4 2012: R+30.7 2008: R+24.4
Not yet ingested
- Civics
- —
Market trends
- HPI YoY
- ▲ 55.51%
- Current HPI
- 376.0374
- Rent YoY
- —
- Metro
- —
- State GDP YoY
- ▲ 4.54%
- F500 in state
- 20
Industry mix (Fortune 500 HQ in AZ)
| Industry | F500 HQs | Revenue |
|---|---|---|
| Technology | 2 | $13B |
|
||
| Mining / Metals | 1 | $23B |
|
||
| Environmental Services | 1 | $16B |
|
||
| Metals / Steel | 1 | $14B |
|
||
| Technology Distribution | 1 | $9B |
|
||
| Homebuilding | 1 | $8B |
|
||
Price history
+1132.6% since first listed15 events — show timeline
- 2026-06-19 Listed $265,000 PAARMLS as Distributed by MLS Grid
- 2024-04-11 Pending — PAARMLS as Distributed by MLS Grid
- 2024-04-11 Sold (Public Records) $28,000 Public Records
- 2024-04-11 Sold (MLS) $28,000 PAARMLS as Distributed by MLS Grid
- 2024-03-13 Contingent — PAARMLS as Distributed by MLS Grid
- 2024-03-01 Listed $31,000 PAARMLS as Distributed by MLS Grid
- 2023-07-20 Listing Removed — PAARMLS as Distributed by MLS Grid
- 2023-06-22 Price Changed $23,400 PAARMLS as Distributed by MLS Grid
- 2023-03-30 Price Changed $24,400 PAARMLS as Distributed by MLS Grid
- 2023-03-22 Price Changed $25,400 PAARMLS as Distributed by MLS Grid
- 2023-01-25 Price Changed $26,500 PAARMLS as Distributed by MLS Grid
- 2022-12-27 Listed $27,500 PAARMLS as Distributed by MLS Grid
- 2022-12-21 Sold (Public Records) $36,000 Public Records
- 1997-03-25 Sold (Public Records) $21,500 Public Records
- 1997-03-04 Sold (Public Records) $21,500 Public Records
Property tax history
-1.7%/yrLatest (2025): $115 · +6.1% YoY. Source: county tax records.
Cash-flow waterfall
monthlySold comps — $/sqft
last 12 mo · ≤1 miLoading sold comps…