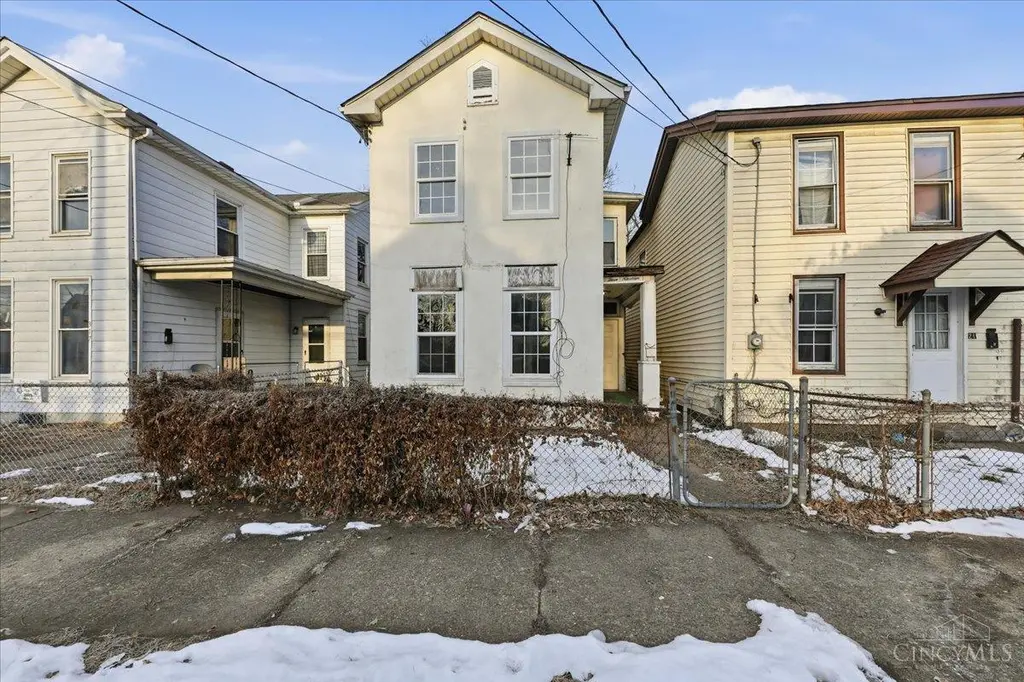
319 N Eleventh St · Hamilton, OH
Flood risk 1/10 · Minimal
- FEMA flood zone
- X (unshaded)
- Chance of flooding over 30 yrs
- 0.0%
- Est. flood insurance / yr
- $473 – $860
Fire risk 1/10 · Minimal
- Est. fire insurance / yr
- $713 – $1,323
Heat risk 4/10 · Minor
- Hot days now (above 104°F)
- 7 days/yr
- Hot days in 30 yrs
- 19 days/yr
Wind risk 2/10 · Minimal
- Chance of severe wind over 30 yrs
- 1.0%
Air-quality risk 3/10 · Minor
- Unhealthy air days now
- 2 days/yr
- Unhealthy air days in 30 yrs
- 3 days/yr
Risk factors via First Street. Map © Google.
Why this score? — see what drove the B+ grade
The composite is a weighted blend of 9 inputs, each scored 0–100. Each bar is that input's sub-score; the figure is the points it added to the 100-point composite (weight × sub-score).
- Cash flow +30.0/30.0
- ARV discount +14.9/15.0
- DSCR +10.0/10.0
- 1% rule +9.4/10.0
- Livability +3.7/5.0
- Schools +3.6/10.0
- Rent growth +3.2/5.0
- Condition / age +2.5/5.0
- Appreciation +0.0/10.0
$99,900
🖨 Deal sheet 📄 Offer letter ✓ Due diligence
Listing remarks MLS
Move in ready property in Hamilton. 3 bed 1 bath with 2 car detached garage. Would be a nice addition to your rental portfolio or you could add your own personal touches to renovate. agent owned
Key facts
- 3,485 sq ft lot
- 2 garage spots
- Built 1900
Neighborhood map
What this means for you Summary
Snapshot
- This is a 3-bed/1.0-bath single-family listed at $100k.
Deal economics
- At list price, monthly cash flow is $521 ($6k/yr) — positive.
- The deal already cash-flows at list — no discount required.
- Meets the 1% rule at list price ($1k rent vs $100k).
- Recommended offer: $88k (12.0% below list) — sets the bar for market timing.
- Cap rate 12.6% vs local median 4.6% in Hamilton — top-decile yield for the area; either an underpriced asset or a hidden risk that comps aren't pricing in. Stress-test before assuming the spread holds.
Location & tenants
- Location reads 73/100 on livability (#332 in OH) — a middle-class / working-renter tenant base. Strengths: cost of living A+, housing A+, schools B; Watch: crime C-, amenities C-, employment D.
- Hamilton City (suburban): math 42% / reading 45% proficiency, ranked #517 of 656 in OH (top 79%) — families likely to look elsewhere, expect single-tenant / working-renter base with shorter leases; 63% free/reduced lunch — lower-income household profile, screen leases tightly.
- Market conditions: Rents rising (+3.0%/yr); 196 active listings in the ZIP; 14 comparable units currently listed for rent nearby; rentals at typical pace (median 24d on market — plan ~3-4 weeks tenant-placement turnaround); solid renter incomes; 1,163 units permitted in Butler County in 2024 (356 in 5+ unit buildings).
Forward outlook
- Local home prices are declining (-3.0%/yr); year-one equity from $691 of loan paydown is wiped out by about $3k of value loss. Plan a longer hold.
- At projected returns (-3.0% appreciation + 3.0% rent growth), your $28k cash investment doubles in ~6 years — after that, you're playing with house money.
Negotiation context
- It's been on market 125 days — a 12% lower offer ($88k) is reasonable based on typical stale-listing flexibility.
- 5 sale attempts since 23y ago with the ask held roughly flat each time — persistent listings suggest the price (not the market) is what's stuck; bring a comps-based counter.
- Current owner paid $61k; list at $100k implies a 64% gain — meaningful room to come down on a strong offer.
Risks & watch-outs
- Watch-outs: built in 1900 — expect roof / HVAC / electrical / plumbing capex.
Questions for the listing agent
- It's been on market 125 days. Have you received any prior offers? Is the seller open to a 12% concession, seller financing, or rate buy-down credit?
- Built in 1900 — when were the roof, HVAC, electrical panel, plumbing, and water heater last replaced?
- Why hasn't it sold? Are there any deal-killer items the seller is aware of (foundation, flood, title, zoning, code violations)?
- Is there a deadline driving the sale (1031 exchange, divorce, estate, relocation)? That informs how much negotiation room exists.
- Schools are B-rated — typically a magnet for longer-tenancy family renters. What's the average tenant stay here, and is there a school-zone premium baked into asking?
- What's the average days-on-market for RENTAL listings here right now (not sales)? A rising rental-DOM trend means longer vacancies and softer asking-rent achievability than the comps imply.
- What's the recent tenant-quality profile in this submarket — average credit score on applications, eviction rate, late-payment / NSF rate, and stable-employment percentage? A property-management company in the area should have these aggregated.
- How much new for-sale + rental construction is in the pipeline within 1–3 miles? Heavy new supply typically softens prices + rents 12–24 months out; constrained supply supports both.
Investment metrics
- 1% rule
- 1.44% ✓
- Cap rate
- 12.55%
- Cash-on-cash
- 22.36%
- DSCR
- 1.99
- GRM
- 5.8
CMA / ARV
- ARV (median comp)
- $119,452
- List price
- $99,900
- Delta
- -16.37%
- Verdict
- UNDERPRICED
- Comps
- 20 within 1.0 mi
Show comp detail 12 sales within ~0.75 mi
| Address | Dist | Beds/Ba | Sqft | Sold | Price | $/sf | Match |
|---|---|---|---|---|---|---|---|
| 922 Vine St | 0.33mi | 3/2.5 | 1,256 (+3%) | 0mo | $215,000 | $171 | 74 |
| 1019 Buckeye St | 0.05mi | 3/1.0 | 1,398 (+14%) | 8mo | $112,900 | $81 | 68 |
| 1303 Campbell Ave | 0.32mi | 2/1.0 (-1) | 1,136 (-7%) | 2mo | $180,000 | $158 | 67 |
| 130 Lulu | 0.54mi | 3/1.0 | 1,290 (+5%) | 2mo | $175,000 | $136 | 64 |
| 842 Heaton St | 0.19mi | 3/1.5 | 1,400 (+14%) | 4mo | $108,750 | $78 | 62 |
| 827 Greenwood Ave | 0.25mi | 2/1.0 (-1) | 1,072 (-12%) | 1mo | $155,000 | $145 | 62 |
| 518 Vine St | 0.46mi | 3/1.0 | 1,332 (+9%) | 3mo | $105,000 | $79 | 62 |
| 602 S Thirteenth St | 0.66mi | 3/1.5 | 1,270 (+4%) | 6mo | $68,000 | $54 | 56 |
| 1103 Reservoir St | 0.40mi | 3/1.0 | 1,056 (-14%) | 7mo | $109,000 | $103 | 52 |
| 1416 Maple Ave | 0.48mi | 2/1.0 (-1) | 1,120 (-8%) | 8mo | $175,000 | $156 | 52 |
| 75 N Fair Ave | 0.47mi | 2/1.0 (-1) | 1,050 (-14%) | 3mo | $140,000 | $133 | 47 |
| 1709 Helen Ave | 0.70mi | 3/1.0 | 1,092 (-11%) | 6mo | $176,000 | $161 | 45 |
Match score weights: distance 35% · size 25% · config 20% · recency 20%. Top-matched comps best support the ARV.
Projected returns pro-forma
-3.0% appreciation · 2.95% rent growth · sell at horizon
- IRR
- 15.1%
- Equity multiple
- 1.60×
- Total profit
- $16,915
- Equity at exit
- $14,895
- IRR
- 23.7%
- Equity multiple
- 3.04×
- Total profit
- $57,085
- Equity at exit
- $8,638
Cash invested: $27,972 (down + closing). Projections, not guarantees.
Landlord ↔ Tenant lean methodology
- Overall (STATE)
- 73 Landlord-Friendly
- State Ohio
- 73 Landlord-Friendly · R+6
- County
- — inherits STATE
- City
- — inherits STATE
ZIP-level market 45011
- Rents YoY
- 3.0%
- Active inventory
- 196
- Price-to-rent
- 5.8×
Monthly cashflow live
- Estimated rent
- $1,440 high interval (Pro) →
- Mortgage (P&I)
- −$524
- Tax from tax record
- −$51 /mo · $612/yr
- Insurance
- −$42
- HOA
- −$0
- Vacancy / Maint / Mgmt
- −$302
- Net cashflow
- $521
Break-even live
UW: 25.0% down · 7.5% · 30yr · 1.5% tax · 5.0% vac · 8.0% maint · 8.0% mgmt
Financing live
Cash to close
- Down payment
- $24,975
- Closing costs
- $2,997
- Reserves months
- —
- Total cash needed
- —
Loan-product check · same deal, 3 products live
Conventional
25% down · 7.5% · 30yr
- Down + closing
- —
- Monthly P&I
- —
- Monthly cashflow
- —
- DSCR
- —
- Eligible?
- —
Personal DTI + credit; lowest rate.
DSCR
20% down · 8.5% · 30yr
- Down + closing
- —
- Monthly P&I
- —
- Monthly cashflow
- —
- DSCR
- —
- Eligible?
- —
No personal income docs; deal must DSCR.
Hard money
10% down · 12.0% · 12mo
- Down + closing
- —
- Monthly P&I
- —
- Monthly cashflow
- —
- DSCR
- —
- Eligible?
- —
Short-term bridge; refi at stabilization.
Rent comps 14 comps
| Address | Beds | Baths | Sqft | Rent | $/sqft | DOM | Units | Dist |
|---|---|---|---|---|---|---|---|---|
| 1025 Heaton St Hamilton, OH | 2.0 | 1.0 | 1436 | $1,025 | $0.71 | 23d | 1 | 0.04mi |
| 906 Vine St Hamilton, OH | 3.0 | 2.0 | 1152 | $1,250 | $1.09 | 19d | 1 | 0.32mi |
| 829 Maple Ave Unit 3 Hamilton, OH | 3.0 | 1.0 | 1097 | $945 | $0.86 | 43d | 1 | 0.46mi |
| 1719 Shirley Ave Hamilton, OH | 3.0 | 1.0 | 1135 | $1,525 | $1.34 | 1d | 1 | 0.77mi |
| 115 Dayton St Unit MAR-201 Hamilton, OH | 2.0 | 2.0 | 1040 | $1,775 | $1.71 | 4d | 1 | 0.82mi |
| 969 Harmon Ave Hamilton, OH | 3.0 | 1.0 | 1350 | $1,695 | $1.26 | 43d | 1 | 0.83mi |
| 967 Shuler Ave Hamilton, OH | 3.0 | 2.0 | 1466 | $1,795 | $1.22 | 43d | 1 | 0.85mi |
| 358 Hampshire Dr Unit 1FNA-49401 Hamilton, OH | 2.0 | 1.0 | 788 | $1,200 | $1.52 | 7d | 1 | 1.14mi |
| 358 Hampshire Dr Hamilton, OH | 1.0–2.0 | 1.0 | 687 | $1,250 | $1.82 | 1d | 23 | 1.14mi |
| 1310 Shuler Ave Unit 2 Hamilton, OH | 2.0 | 1.0 | 976 | $895 | $0.92 | 23d | 1 | 1.19mi |
| 307 N E St Hamilton, OH | 4.0 | 1.5 | 1466 | $1,450 | $0.99 | 43d | 1 | 1.32mi |
| 1118 Bonacker Ave Unit 1116 Hamilton, OH | 2.0 | 1.0 | 1000 | $1,195 | $1.20 | 43d | 1 | 1.32mi |
| 432 Park Ave Hamilton, OH | 3.0 | 1.0 | 1276 | $1,300 | $1.02 | 3d | 1 | 1.32mi |
| 417 Franklin St Hamilton, OH | 3.0 | 1.0 | 1256 | $1,150 | $0.92 | 1d | 1 | 1.41mi |
Listing history 25 events
-
2026-06-18days on market $99,900 Active 125 DOM
-
2026-06-17days on market $99,900 Active 124 DOM
-
2026-06-16days on market $99,900 Active 123 DOM
-
2026-06-15days on market $99,900 Active 122 DOM
-
2026-06-13days on market $99,900 Active 120 DOM
-
2026-06-13days on market $99,900 Active 119 DOM
-
2026-06-09days on market $99,900 Active 116 DOM
-
2026-06-08days on market $99,900 Active 115 DOM
-
2026-06-07days on market $99,900 Active 114 DOM
-
2026-06-03days on market $99,900 Active 110 DOM
-
2026-06-02days on market $99,900 Active 109 DOM
-
2026-06-01days on market $99,900 Active 108 DOM
-
2026-05-31days on market $99,900 Active 107 DOM
-
2026-04-01status Active 194-char remark
Show marketing remark (194 chars)
Move in ready property in Hamilton. 3 bed 1 bath with 2 car detached garage. Would be a nice addition to your rental portfolio or you could add your own personal touches to renovate. agent owned
-
2026-03-17historical Contingency Pending 194-char remark
Show marketing remark (194 chars)
Move in ready property in Hamilton. 3 bed 1 bath with 2 car detached garage. Would be a nice addition to your rental portfolio or you could add your own personal touches to renovate. agent owned
-
2026-02-23price $99,900 194-char remark
Show marketing remark (194 chars)
Move in ready property in Hamilton. 3 bed 1 bath with 2 car detached garage. Would be a nice addition to your rental portfolio or you could add your own personal touches to renovate. agent owned
-
2026-02-19soldstatus $61,000
-
2026-02-13$104,900 Active 194-char remark
Show marketing remark (194 chars)
Move in ready property in Hamilton. 3 bed 1 bath with 2 car detached garage. Would be a nice addition to your rental portfolio or you could add your own personal touches to renovate. agent owned
-
2011-06-15historical
-
2010-12-14$49,900
-
2004-04-19soldstatus $37,000
-
2004-03-03$42,900
-
2003-08-22historical
-
2003-03-21$50,000
-
1975-05-01soldstatus $18,900
ⓘ Source: listings_history table (triggers on properties + properties_extension) + one-shot
backfill from property_details.listing_events for pre-trigger history.
Tax reassessment forecast OH · Partial reset (capped growth)
- Current annual tax
- $612 · $51/mo
- Projected year-2 tax
- $1,085 · $90/mo
- Expected delta
- +$473/yr (+$39/mo · 77.4%)
ⓘ Screening estimate from a state-policy table — verify with the county assessor before closing.
Climate risk First Street
- Flood 1/10 Low FEMA zone X (unshaded) · 0% chance over 30 yrs
- Wildfire 1/10 Low
- Heat 4/10 Moderate 7 d/yr ≥104°F today · 19 d/yr by 30 yrs out
- Wind 2/10 Low 100% chance of damaging wind over 30 yrs
- Air quality 3/10 Moderate 2 unhealthy d/yr today · 3 by 30 yrs out
Nearby sold comps map
Loading sold comps map…
Walkable amenities ~0.75 mi
Loading nearby amenities…
Taxation est. · year 1
- Rental income
- $17,282
- − Mortgage interest
- −$5,596
- − Property taxes
- −$612
- − Insurance
- −$500
- − Repairs & maintenance
- −$1,383
- − Management
- −$1,383
- − Depreciation
- −$2,906
- Taxable income
- $4,904
- Est. tax owed @ 24.0%
- −$1,177
- After-tax cash flow
- $5,078/yr
For passive investors: Depreciation is non-cash, so a rental often shows a tax loss while cash-flowing — sheltering income. Rental losses are passive: they offset passive income freely, and up to $25,000/yr can offset ordinary (W-2) income if you actively participate and your MAGI is under $100k (phasing out to $0 by $150k); unused losses carry forward. On sale, claimed depreciation is recaptured at up to 25%, and gains may owe capital-gains tax (a 1031 exchange can defer both). Figures are a year-1 estimate at your 24.0% rate — not tax advice; consult a CPA.
Schools (NCES district)
- District
- Hamilton City
- NCES district ID
- 3904410
- Math proficiency
- 42% ▼ -13.00%
- Reading proficiency
- 45% ▼ -10.00%
- Median HH income
- $40,488
- Composite
- 36.48/100
- National rank
- #4656
- State rank
- #517 of 656 in OH
Livability — Hamilton
- Score
- 73/100
- State rank
- #332
- US rank
- #5467
Category grades
Schools grade is shown separately in the Schools card above.
Census & demographics
- Census place
- Hamilton, OH
- County
- Butler County · 381,674 people
- City population
- 140,900
- Metro
- Cincinnati, OH-KY-IN
- Population (ZIP)
- 75,864
- Household income
- $91,873
- Rent vs Own
- Severe rent burden
- 1795.0
Population outlook (Butler County) Hauer SSP2
- Today (2025)
- 387,706 people
- By 2030
- 392,028 · +1.1%
- By 2040
- 395,307 · +2.0%
- By 2050
- 391,116 · +0.9%
- By 2075
- 378,642 · -2.3%
- By 2100
- 343,248 · -11.5%
Race, ethnicity, and origin ACS 2023
- Neighborhood character
- Predominantly White (68%)
- Race & ethnicity
- White 68% Hispanic / Latino 12% Black 11% Two or more races 9% Asian 4%
- Hispanic origin (detail)
- Mexican 7%
- Common ancestry
- Romanian 2% Italian 2% Slovak 2%
- Foreign-born
- 11% · Canada, Vietnam, China
- Languages at home
- 86% English-only · Spanish 8% Other Indo-European 2% Vietnamese 1%
Political lean MEDSL · Butler
- 2024 margin
- Strong R (+26.3) · D 36.4% · R 62.7%
- 2008→2024 swing
- -3.6pp toward R · 2008: -22.6pp · 2024: -26.3pp
- All cycles
- 2024: R+26.3 2020: R+24.0 2016: R+28.3 2012: R+26.2 2008: R+22.6
Not yet ingested
- Civics
- —
Market trends
- HPI YoY
- ▼ -188.67%
- Current HPI
- 259.7868
- Rent YoY
- ▲ 2.95%
- Metro
- Cincinnati, OH-KY-IN
- State GDP YoY
- ▲ 1.98%
- F500 in state
- 48
Industry mix (Fortune 500 HQ in OH)
| Industry | F500 HQs | Revenue |
|---|---|---|
| Insurance | 3 | $145B |
|
||
| Industrial Machinery | 3 | $49B |
|
||
| Financial Services | 3 | $24B |
|
||
| Consumer Goods | 2 | $93B |
|
||
| Aerospace / Defense | 2 | $47B |
|
||
| Utilities | 2 | $33B |
|
||
Price history
+428.6% since first listed12 events — show timeline
- 2026-04-01 Relisted — Cincy MLS
- 2026-03-17 Contingent — Cincy MLS
- 2026-02-23 Price Changed $99,900 Cincy MLS
- 2026-02-19 Sold (Public Records) $61,000 Public Records
- 2026-02-13 Listed $104,900 Cincy MLS
- 2011-06-15 Listing Removed — Cincy MLS
- 2010-12-14 Listed $49,900 Cincy MLS
- 2004-04-19 Sold (MLS) $37,000 Cincy MLS
- 2004-03-03 Listed $42,900 Cincy MLS
- 2003-08-22 Listing Removed — Cincy MLS
- 2003-03-21 Listed $50,000 Cincy MLS
- 1975-05-01 Sold (Public Records) $18,900 Public Records
Property tax history
+5.1%/yrLatest (2025): $612 · +0.5% YoY. Source: county tax records.
Cash-flow waterfall
monthlySold comps — $/sqft
last 12 mo · ≤1 miLoading sold comps…