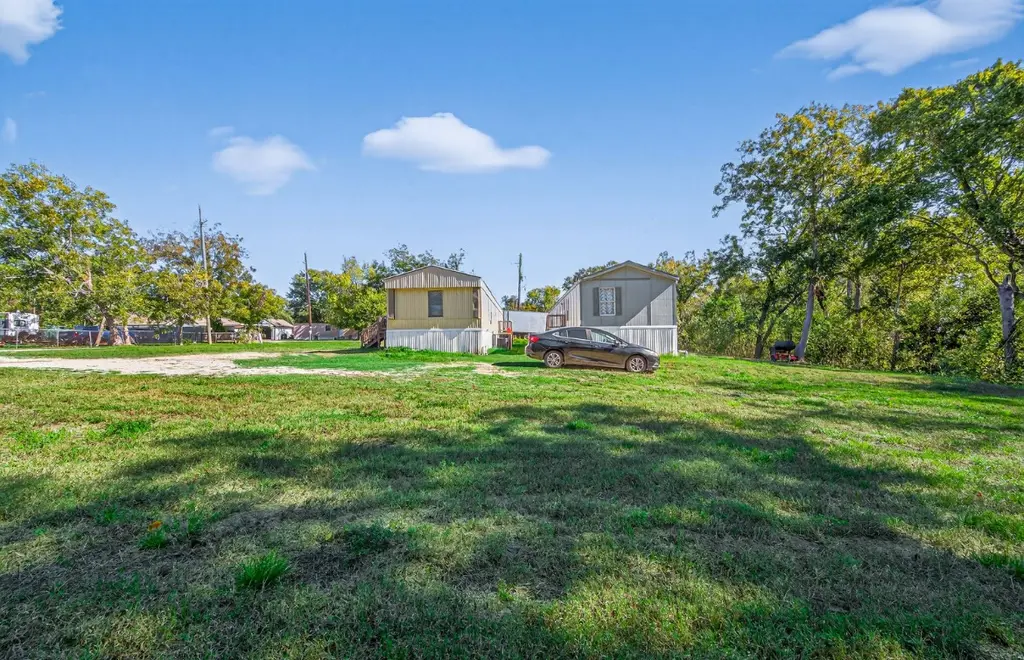
5807 Fletcher · Crosby, TX
Flood risk 4/10 · Minor
- FEMA flood zone
- X (shaded)
- Chance of flooding over 30 yrs
- 0.21%
- Est. flood insurance / yr
- $507 – $1,088
Fire risk 5/10 · Moderate
- Est. fire insurance / yr
- $1,222 – $2,270
Heat risk 9/10 · Severe
- Hot days now (above 110°F)
- 7 days/yr
- Hot days in 30 yrs
- 24 days/yr
Wind risk 9/10 · Severe
- Chance of severe wind over 30 yrs
- 99.0%
Air-quality risk 2/10 · Minimal
- Unhealthy air days now
- 2 days/yr
- Unhealthy air days in 30 yrs
- 2 days/yr
Risk factors via First Street. Map © Google.
Why this score? — see what drove the F grade
The composite is a weighted blend of 9 inputs, each scored 0–100. Each bar is that input's sub-score; the figure is the points it added to the 100-point composite (weight × sub-score).
- Cash flow +8.7/30.0
- ARV discount +7.5/15.0
- Condition / age +3.8/5.0
- Schools +3.5/10.0
- Livability +3.0/5.0
- Rent growth +2.9/5.0
- DSCR +2.4/10.0
- 1% rule +2.0/10.0
- Appreciation +0.0/10.0
$275,000
🖨 Deal sheet (PDF) 📄 Offer letter ✓ Due diligence
Listing remarks MLS
Income-Producing Property with Growth Potential! This property features two income-generating mobile homes with tenants in place and space for two additional homes. Each existing unit has separate utilities and established rental income. Excellent opportunity for investors seeking to expand cash flow or develop a small mobile home community.
Key facts
- Separate utilities
- 0.38 acre lot
- Built 2015
Tags
Neighborhood map
What this means for you Summary
Snapshot
- This is a 3-bed/2.0-bath manufactured listed at $275k. Condition is rated good.
Deal economics
- At list price, monthly cash flow is $-231 ($-3k/yr) — negative.
- To cash-flow at today's rent, offer at most $234k (14.8% below list).
- To meet the 1% rule (rent ≥ 1% of price), the offer needs to be $192k (30.1% below list).
- Recommended offer: $192k (30.1% below list) — sets the bar for 1% rule.
Location & tenants
- Location reads 59/100 on livability (#1,121 in TX) — a working-class tenant base; expect higher turnover. Strengths: cost of living A+, crime A, housing A; Watch: amenities F, commute F, employment F.
- Crosby ISD (rural): math 39% / reading 40% proficiency, ranked #369 of 826 in TX (top 45%) — families likely to look elsewhere, expect single-tenant / working-renter base with shorter leases.
- Zoned schools: Crosby Middle (math 36% / reading 37%, grade F, #786 of 1,662 statewide, top 48%, 1,549 students, 60% FRL); Crosby H S (math 44% / reading 45%, grade F, #652 of 1,632 statewide, top 43%, 1,937 students, 54% FRL).
- Market conditions: Rents rising (+1.5%/yr); 1189 active listings in the ZIP; 1 comparable units currently listed for rent nearby; solid renter incomes; 29,883 units permitted in Harris County in 2024 (8,621 in 5+ unit buildings).
Forward outlook
- Local home prices are declining (-3.0%/yr); year-one equity from $2k of loan paydown is wiped out by about $8k of value loss. Plan a longer hold.
- Harris County population projected at +47% by 2050 — long-run rental-demand tailwind backs the buy-and-hold thesis.
Negotiation context
- It's been on market 229 days — a 12% lower offer ($242k) is reasonable based on typical stale-listing flexibility.
- 3 sale attempts; this cycle's ask has dropped $125k (31%) from the opening price — seller is motivated, your offer sets the floor, not the list.
Risks & watch-outs
- Climate carrying-cost: severe wind risk, 99% chance of damaging wind over 30y; moderate wildfire risk; extreme-heat days projected 7→24/yr by 2055 (HVAC capex compounding) — expect insurance premiums to compound above CPI over the hold.
Questions for the listing agent
- What do current leases actually rent for vs. the listed asking? Can we see a recent rent roll and the last 12 months of T-12 income?
- It's been on market 229 days. Have you received any prior offers? Is the seller open to a 30% concession, seller financing, or rate buy-down credit?
- Why hasn't it sold? Are there any deal-killer items the seller is aware of (foundation, flood, title, zoning, code violations)?
- Is there a deadline driving the sale (1031 exchange, divorce, estate, relocation)? That informs how much negotiation room exists.
- Schools are D-rated, which usually means shorter tenancies and higher turnover. Who's the typical renter profile here, and what's been the actual vacancy rate?
- The area grade is low — what's the realistic commute time and amenity access for the typical tenant pool here? Any planned neighborhood developments (good or bad) we should know about?
- What's the average days-on-market for RENTAL listings here right now (not sales)? A rising rental-DOM trend means longer vacancies and softer asking-rent achievability than the comps imply.
- What's the recent tenant-quality profile in this submarket — average credit score on applications, eviction rate, late-payment / NSF rate, and stable-employment percentage? A property-management company in the area should have these aggregated.
- How much new for-sale + rental construction is in the pipeline within 1–3 miles? Heavy new supply typically softens prices + rents 12–24 months out; constrained supply supports both.
Investment metrics
- 1% rule
- 0.70% ✗
- Cap rate
- 5.29%
- Cash-on-cash
- -3.60%
- DSCR
- 0.84
- GRM
- 11.9
CMA / ARV
No comps found within radius.
Projected returns pro-forma
-3.0% appreciation · 1.48% rent growth · sell at horizon
- IRR
- -23.9%
- Equity multiple
- 0.19×
- Total profit
- $-62,224
- Equity at exit
- $41,003
- IRR
- -23.5%
- Equity multiple
- -0.10×
- Total profit
- $-84,900
- Equity at exit
- $23,777
Cash invested: $77,000 (down + closing). Projections, not guarantees.
Landlord ↔ Tenant lean methodology
- Overall (STATE)
- 87 Strongly Landlord-Friendly
- State Texas
- 87 Strongly Landlord-Friendly · R+5
- County
- — inherits STATE
- City
- — inherits STATE
ZIP-level market 77532
- Home prices YoY
- -28.6%
- Rents YoY
- 1.5%
- Active inventory
- 1189
- Price-to-rent
- 11.9×
Monthly cashflow live
- Estimated rent
- $1,922 medium interval (Pro) →
- Mortgage (P&I)
- −$1,442
- Tax from tax record
- −$192 /mo · $2,307/yr
- Insurance
- −$115
- HOA
- −$0
- Vacancy / Maint / Mgmt
- −$404
- Net cashflow
- $-231
Break-even live
Sensitivity live
| Price | -10% $-75 | -5% $-153 | +0% $-231 | +5% $-309 | +10% $-387 |
|---|---|---|---|---|---|
| Rent | -10% $-383 | -5% $-307 | +0% $-231 | +5% $-155 | +10% $-79 |
| Rate | -1.0pp $-92 | -0.5pp $-161 | base $-231 | +0.5pp $-302 | +1.0pp $-375 |
UW: 25.0% down · 7.5% · 30yr · 1.5% tax · 5.0% vac · 8.0% maint · 8.0% mgmt
Financing live
Cash to close
- Down payment
- $68,750
- Closing costs
- $8,250
- Reserves months
- —
- Total cash needed
- —
Loan-product check · same deal, 3 products live
Conventional
25% down · 7.5% · 30yr
- Down + closing
- —
- Monthly P&I
- —
- Monthly cashflow
- —
- DSCR
- —
- Eligible?
- —
Personal DTI + credit; lowest rate.
DSCR
20% down · 8.5% · 30yr
- Down + closing
- —
- Monthly P&I
- —
- Monthly cashflow
- —
- DSCR
- —
- Eligible?
- —
No personal income docs; deal must DSCR.
Hard money
10% down · 12.0% · 12mo
- Down + closing
- —
- Monthly P&I
- —
- Monthly cashflow
- —
- DSCR
- —
- Eligible?
- —
Short-term bridge; refi at stabilization.
Rent comps 1 comps
| Address | Beds | Baths | Sqft | Rent | $/sqft | DOM | Units | Dist |
|---|---|---|---|---|---|---|---|---|
| 430 Fishhawk Way Crosby, TX | 3.0 | 2.0 | 1369 | $1,783 | $1.30 | 1d | 1 | 1.29mi |
Listing history 21 events
-
2026-06-18days on market $275,000 Active 229 DOM
-
2026-06-17days on market $275,000 Active 228 DOM
-
2026-06-16days on market $275,000 Active 227 DOM
-
2026-06-15days on market $275,000 Active 226 DOM
-
2026-06-13days on market $275,000 Active 224 DOM
-
2026-06-09days on market $275,000 Active 220 DOM
-
2026-06-08days on market $275,000 Active 219 DOM
-
2026-06-07days on market $275,000 Active 218 DOM
-
2026-06-04days on market $275,000 Active 215 DOM
-
2026-06-03days on market $275,000 Active 214 DOM
-
2026-06-02days on market $275,000 Active 213 DOM
-
2026-06-01days on market $275,000 Active 212 DOM
-
2026-05-31days on market $275,000 Active 211 DOM
-
2026-05-20price $275,000 344-char remark
Show marketing remark (344 chars)
Income-Producing Property with Growth Potential! This property features two income-generating mobile homes with tenants in place and space for two additional homes. Each existing unit has separate utilities and established rental income. Excellent opportunity for investors seeking to expand cash flow or develop a small mobile home community.
-
2026-02-22price $345,000 344-char remark
Show marketing remark (344 chars)
Income-Producing Property with Growth Potential! This property features two income-generating mobile homes with tenants in place and space for two additional homes. Each existing unit has separate utilities and established rental income. Excellent opportunity for investors seeking to expand cash flow or develop a small mobile home community.
-
2026-01-20price $390,000 344-char remark
Show marketing remark (344 chars)
Income-Producing Property with Growth Potential! This property features two income-generating mobile homes with tenants in place and space for two additional homes. Each existing unit has separate utilities and established rental income. Excellent opportunity for investors seeking to expand cash flow or develop a small mobile home community.
-
2025-11-01$400,000 Active 344-char remark
Show marketing remark (344 chars)
Income-Producing Property with Growth Potential! This property features two income-generating mobile homes with tenants in place and space for two additional homes. Each existing unit has separate utilities and established rental income. Excellent opportunity for investors seeking to expand cash flow or develop a small mobile home community.
-
2025-07-10historical
-
2025-07-09$1,400 Active
-
2025-02-08historical $1,700
-
2025-01-29$1,700
ⓘ Source: listings_history table (triggers on properties + properties_extension) + one-shot
backfill from property_details.listing_events for pre-trigger history.
Tax reassessment forecast TX · Resets to sale price
- Current annual tax
- $2,307 · $192/mo
- Projected year-2 tax
- $5,032 · $419/mo
- Expected delta
- +$2,725/yr (+$227/mo · 118.1%)
ⓘ Screening estimate from a state-policy table — verify with the county assessor before closing.
Climate risk First Street
- Flood 4/10 Moderate FEMA zone X (shaded) · 21% chance over 30 yrs
- Wildfire 5/10 Major
- Heat 9/10 Extreme 7 d/yr ≥110°F today · 24 d/yr by 30 yrs out
- Wind 9/10 Extreme 99% chance of damaging wind over 30 yrs
- Air quality 2/10 Low 2 unhealthy d/yr today · 2 by 30 yrs out
Nearby sold comps map
Loading sold comps map…
Walkable amenities ~0.75 mi
Loading nearby amenities…
Taxation est. · year 1
- Rental income
- $23,060
- − Mortgage interest
- −$15,404
- − Property taxes
- −$2,307
- − Insurance
- −$1,375
- − Repairs & maintenance
- −$1,845
- − Management
- −$1,845
- − Depreciation
- −$8,000
- Taxable loss
- −$7,716
- Est. tax savings @ 24.0%
- +$1,852
- After-tax cash flow
- $-918/yr
For passive investors: Depreciation is non-cash, so a rental often shows a tax loss while cash-flowing — sheltering income. Rental losses are passive: they offset passive income freely, and up to $25,000/yr can offset ordinary (W-2) income if you actively participate and your MAGI is under $100k (phasing out to $0 by $150k); unused losses carry forward. On sale, claimed depreciation is recaptured at up to 25%, and gains may owe capital-gains tax (a 1031 exchange can defer both). Figures are a year-1 estimate at your 24.0% rate — not tax advice; consult a CPA.
Condition & rehab AI · 12 photos
This income-producing property features two mobile homes with tenants in place and space for two additional homes. The home is in good condition with minimal repairs needed, and there are several high-ROI updates that can further increase its value.
Value-add opportunities
- Both Painting the exterior and interior walls — Fresh paint can improve the home's curb appeal and interior aesthetics.
- Both Landscaping the front yard — A well-maintained front yard can enhance the home's curb appeal and attract potential buyers/tenants.
- Resale Upgrading the appliances in the kitchen — Modern appliances can make the home more appealing to potential buyers.
- Resale Upgrading the flooring in the bathrooms — Upgraded flooring can make the bathrooms more appealing to potential buyers.
- Both Upgrading the HVAC system — A new HVAC system can improve the home's comfort and energy efficiency, attracting both buyers and tenants.
- Both Upgrading the exterior siding — A new exterior siding can improve the home's curb appeal and energy efficiency, attracting both buyers and tenants.
Renovation cost estimate screening
Value-add ROI direction
- Both Painting the exterior and interior walls — Fresh paint can improve the home's curb appeal and interior aesthetics. ↑
- Both Landscaping the front yard — A well-maintained front yard can enhance the home's curb appeal and attract potential buyers/tenants. ↑
- Resale Upgrading the appliances in the kitchen — Modern appliances can make the home more appealing to potential buyers. ↑
- Resale Upgrading the flooring in the bathrooms — Upgraded flooring can make the bathrooms more appealing to potential buyers. ↑
- Both Upgrading the HVAC system — A new HVAC system can improve the home's comfort and energy efficiency, attracting both buyers and tenants. ↑
- Both Upgrading the exterior siding — A new exterior siding can improve the home's curb appeal and energy efficiency, attracting both buyers and tenants. ↑
ⓘ Cost ranges are severity-bucket heuristics (US national rule-of-thumb). Get contractor quotes + a written scope before underwriting a rehab budget.
Schools (NCES district)
- District
- Crosby ISD
- NCES district ID
- 4815750
- Math proficiency
- 39% ▼ -13.00%
- Reading proficiency
- 40% ▼ -5.00%
- Median HH income
- $61,079
- Composite
- 35.14/100
- National rank
- #5012
- State rank
- #369 of 826 in TX
Livability — Crosby
- Score
- 59/100
- State rank
- #1121
- US rank
- #19783
Category grades
Schools grade is shown separately in the Schools card above.
Census & demographics
- Census place
- Crosby, TX
- County
- Harris County · 4,702,590 people
- Metro
- Houston-The Woodlands-Sugar Land, TX
- Population (ZIP)
- 33,780
- Household income
- $92,201
- Rent vs Own
- Severe rent burden
- 382.0
Population outlook (Harris County) Hauer SSP2
- Today (2025)
- 5,571,493 people
- By 2030
- 6,089,821 · +9.3%
- By 2040
- 7,142,806 · +28.2%
- By 2050
- 8,185,864 · +46.9%
- By 2075
- 10,574,329 · +89.8%
- By 2100
- 12,109,958 · +117.4%
Race, ethnicity, and origin ACS 2023
- Neighborhood character
- Diverse neighborhood (Simpson 0.60)
- Race & ethnicity
- White 54% Hispanic / Latino 31% Two or more races 16% Black 9%
- Hispanic origin (detail)
- Mexican 24%
- Common ancestry
- Lithuanian 4% Romanian 3% Italian 2%
- Foreign-born
- 10% · Canada
- Languages at home
- 78% English-only · Spanish 21%
Political lean MEDSL · Harris
- 2024 margin
- Lean D (+5.5) · D 52.0% · R 46.4% · Other 1.6%
- 2008→2024 swing
- +3.9pp toward D · 2008: 1.6pp · 2024: 5.5pp
- All cycles
- 2024: D+5.5 2020: D+13.3 2016: D+12.4 2012: D+0.1 2008: D+1.6
Not yet ingested
- Civics
- —
Market trends
- HPI YoY
- ▼ -105.63%
- Current HPI
- 264.0126
- Rent YoY
- ▲ 1.48%
- Metro
- Houston-The Woodlands-Sugar Land, TX
- State GDP YoY
- ▲ 3.95%
- F500 in state
- 110
Industry mix (Fortune 500 HQ in TX)
| Industry | F500 HQs | Revenue |
|---|---|---|
| Energy | 16 | $1,198B |
|
||
| Technology | 5 | $198B |
|
||
| Engineering / Construction | 4 | $72B |
|
||
| Energy Services | 3 | $60B |
|
||
| Utilities | 3 | $41B |
|
||
| Healthcare | 2 | $330B |
|
||
Price history
+16076.5% since first listed8 events — show timeline
- 2026-05-20 Price Changed $275,000 HARMLS
- 2026-02-22 Price Changed $345,000 HARMLS
- 2026-01-20 Price Changed $390,000 HARMLS
- 2025-11-01 Listed $400,000 HARMLS
- 2025-07-10 Listing Removed — HARMLS
- 2025-07-09 Listed $1,400 HARMLS
- 2025-02-08 Rental Removed $1,700 HARMLS
- 2025-01-29 Listed for Rent $1,700 HARMLS
Property tax history
+52.3%/yrLatest (2025): $2,307 · -4.9% YoY. Source: county tax records.
Cash-flow waterfall
monthlySold comps — $/sqft
last 12 mo · ≤1 miLoading sold comps…