 Multi-family
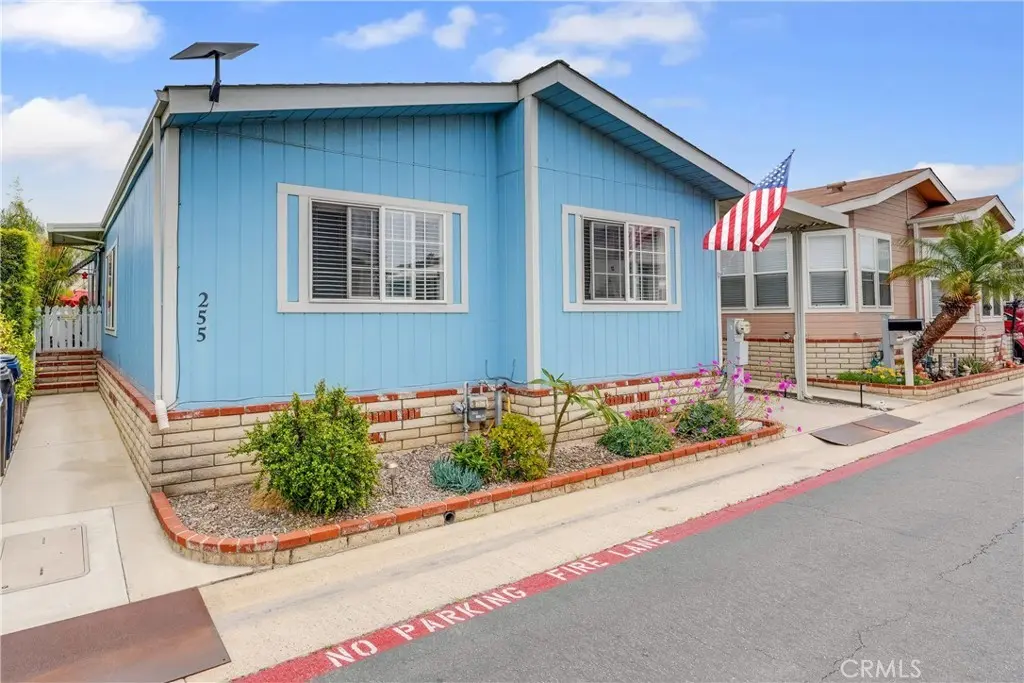
21851 Newland · Huntington Beach, CA
Flood risk 10/10 · Severe
- FEMA flood zone
- X
- Chance of flooding over 30 yrs
- 0.99%
- Est. flood insurance / yr
- $507 – $1,088
Fire risk 1/10 · Minimal
- Est. fire insurance / yr
- $659 – $1,223
Heat risk 5/10 · Moderate
- Hot days now (above 82°F)
- 7 days/yr
- Hot days in 30 yrs
- 23 days/yr
Wind risk 1/10 · Minimal
- Chance of severe wind over 30 yrs
- —
Air-quality risk 4/10 · Minor
- Unhealthy air days now
- 5 days/yr
- Unhealthy air days in 30 yrs
- 5 days/yr
Risk factors via First Street. Map © Google.
Why this score? — see what drove the B grade
The composite is a weighted blend of 9 inputs, each scored 0–100. Each bar is that input's sub-score; the figure is the points it added to the 100-point composite (weight × sub-score).
- Cash flow +30.0/30.0
- 1% rule +10.0/10.0
- DSCR +10.0/10.0
- ARV discount +7.5/15.0
- Schools +6.5/10.0
- Livability +3.4/5.0
- Rent growth +2.8/5.0
- Condition / age +2.5/5.0
- Appreciation +0.0/10.0
$134,900
🖨 Deal sheet 📄 Offer letter ✓ Due diligence
Multi-family units
County records classify this as Multi-Family (5+ Unit). Listing-text estimate: 1 unit. estimate disagrees with records
5+ unit building — per-unit beds/baths from public records are typically unavailable; the breakdown below (if shown) is an estimate from the listing text.
Listing remarks
Welcome to Huntington by the Sea, one of Huntington Beach's most desirable gated coastal communities. This beautifully maintained, turnkey 3 bedroom, 2 bathroom home offers approximately 1,080 square feet of comfortable living space and is ready for immediate enjoyment. Recent upgrades include fresh interior and exterior paint, a newer roof approximately 2 years old, a new foundation, updated primary bathroom and a newer dishwasher. The functional kitchen flows seamlessly into the living areas, while the separate indoor laundry room features a newer high capacity stackable washer and dryer for added convenience. Step outside through the sliding glass door to your own private, fenced backyar
Key facts
- New foundation
- Newer dishwasher
- Newer roof
Tags
Property features AI
Finance
- Other: Rent includes trash, pool, water and sewer (if applicable to lease)
- Financial info: Land lease applies (park land lease)
- HOA & community: Community amenities include pool and spa; Community features: curbs, street lighting, storm drains, sidewalks, suburban setting
Exterior
- Parking: Carport with 2 spaces; Guest parking available; Private road frontage
- Security: 24-hour security; Smoke detector; Gated community with automatic gate; Resident manager on site
- Utilities: Public/district water connected; Public sewer (sewer paid); Water and sewer connected
- Home design: Manufactured/mobile home (90086 Champion model); Single-story; Entry at ground level; Has a view
- Construction: Wood construction; Composition roof; Pier jacks foundation (see remarks)
- Exterior features: Covered patio; Patio with awning; Back yard and yard space; Shed (1); In-ground community pool (fenced); Wood skirt
Interior
- Kitchen: Garbage disposal; Refrigerator; Gas range and gas oven; Dishwasher; Tile countertops
- Bedrooms: All bedrooms on main level
- Flooring: Laminated flooring
- Bathrooms: Two full bathrooms (remodeled)
- Heating & cooling: Central furnace heating
- Interior features: Ceiling fan; Cathedral/vaulted ceilings; One-level living; Turnkey condition; In-ground community spa
- Laundry & utility: Laundry in an individual room; Washer hookup; Stackable washer/dryer configuration; Washer included; Dryer included
Neighborhood map
What this means for you Summary
Snapshot
- This is a 3-bed/2.0-bath multifamily listed at $135k.
Deal economics
- At list price, monthly cash flow is $2k ($28k/yr) — positive.
- The deal already cash-flows at list — no discount required.
- Meets the 1% rule at list price ($4k rent vs $135k).
- Cap rate 27.5% vs local median 1.6% in Huntington Beach — top-decile yield for the area; either an underpriced asset or a hidden risk that comps aren't pricing in. Stress-test before assuming the spread holds.
Location & tenants
- Location reads 67/100 on livability (#306 in CA) — a middle-class / working-renter tenant base. Strengths: employment A+, commute A-; Watch: amenities C-, cost of living F, health & safety F.
- Huntington Beach Union High (suburban): math 65% / reading 82% proficiency, ranked #39 of 517 in CA (top 8%) — strong family-tenant draw, lease renewals of 3-5y typical.
- Zoned schools: Huntington Beach High (math 72% / reading 87%, grade A-, #45 of 1,170 statewide, top 4%, 2,807 students, 32% FRL).
- Market conditions: Rents rising (+1.2%/yr); 116 active listings in the ZIP; 32 comparable units currently listed for rent nearby; rentals leasing fast (median 1d on market — plan ~1-2 weeks tenant-placement turnaround); high-income renter base; 6,974 units permitted in Orange County in 2024 (3,839 in 5+ unit buildings).
- This rent runs 39% of the median local income ($131k/yr) — at the standard rent-burdened threshold; future hikes will face affordability resistance.
Forward outlook
- Local home prices are declining (-3.0%/yr); year-one equity from $933 of loan paydown is wiped out by about $4k of value loss. Plan a longer hold.
- Orange County population projected at +14% by 2050 — modest demand growth; plan on rents tracking national, not racing it.
- At projected returns (-3.0% appreciation + 1.2% rent growth), your $38k cash investment doubles in ~2 years — after that, you're playing with house money.
Negotiation context
- Only 9 days on market — expect competitive offers; lowballing is unlikely to land.
- 3 sale attempts since 27y ago with the ask held roughly flat each time — persistent listings suggest the price (not the market) is what's stuck; bring a comps-based counter.
Risks & watch-outs
- Watch-outs: flood insurance adds $66/mo.
- Climate carrying-cost: severe flood risk; extreme-heat days projected 7→23/yr by 2055 (HVAC capex compounding) — expect insurance premiums to compound above CPI over the hold.
Questions for the listing agent
- What's the actual annual flood-insurance premium (NFIP or private), and is the property in a SFHA with mandatory coverage?
- Is there a deadline driving the sale (1031 exchange, divorce, estate, relocation)? That informs how much negotiation room exists.
- Schools are B-rated — typically a magnet for longer-tenancy family renters. What's the average tenant stay here, and is there a school-zone premium baked into asking?
- What's the average days-on-market for RENTAL listings here right now (not sales)? A rising rental-DOM trend means longer vacancies and softer asking-rent achievability than the comps imply.
- What's the recent tenant-quality profile in this submarket — average credit score on applications, eviction rate, late-payment / NSF rate, and stable-employment percentage? A property-management company in the area should have these aggregated.
- How much new apartment / multifamily construction is in the pipeline within 1–3 miles? Heavy new supply (>2% of stock underway) typically softens rents 12–24 months out; light construction supports rent growth.
Investment metrics
- 1% rule
- 3.11% ✓
- Cap rate
- 27.53%
- Cash-on-cash
- 75.84%
- DSCR
- 4.37
- GRM
- 2.7
CMA / ARV
No comps found within radius.
Projected returns pro-forma
-3.0% appreciation · 1.2% rent growth · sell at horizon
- IRR
- 71.4%
- Equity multiple
- 4.14×
- Total profit
- $118,584
- Equity at exit
- $20,114
- IRR
- 74.9%
- Equity multiple
- 8.00×
- Total profit
- $264,432
- Equity at exit
- $11,664
Cash invested: $37,772 (down + closing). Projections, not guarantees.
Landlord ↔ Tenant lean methodology
- Overall (STATE)
- 18 Strongly Tenant-Friendly
- State California
- 18 Strongly Tenant-Friendly · D+13
- County
- — inherits STATE
- City
- — inherits STATE
ZIP-level market 92646
- Rents YoY
- 1.2%
- Active inventory
- 116
- Price-to-rent
- 2.7×
Monthly cashflow live
- Estimated rent
- $4,202 high interval (Pro) →
- Mortgage (P&I)
- −$707
- Tax est. 1.5%
- −$169 /mo · $2,024/yr
- Insurance
- −$56
- Flood insurance flood zone
- −$66 /mo · $798/yr
- HOA
- −$0
- Vacancy / Maint / Mgmt
- −$882
- Net cashflow
- $2,321
Break-even live
UW: 25.0% down · 7.5% · 30yr · 1.5% tax · 5.0% vac · 8.0% maint · 8.0% mgmt
Financing live
Cash to close
- Down payment
- $33,725
- Closing costs
- $4,047
- Reserves months
- —
- Total cash needed
- —
Loan-product check · same deal, 3 products live
Conventional
25% down · 7.5% · 30yr
- Down + closing
- —
- Monthly P&I
- —
- Monthly cashflow
- —
- DSCR
- —
- Eligible?
- —
Personal DTI + credit; lowest rate.
DSCR
20% down · 8.5% · 30yr
- Down + closing
- —
- Monthly P&I
- —
- Monthly cashflow
- —
- DSCR
- —
- Eligible?
- —
No personal income docs; deal must DSCR.
Hard money
10% down · 12.0% · 12mo
- Down + closing
- —
- Monthly P&I
- —
- Monthly cashflow
- —
- DSCR
- —
- Eligible?
- —
Short-term bridge; refi at stabilization.
Rent comps 32 comps
| Address | Beds | Baths | Sqft | Rent | $/sqft | DOM | Units | Dist |
|---|---|---|---|---|---|---|---|---|
| 21851 Newland St #104 Huntington Beach, CA | 3.0 | 2.0 | 1248 | $4,000 | $3.21 | 16d | 1 | 0.02mi |
| 8461 Lomond Dr Huntington Beach, CA | 3.0 | 1.0 | 950 | $3,800 | $4.00 | 10d | 1 | 0.39mi |
| 8216 Foxhall Dr Huntington Beach, CA | 4.0 | 2.5 | 1482 | $5,195 | $3.51 | 2d | 1 | 0.42mi |
| 8121 Foxhall Dr Huntington Beach, CA | 3.0 | 1.5 | 1296 | $4,950 | $3.82 | 1d | 1 | 0.47mi |
| 21270 Beach Blvd Huntington Beach, CA | 2.0 | 1.0–2.0 | 679 | $3,557 | $5.23 | 1d | 12 | 0.56mi |
| 8450 Atlanta Ave Huntington Beach, CA | 1.0–2.0 | 1.0 | 791 | $2,845 | $3.59 | 1d | 9 | 0.69mi |
| 7946 Waterfall Cir Huntington Beach, CA | 2.0 | 2.5 | 1439 | $4,500 | $3.13 | 1d | 1 | 0.80mi |
| 7795 Neptune Dr Huntington Beach, CA | 2.0–4.0 | 1.5–2.5 | 1155 | $4,654 | $4.03 | 1d | 3 | 0.88mi |
| 80 HUNTINGTON St Huntington Beach, OS | 2.0 | 2.0 | 1276 | $3,825 | $3.00 | 1d | 1 | 0.91mi |
| 9192 Christine Dr Huntington Beach, CA | 3.0 | 2.0 | 1453 | $6,700 | $4.61 | 4d | 1 | 0.94mi |
| 8877 Lauderdale Ct Unit 214C Huntington Beach, CA | 2.0 | 2.0 | 1009 | $3,600 | $3.57 | 1d | 1 | 1.01mi |
| 21040 Pacific City Cir Huntington Beach, CA | 1.0–3.0 | 1.0–2.5 | 1137 | $8,055 | $7.08 | 1d | 28 | 1.04mi |
| 7623 Bay Dr #103 Huntington Beach, CA | 2.0 | 1.0 | 968 | $3,200 | $3.31 | 1d | 1 | 1.06mi |
| 8777 Tulare Dr Unit 413d Huntington Beach, CA | 3.0 | 2.0 | 1287 | $3,900 | $3.03 | 1d | 1 | 1.09mi |
| 8565 Trinity Cir Unit 821D Huntington Beach, CA | 2.0 | 2.0 | 1077 | $3,450 | $3.20 | 10d | 1 | 1.09mi |
| 8565 Trinity Cir Unit 821D Huntington Beach, CA | 2.0 | 2.0 | 1077 | $3,450 | $3.20 | 1d | 1 | 1.09mi |
| 227 1st St Unit 3 Huntington Beach, CA | 2.0 | 2.0 | 1050 | $7,000 | $6.67 | 18d | 1 | 1.17mi |
| 509 Delaware St Unit A Huntington Beach, CA | 3.0 | 2.0 | 1200 | $3,200 | $2.67 | 1d | 1 | 1.20mi |
| 8302 Indianapolis Ave Huntington Beach, CA | 3.0 | 2.0 | 1045 | $4,450 | $4.26 | 19d | 1 | 1.22mi |
| 200 Pacific Coast Hwy Huntington Beach, CA | 1.0–2.0 | 1.0–2.0 | 1064 | $4,900 | $4.61 | 1d | 2 | 1.26mi |
| 200 Pacific Coast Hwy Huntington Beach, CA | 2.0 | 2.0–2.5 | 1299 | $4,575 | $3.52 | 15d | 2 | 1.26mi |
| 420 Lake St #101 Huntington Beach, CA | 2.0 | 2.0 | 1023 | $4,000 | $3.91 | 19d | 1 | 1.28mi |
| 820 Geneva Ave Unit B Huntington Beach, CA | 2.0 | 1.0 | 750 | $3,200 | $4.27 | 24d | 1 | 1.28mi |
| 224 Frankfort Ave Huntington Beach, CA | 2.0 | 1.0 | 925 | $3,750 | $4.05 | 1d | 1 | 1.29mi |
| 430 Lake St #202 Huntington Beach, CA | 2.0 | 2.0 | 1023 | $3,850 | $3.76 | 18d | 1 | 1.29mi |
| 8933 Modesto Cir Unit 1215B Huntington Beach, CA | 2.0 | 2.0 | 1091 | $3,200 | $2.93 | 1d | 1 | 1.31mi |
| 8933 Modesto Cir Unit 1215B Huntington Beach, CA | 2.0 | 2.0 | 1091 | $3,200 | $2.93 | 17d | 1 | 1.31mi |
| 1008 England St Huntington Beach, CA | 3.0 | 2.0 | 1200 | $4,500 | $3.75 | 1d | 1 | 1.42mi |
| 20321 Tidepool Cir Unit 105 Huntington Beach, CA | 2.0 | 2.0 | 1104 | $3,700 | $3.35 | 1d | 1 | 1.44mi |
| 20301 Bluffside Cir Unit D110 Huntington Beach, CA | 2.0 | 2.0 | 1101 | $5,250 | $4.77 | 1d | 1 | 1.47mi |
| 608 Olive Ave Huntington Beach, CA | 3.0 | 2.0 | 1100 | $4,195 | $3.81 | 15d | 1 | 1.48mi |
| 626 Lake St #54 Huntington Beach, CA | 3.0 | 3.0 | 1400 | $3,895 | $2.78 | 24d | 1 | 1.49mi |
Listing history 8 events
-
2026-06-18days on market $134,900 Active 9 DOM
-
2026-06-17days on market $134,900 Active 8 DOM
-
2026-06-16days on market $134,900 Active 7 DOM
-
2026-06-15days on market $134,900 Active 6 DOM
-
2026-06-13days on market $134,900 Active 4 DOM
-
2026-06-13days on market $134,900 Active 3 DOM
-
2026-06-10remarks 699-char remark
-
2026-06-10$134,900 Active 1 DOM
ⓘ Source: listings_history table (triggers on properties + properties_extension) + one-shot
backfill from property_details.listing_events for pre-trigger history.
Climate risk First Street
- Flood 10/10 Extreme FEMA zone X · 99% chance over 30 yrs
- Wildfire 1/10 Low
- Heat 5/10 Major 7 d/yr ≥82°F today · 23 d/yr by 30 yrs out
- Wind 1/10 Low
- Air quality 4/10 Moderate 5 unhealthy d/yr today · 5 by 30 yrs out
Nearby sold comps map
Loading sold comps map…
Walkable amenities ~0.75 mi
Loading nearby amenities…
Taxation est. · year 1
- Rental income
- $50,424
- − Mortgage interest
- −$7,556
- − Property taxes
- −$2,024
- − Insurance
- −$1,472
- − Repairs & maintenance
- −$4,034
- − Management
- −$4,034
- − Depreciation
- −$3,924
- Taxable income
- $27,380
- Est. tax owed @ 24.0%
- −$6,571
- After-tax cash flow
- $21,279/yr
For passive investors: Depreciation is non-cash, so a rental often shows a tax loss while cash-flowing — sheltering income. Rental losses are passive: they offset passive income freely, and up to $25,000/yr can offset ordinary (W-2) income if you actively participate and your MAGI is under $100k (phasing out to $0 by $150k); unused losses carry forward. On sale, claimed depreciation is recaptured at up to 25%, and gains may owe capital-gains tax (a 1031 exchange can defer both). Figures are a year-1 estimate at your 24.0% rate — not tax advice; consult a CPA.
Schools (NCES district)
- District
- Huntington Beach Union High
- NCES district ID
- 0618060
- Math proficiency
- 65% ▲ 17.00%
- Reading proficiency
- 82% ▲ 8.00%
- Median HH income
- $78,159
- Composite
- 64.9/100
- National rank
- #511
- State rank
- #39 of 517 in CA
Livability — Huntington Beach
- Score
- 67/100
- State rank
- #306
- US rank
- #10298
Category grades
Schools grade is shown separately in the Schools card above.
Census & demographics
- Census place
- Huntington Beach, CA
- County
- Orange County · 3,096,323 people
- City population
- 194,835
- Metro
- Los Angeles-Long Beach-Anaheim, CA
- Population (ZIP)
- 54,615
- Household income
- $130,672
- Rent vs Own
- Severe rent burden
- 1226.0
Population outlook (Orange County) Hauer SSP2
- Today (2025)
- 3,477,456 people
- By 2030
- 3,613,117 · +3.9%
- By 2040
- 3,835,945 · +10.3%
- By 2050
- 3,968,736 · +14.1%
- By 2075
- 4,097,053 · +17.8%
- By 2100
- 3,903,633 · +12.3%
Race, ethnicity, and origin ACS 2023
- Neighborhood character
- Diverse neighborhood (Simpson 0.56)
- Race & ethnicity
- White 63% Hispanic / Latino 16% Asian 13% Two or more races 13%
- Hispanic origin (detail)
- Mexican 11%
- Common ancestry
- Italian 3% Romanian 2% Lithuanian 2%
- Foreign-born
- 15% · Vietnam, Canada, China
- Languages at home
- 80% English-only · Spanish 7% Vietnamese 5% Chinese 2%
Political lean MEDSL · Orange
- 2024 margin
- Toss-up / Even · D 49.7% · R 47.1% · Other 3.2%
- 2008→2024 swing
- +5.2pp toward D · 2008: -2.6pp · 2024: 2.6pp
- All cycles
- 2024: D+2.6 2020: D+9.0 2016: D+7.7 2012: R+8.3 2008: R+2.6
Not yet ingested
- Civics
- —
Market trends
- HPI YoY
- ▼ -1082.92%
- Current HPI
- 459.3987
- Rent YoY
- ▲ 1.20%
- Metro
- Los Angeles-Long Beach-Anaheim, CA
- State GDP YoY
- ▲ 3.21%
- F500 in state
- 116
Industry mix (Fortune 500 HQ in CA)
| Industry | F500 HQs | Revenue |
|---|---|---|
| Technology | 27 | $1,492B |
|
||
| Financial Services | 3 | $174B |
|
||
| Retail | 3 | $44B |
|
||
| Insurance | 3 | $26B |
|
||
| Media / Entertainment | 2 | $115B |
|
||
| Pharmaceuticals / Biotech | 2 | $62B |
|
||
Price history
+351.2% since first listed5 events — show timeline
- 2026-06-09 Listed $134,900 CRMLS
- 2001-06-10 Listing Removed — CRMLS
- 2001-03-14 Listed $69,900 CRMLS
- 2000-02-02 Listing Removed — CRMLS
- 1999-03-26 Listed $29,900 CRMLS
Property tax history
-1.5%/yrLatest (2013): $64 · +0.1% YoY. Source: county tax records.
Cash-flow waterfall
monthlySold comps — $/sqft
last 12 mo · ≤1 miLoading sold comps…