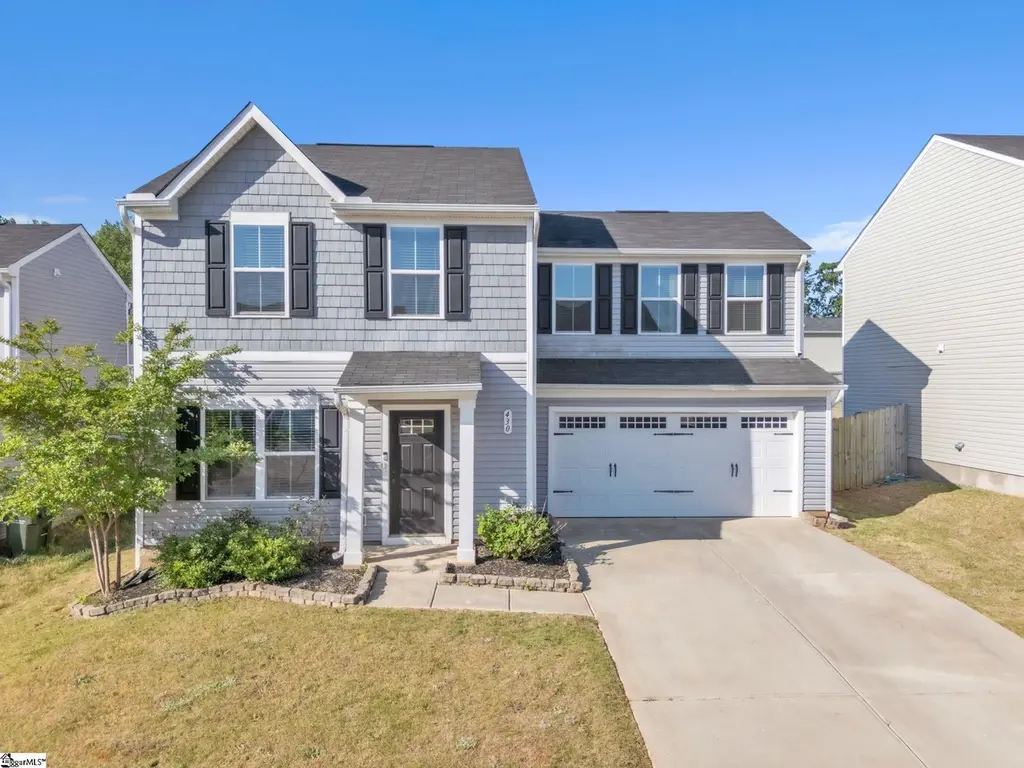
430 Edenvale Dr · Greer, SC
Flood risk 1/10 · Minimal
- FEMA flood zone
- X (unshaded)
- Chance of flooding over 30 yrs
- 0.0%
- Est. flood insurance / yr
- $507 – $1,088
Fire risk 3/10 · Minor
- Est. fire insurance / yr
- $783 – $1,453
Heat risk 6/10 · Moderate
- Hot days now (above 104°F)
- 7 days/yr
- Hot days in 30 yrs
- 17 days/yr
Wind risk 2/10 · Minimal
- Chance of severe wind over 30 yrs
- 1.0%
Air-quality risk 4/10 · Minor
- Unhealthy air days now
- 4 days/yr
- Unhealthy air days in 30 yrs
- 5 days/yr
Risk factors via First Street. Map © Google.
Why this score? — see what drove the D grade
The composite is a weighted blend of 9 inputs, each scored 0–100. Each bar is that input's sub-score; the figure is the points it added to the 100-point composite (weight × sub-score).
- Cash flow +15.0/30.0
- ARV discount +7.2/15.0
- DSCR +4.6/10.0
- Schools +4.1/10.0
- Livability +4.0/5.0
- 1% rule +3.6/10.0
- Rent growth +2.9/5.0
- Condition / age +2.5/5.0
- Appreciation +0.0/10.0
$265,000
🖨 Deal sheet (PDF) 📄 Offer letter ✓ Due diligence
Listing remarks
Welcome to this beautifully maintained 3-bedroom, 2.5-bath home in the heart of Greer! Offering 1,384 square feet of thoughtfully designed living space, this home features a bright open floor plan and a modern design that’s perfect for both everyday living and entertaining. The kitchen is equipped with sleek stainless steel appliances, and even better—all appliances convey, including the refrigerator, washer, and dryer—making this home truly move-in ready. Step outside to enjoy the backyard, complete with a charming gazebo that also conveys, creating the perfect space for relaxing or hosting gatherings. Conveniently located near BMW Manufacturing, this home offers easy acc
Key facts
- Open floor plan
- Move in ready
- Backyard gazebo
Tags
Property features AI
Finance
- HOA & community: Homeowners association present; HOA maintains street lights; Community playground and some sidewalks
Exterior
- Parking: Attached 2-car garage; Paved concrete driveway
- Utilities: Public water; Electric water heater; Public sewer; Public garbage pickup; Attached garage (service); Central electric cooling
- Home design: Two-story residence; Built in 2021; Storage in attic and garage; Slab foundation
- Construction: Vinyl siding exterior; Composition shingle roof
- Exterior features: Patio; Fenced yard
Interior
- Kitchen: Cooktop (smooth); Stand-alone smooth-top range; Built-in microwave; Dishwasher; Pantry closet (kitchen storage)
- Bedrooms: Primary bedroom on 2nd level with double sink, full bath, tub/shower, and walk-in closet; Second bedroom approximately 12 x 11; Third bedroom approximately 11 x 11; Primary bedroom size approximately 13 x 15
- Flooring: Carpet; Vinyl
- Bathrooms: Two full bathrooms and one half bathroom
- Heating & cooling: Electric heating; Central forced air cooling (electric)
- Interior features: Attic pull-down stairs; Smooth ceilings; Granite countertops; Open floor plan; Smoke detector; Walk-in closet; Pantry closet
- Laundry & utility: Second-floor laundry with washer connection and electric dryer hookup; Walk-in laundry area
Neighborhood map
What this means for you Summary
Snapshot
- This is a 4-bed/2.5-bath single-family listed at $265k.
Deal economics
- At list price, monthly cash flow is $84 ($1k/yr) — positive.
- The deal already cash-flows at list — no discount required.
- To meet the 1% rule (rent ≥ 1% of price), the offer needs to be $228k (13.9% below list).
- Recommended offer: $228k (13.9% below list) — sets the bar for 1% rule.
- Cap rate 6.7% vs local median 3.2% in Greer — top-decile yield for the area; either an underpriced asset or a hidden risk that comps aren't pricing in. Stress-test before assuming the spread holds.
Location & tenants
- Location reads 81/100 on livability (#7 in SC, #1,463 nationally) — a professional / high-income tenant draw. Strengths: amenities A+, cost of living A+, housing A+; Watch: crime C-, commute F.
- Spartanburg 05 (suburban): math 45% / reading 51% proficiency, ranked #13 of 80 in SC (top 16%) — families likely to look elsewhere, expect single-tenant / working-renter base with shorter leases.
- Zoned schools: Abner Creek Academy (math 60% / reading 57%, grade B-, #95 of 597 statewide, top 16%, 752 students, 55% FRL); Berry Shoals Intermediate (math 54% / reading 48%, grade C, #36 of 229 statewide, top 16%, 902 students, 56% FRL); James F. Byrnes High (math 31% / reading 75%, grade C-, #140 of 196 statewide, top 72%, 2,217 students, 56% FRL) — zoned schools average 56% FRL vs 39% district-wide (16 pts higher); higher-poverty schools than district average — tighter screening recommended.
- Market conditions: Rents rising (+1.6%/yr); 514 active listings in the ZIP; 2 comparable units currently listed for rent nearby; solid renter incomes; 3,129 units permitted in Spartanburg County in 2024 (40 in 5+ unit buildings).
- This rent runs 33% of the median local income ($83k/yr) — at the standard rent-burdened threshold; future hikes will face affordability resistance.
Forward outlook
- Local home prices are declining (-3.0%/yr); year-one equity from $2k of loan paydown is wiped out by about $8k of value loss. Plan a longer hold.
- Spartanburg County population projected at +18% by 2050 — long-run rental-demand tailwind backs the buy-and-hold thesis.
Negotiation context
- It's been on market 25 days — a 2% lower offer ($261k) is reasonable based on typical stale-listing flexibility.
- Current owner paid $182k; 46% above their basis — modest negotiation headroom, anchor on the comps not their cost.
Risks & watch-outs
- Climate carrying-cost: extreme-heat days projected 7→17/yr by 2055 (HVAC capex compounding) — expect insurance premiums to compound above CPI over the hold.
Questions for the listing agent
- What does the HOA fee cover, when was the last increase, and are there any pending special assessments or reserve-fund shortfalls?
- Is there a deadline driving the sale (1031 exchange, divorce, estate, relocation)? That informs how much negotiation room exists.
- Schools are B-rated — typically a magnet for longer-tenancy family renters. What's the average tenant stay here, and is there a school-zone premium baked into asking?
- The area grade is low — what's the realistic commute time and amenity access for the typical tenant pool here? Any planned neighborhood developments (good or bad) we should know about?
- What's the average days-on-market for RENTAL listings here right now (not sales)? A rising rental-DOM trend means longer vacancies and softer asking-rent achievability than the comps imply.
- What's the recent tenant-quality profile in this submarket — average credit score on applications, eviction rate, late-payment / NSF rate, and stable-employment percentage? A property-management company in the area should have these aggregated.
- How much new for-sale + rental construction is in the pipeline within 1–3 miles? Heavy new supply typically softens prices + rents 12–24 months out; constrained supply supports both.
Investment metrics
- 1% rule
- 0.86% ✗
- Cap rate
- 6.67%
- Cash-on-cash
- 1.36%
- DSCR
- 1.06
- GRM
- 9.7
CMA / ARV
- ARV (on-the-fly)
- $262,960
- Comps found
- 12
Show comp detail 12 sales within ~0.75 mi
| Address | Dist | Beds/Ba | Sqft | Sold | Price | $/sf | Match |
|---|---|---|---|---|---|---|---|
| 430 Edenvale Dr | 0.00mi | 3/2.5 (-1) | 1,427 (+3%) | 0mo | $260,000 | $182 | 89 |
| 171 Ralston Rd | 0.03mi | 3/2.5 (-1) | 1,400 (+1%) | 6mo | $275,000 | $196 | 87 |
| 176 Ralston Rd | 0.06mi | 3/2.0 (-1) | 1,314 (-5%) | 13mo | $274,000 | $209 | 71 |
| 1322 Algeddis Dr | 0.25mi | 3/2.5 (-1) | 1,369 (-1%) | 13mo | $260,200 | $190 | 71 |
| 1322 Algeddis Dr Lot 30 | 0.26mi | 3/2.5 (-1) | 1,369 (-1%) | 13mo | $260,200 | $190 | 71 |
| 1444 Donhill Dr | 0.27mi | 3/2.5 (-1) | 1,369 (-1%) | 19mo | $263,004 | $192 | 65 |
| 1444 Donhill Dr Lot 64 | 0.31mi | 3/2.5 (-1) | 1,369 (-1%) | 19mo | $263,004 | $192 | 62 |
| 1509 Alvin Pond Dr | 0.26mi | 3/2.5 (-1) | 1,476 (+7%) | 14mo | $275,920 | $187 | 60 |
| 1509 Alvin Pond Dr Lot 37 | 0.26mi | 3/2.5 (-1) | 1,476 (+7%) | 14mo | $275,920 | $187 | 60 |
| 1428 Donhill Dr Lot 68 | 0.25mi | 3/2.5 (-1) | 1,498 (+8%) | 19mo | $275,000 | $184 | 54 |
| 1428 Donhill Dr | 0.33mi | 3/2.5 (-1) | 1,476 (+7%) | 19mo | $275,000 | $186 | 53 |
| 1513 Alvin Pond Dr Lot 38 | 0.25mi | 3/2.0 (-1) | 1,186 (-14%) | 20mo | $270,227 | $228 | 40 |
Match score weights: distance 35% · size 25% · config 20% · recency 20%. Top-matched comps best support the ARV.
Projected returns pro-forma
-3.0% appreciation · 1.62% rent growth · sell at horizon
- IRR
- -15.6%
- Equity multiple
- 0.45×
- Total profit
- $-40,761
- Equity at exit
- $39,512
- IRR
- -9.6%
- Equity multiple
- 0.44×
- Total profit
- $-41,230
- Equity at exit
- $22,912
Cash invested: $74,200 (down + closing). Projections, not guarantees.
Landlord ↔ Tenant lean methodology
- Overall (STATE)
- 90 Strongly Landlord-Friendly
- State South Carolina
- 90 Strongly Landlord-Friendly · R+6
- County
- — inherits STATE
- City
- — inherits STATE
ZIP-level market 29651
- Home prices YoY
- -29.4%
- Rents YoY
- 1.6%
- Active inventory
- 514
- Price-to-rent
- 9.7×
Monthly cashflow live
- Estimated rent
- $2,281 medium interval (Pro) →
- Mortgage (P&I)
- −$1,390
- Tax from tax record
- −$187 /mo · $2,242/yr
- Insurance
- −$110
- HOA
- −$31
- Vacancy / Maint / Mgmt
- −$479
- Net cashflow
- $84
Break-even live
Sensitivity live
| Price | -10% $234 | -5% $159 | +0% $84 | +5% $9 | +10% $-66 |
|---|---|---|---|---|---|
| Rent | -10% $-96 | -5% $-6 | +0% $84 | +5% $174 | +10% $264 |
| Rate | -1.0pp $217 | -0.5pp $151 | base $84 | +0.5pp $15 | +1.0pp $-55 |
UW: 25.0% down · 7.5% · 30yr · 1.5% tax · 5.0% vac · 8.0% maint · 8.0% mgmt
Financing live
Cash to close
- Down payment
- $66,250
- Closing costs
- $7,950
- Reserves months
- —
- Total cash needed
- —
Loan-product check · same deal, 3 products live
Conventional
25% down · 7.5% · 30yr
- Down + closing
- —
- Monthly P&I
- —
- Monthly cashflow
- —
- DSCR
- —
- Eligible?
- —
Personal DTI + credit; lowest rate.
DSCR
20% down · 8.5% · 30yr
- Down + closing
- —
- Monthly P&I
- —
- Monthly cashflow
- —
- DSCR
- —
- Eligible?
- —
No personal income docs; deal must DSCR.
Hard money
10% down · 12.0% · 12mo
- Down + closing
- —
- Monthly P&I
- —
- Monthly cashflow
- —
- DSCR
- —
- Eligible?
- —
Short-term bridge; refi at stabilization.
Rent comps 2 comps
| Address | Beds | Baths | Sqft | Rent | $/sqft | DOM | Units | Dist |
|---|---|---|---|---|---|---|---|---|
| 1456 Donhill Dr Greer, SC | 3.0 | 2.0 | 1148 | $2,100 | $1.83 | 23d | 1 | 0.34mi |
| 1428 Donhill Dr Greer, SC | 3.0 | 2.5 | 1475 | $2,200 | $1.49 | 23d | 1 | 0.36mi |
HOA detail
- Monthly dues
- $31 · $372/yr
Listing history 4 events
-
2026-05-20status Pending
-
2026-05-07historical Contingency Contract
-
2026-04-25$265,000 Active
-
2020-12-29soldstatus $181,600
ⓘ Source: listings_history table (triggers on properties + properties_extension) + one-shot
backfill from property_details.listing_events for pre-trigger history.
Tax reassessment forecast SC · Resets to sale price
- Current annual tax
- $2,242 · $187/mo
- Projected year-2 tax
- $2,242 · $187/mo
- Expected delta
- $0/yr ($0/mo · 0.0%)
ⓘ Screening estimate from a state-policy table — verify with the county assessor before closing.
Climate risk First Street
- Flood 1/10 Low FEMA zone X (unshaded) · 0% chance over 30 yrs
- Wildfire 3/10 Moderate
- Heat 6/10 Major 7 d/yr ≥104°F today · 17 d/yr by 30 yrs out
- Wind 2/10 Low 100% chance of damaging wind over 30 yrs
- Air quality 4/10 Moderate 4 unhealthy d/yr today · 5 by 30 yrs out
Nearby sold comps map
Loading sold comps map…
Walkable amenities ~0.75 mi
Loading nearby amenities…
Taxation est. · year 1
- Rental income
- $27,369
- − Mortgage interest
- −$14,844
- − Property taxes
- −$2,242
- − Insurance
- −$1,325
- − Repairs & maintenance
- −$2,189
- − Management
- −$2,189
- − HOA
- −$372
- − Depreciation
- −$7,709
- Taxable loss
- −$3,502
- Est. tax savings @ 24.0%
- +$841
- After-tax cash flow
- $1,847/yr
For passive investors: Depreciation is non-cash, so a rental often shows a tax loss while cash-flowing — sheltering income. Rental losses are passive: they offset passive income freely, and up to $25,000/yr can offset ordinary (W-2) income if you actively participate and your MAGI is under $100k (phasing out to $0 by $150k); unused losses carry forward. On sale, claimed depreciation is recaptured at up to 25%, and gains may owe capital-gains tax (a 1031 exchange can defer both). Figures are a year-1 estimate at your 24.0% rate — not tax advice; consult a CPA.
Schools (NCES district)
- District
- Spartanburg 05
- NCES district ID
- 4503600
- Math proficiency
- 45% ▼ -11.00%
- Reading proficiency
- 51% ▬ 0.00%
- Median HH income
- $52,127
- Composite
- 41.31/100
- National rank
- #3512
- State rank
- #13 of 80 in SC
Livability — Greer
- Score
- 81/100
- State rank
- #7
- US rank
- #1463
Category grades
Schools grade is shown separately in the Schools card above.
Census & demographics
- Census place
- Greer, SC
- County
- Greenville County · 573,815 people
- City population
- 99,092
- Metro
- Greenville-Anderson, SC
- Population (ZIP)
- 56,599
- Household income
- $82,705
- Rent vs Own
- Severe rent burden
- 720.0
Population outlook (Spartanburg County) Hauer SSP2
- Today (2025)
- 325,495 people
- By 2030
- 338,800 · +4.1%
- By 2040
- 363,471 · +11.7%
- By 2050
- 384,156 · +18.0%
- By 2075
- 430,137 · +32.1%
- By 2100
- 442,733 · +36.0%
Race, ethnicity, and origin ACS 2023
- Neighborhood character
- Predominantly White (73%)
- Race & ethnicity
- White 73% Hispanic / Latino 11% Black 11% Two or more races 9% Asian 1%
- Hispanic origin (detail)
- Mexican 6% Puerto Rican 1%
- Common ancestry
- Serbian 3% Slovak 2% Romanian 2%
- Foreign-born
- 7% · Canada, Jamaica
- Languages at home
- 89% English-only · Spanish 8% Other Indo-European 1% German/W. Germanic 1%
Political lean MEDSL · Spartanburg
- 2024 margin
- Solid R (+33.6) · D 32.6% · R 66.2% · Other 1.2%
- 2008→2024 swing
- -12.0pp toward R · 2008: -21.6pp · 2024: -33.6pp
- All cycles
- 2024: R+33.6 2020: R+27.3 2016: R+30.0 2012: R+23.1 2008: R+21.6
Not yet ingested
- Civics
- —
Market trends
- HPI YoY
- ▼ -101.81%
- Current HPI
- 243.9051
- Rent YoY
- ▲ 1.62%
- Metro
- Greenville-Anderson, SC
- State GDP YoY
- ▲ 4.51%
- F500 in state
- 2
Industry mix (Fortune 500 HQ in SC)
| Industry | F500 HQs | Revenue |
|---|---|---|
| Packaging | 1 | $7B |
|
||
Price history
+45.9% since first listed4 events — show timeline
- 2026-05-20 Pending — Greater Greenville MLS
- 2026-05-07 Contingent — Greater Greenville MLS
- 2026-04-25 Listed $265,000 Greater Greenville MLS
- 2020-12-29 Sold (Public Records) $181,600 Public Records
Property tax history
+73.6%/yrLatest (2025): $2,242 · -0.4% YoY. Source: county tax records.
Cash-flow waterfall
monthlySold comps — $/sqft
last 12 mo · ≤1 miLoading sold comps…