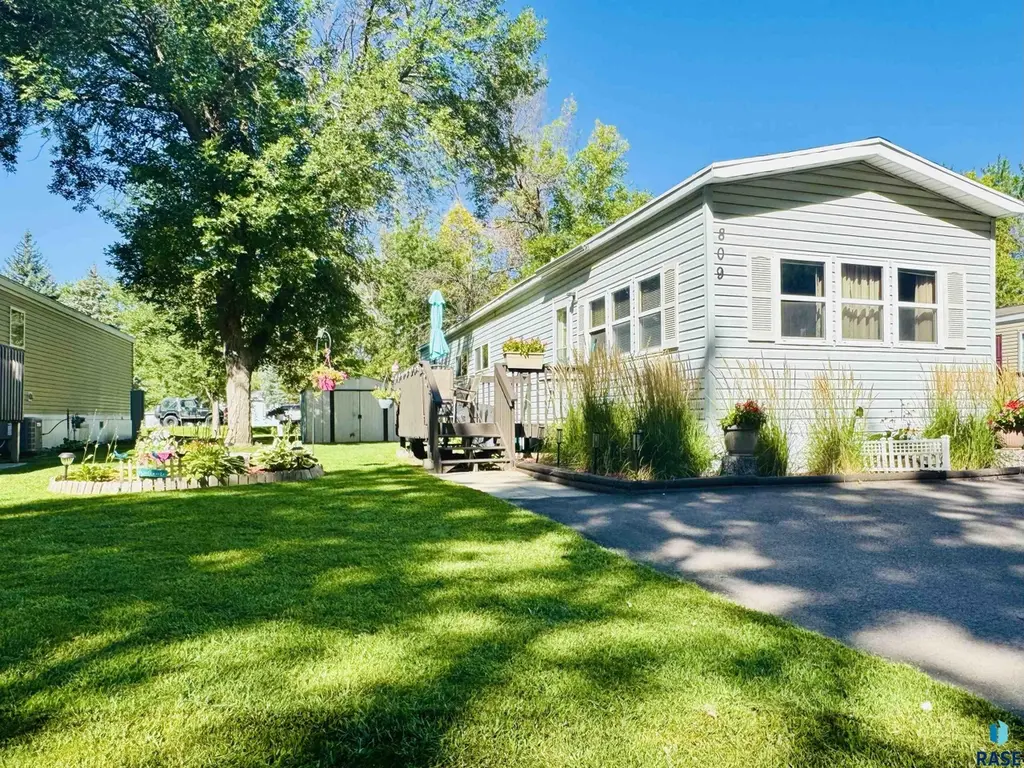
809 S Gina Pl Pl · Sioux Falls, SD
Flood risk 1/10 · Minimal
- FEMA flood zone
- X
- Chance of flooding over 30 yrs
- 0.0%
- Est. flood insurance / yr
- $473 – $860
Fire risk 2/10 · Minimal
- Est. fire insurance / yr
- $1,342 – $2,492
Heat risk 2/10 · Minimal
- Hot days now (above 99°F)
- 7 days/yr
- Hot days in 30 yrs
- 14 days/yr
Wind risk 2/10 · Minimal
- Chance of severe wind over 30 yrs
- —
Air-quality risk 2/10 · Minimal
- Unhealthy air days now
- 1 days/yr
- Unhealthy air days in 30 yrs
- 1 days/yr
Risk factors via First Street. Map © Google.
Why this score? — see what drove the C- grade
The composite is a weighted blend of 9 inputs, each scored 0–100. Each bar is that input's sub-score; the figure is the points it added to the 100-point composite (weight × sub-score).
- Cash flow +15.0/30.0
- ARV discount +15.0/15.0
- 1% rule +5.0/10.0
- DSCR +5.0/10.0
- Livability +4.2/5.0
- Schools +3.7/10.0
- Rent growth +3.0/5.0
- Condition / age +2.5/5.0
- Appreciation +0.0/10.0
$29,000
🖨 Deal sheet 📄 Offer letter ✓ Due diligence
Key facts
- Updated siding
- Updated windows
- Updated furnace
Tags
Property features AI
Finance
- HOA & community: Homeowners association present; Association amenities: Other; Association fee $565
Exterior
- Home design: Mobile home; Other architectural style; Inside city limits
- Construction: Total building area 1,848; Above-grade finished area 924
- Exterior features: Lot is leased
Interior
- Bathrooms: 1 full bathroom
- Interior features: 6 total rooms; 924 sq ft finished on the main level
Neighborhood map
What this means for you Summary
Snapshot
- This is a 3-bed/2.0-bath manufactured listed at $29k.
Deal economics
- At list price, monthly cash flow is $321 ($4k/yr) — positive.
- The deal already cash-flows at list — no discount required.
- Meets the 1% rule at list price ($1k rent vs $29k).
- Cap rate 19.6% vs local median 2.6% in Sioux Falls — top-decile yield for the area; either an underpriced asset or a hidden risk that comps aren't pricing in. Stress-test before assuming the spread holds.
Location & tenants
- Location reads 85/100 on livability (#3 in SD, #610 nationally) — a professional / high-income tenant draw. Strengths: amenities A+, commute A+, cost of living A+; Watch: crime F.
- Sioux Falls School District 49-5 (urban): math 39% / reading 48% proficiency, ranked #45 of 59 in SD (top 76%) — families likely to look elsewhere, expect single-tenant / working-renter base with shorter leases.
- Zoned schools: Jefferson High School - 67 (1,749 students, 34% FRL) — zoned schools at 34% FRL track the district average.
- Market conditions: Rents rising (+2.2%/yr); 393 active listings in the ZIP; 14 comparable units currently listed for rent nearby; rentals at typical pace (median 21d on market — plan ~3-4 weeks tenant-placement turnaround); solid renter incomes; 2,425 units permitted in Minnehaha County in 2024 (1,367 in 5+ unit buildings).
Forward outlook
- Local home prices are declining (-3.0%/yr); year-one equity from $200 of loan paydown is wiped out by about $870 of value loss. Plan a longer hold.
- Minnehaha County population projected at +46% by 2050 — long-run rental-demand tailwind backs the buy-and-hold thesis.
- At projected returns (-3.0% appreciation + 2.2% rent growth), your $8k cash investment doubles in ~3 years — after that, you're playing with house money.
Negotiation context
- Only 10 days on market — expect competitive offers; lowballing is unlikely to land.
- 2 sale attempts with the ask held roughly flat each time — persistent listings suggest the price (not the market) is what's stuck; bring a comps-based counter.
Risks & watch-outs
- Watch-outs: HOA is 41% of rent.
Questions for the listing agent
- Built in 1974 — when were the roof, HVAC, electrical panel, plumbing, and water heater last replaced?
- What does the HOA fee cover, when was the last increase, and are there any pending special assessments or reserve-fund shortfalls?
- Is there a deadline driving the sale (1031 exchange, divorce, estate, relocation)? That informs how much negotiation room exists.
- Schools are B-rated — typically a magnet for longer-tenancy family renters. What's the average tenant stay here, and is there a school-zone premium baked into asking?
- Crime grade is F in this area — have there been break-ins, vandalism, or insurance claims at this property in the last 3 years? What carrier currently insures it and at what premium?
- What's the average days-on-market for RENTAL listings here right now (not sales)? A rising rental-DOM trend means longer vacancies and softer asking-rent achievability than the comps imply.
- What's the recent tenant-quality profile in this submarket — average credit score on applications, eviction rate, late-payment / NSF rate, and stable-employment percentage? A property-management company in the area should have these aggregated.
- How much new for-sale + rental construction is in the pipeline within 1–3 miles? Heavy new supply typically softens prices + rents 12–24 months out; constrained supply supports both.
Investment metrics
- 1% rule
- 4.74% ✓
- Cap rate
- 19.59%
- Cash-on-cash
- 47.49%
- DSCR
- 3.11
- GRM
- 1.8
CMA / ARV
- ARV (on-the-fly)
- $48,972
- Comps found
- 1
Show comp detail 1 sale within ~0.75 mi
| Address | Dist | Beds/Ba | Sqft | Sold | Price | $/sf | Match |
|---|---|---|---|---|---|---|---|
| 811 S Douglas Pl | 0.09mi | 3/1.0 | 938 (+2%) | 18mo | $50,000 | $53 | 74 |
Match score weights: distance 35% · size 25% · config 20% · recency 20%. Top-matched comps best support the ARV.
Projected returns pro-forma
-3.0% appreciation · 2.18% rent growth · sell at horizon
- IRR
- 43.6%
- Equity multiple
- 2.85×
- Total profit
- $15,009
- Equity at exit
- $4,324
- IRR
- 49.0%
- Equity multiple
- 5.48×
- Total profit
- $36,374
- Equity at exit
- $2,507
Cash invested: $8,120 (down + closing). Projections, not guarantees.
Landlord ↔ Tenant lean methodology
- Overall (STATE)
- 83 Strongly Landlord-Friendly
- State South Dakota
- 83 Strongly Landlord-Friendly · R+16
- County
- — inherits STATE
- City
- — inherits STATE
ZIP-level market 57106
- Rents YoY
- 2.2%
- Active inventory
- 393
- Price-to-rent
- 1.8×
Monthly cashflow live
- Estimated rent
- $1,376 high interval (Pro) →
- Mortgage (P&I)
- −$152
- Tax est. 1.5%
- −$36 /mo · $435/yr
- Insurance
- −$12
- HOA
- −$565
- Vacancy / Maint / Mgmt
- −$289
- Net cashflow
- $321
Break-even live
UW: 25.0% down · 7.5% · 30yr · 1.5% tax · 5.0% vac · 8.0% maint · 8.0% mgmt
Financing live
Cash to close
- Down payment
- $7,250
- Closing costs
- $870
- Reserves months
- —
- Total cash needed
- —
Loan-product check · same deal, 3 products live
Conventional
25% down · 7.5% · 30yr
- Down + closing
- —
- Monthly P&I
- —
- Monthly cashflow
- —
- DSCR
- —
- Eligible?
- —
Personal DTI + credit; lowest rate.
DSCR
20% down · 8.5% · 30yr
- Down + closing
- —
- Monthly P&I
- —
- Monthly cashflow
- —
- DSCR
- —
- Eligible?
- —
No personal income docs; deal must DSCR.
Hard money
10% down · 12.0% · 12mo
- Down + closing
- —
- Monthly P&I
- —
- Monthly cashflow
- —
- DSCR
- —
- Eligible?
- —
Short-term bridge; refi at stabilization.
Rent comps 14 comps
| Address | Beds | Baths | Sqft | Rent | $/sqft | DOM | Units | Dist |
|---|---|---|---|---|---|---|---|---|
| 912 Willow Creek Pl Unit 928-10 Sioux Falls, SD | 2.0 | 2.0 | 1086 | $1,294 | $1.19 | 21d | 1 | 0.16mi |
| 912 S Willow Creek Pl Sioux Falls, SD | 1.0–2.0 | 1.0–2.0 | 868 | $1,482 | $1.71 | 13d | 4 | 0.16mi |
| 920 Willow Creek Pl Unit 920-14 Sioux Falls, SD | 2.0 | 2.0 | 1086 | $1,250 | $1.15 | 21d | 1 | 0.20mi |
| 1125 S Ebenezer Ave Sioux Falls, SD | 1.0–2.0 | 1.0–2.0 | 936 | $1,370 | $1.46 | 13d | 10 | 0.26mi |
| 500 S Ruth Ave Sioux Falls, SD | 3.0 | 2.0 | 1100 | $1,301 | $1.18 | 13d | 1 | 0.27mi |
| 1402 S Marion Rd Sioux Falls, SD | 1.0–3.0 | 1.0–2.0 | 1034 | $1,220 | $1.18 | 13d | 1 | 0.52mi |
| 925 S Newcomb Ave Unit 18 Sioux Falls, SD | 2.0 | 1.0 | 900 | $950 | $1.06 | 21d | 1 | 0.55mi |
| 925 S Newcomb Ave Apt 12 Sioux Falls, SD | 2.0 | 1.0 | 890 | $950 | $1.07 | 43d | 1 | 0.55mi |
| 701 S Lyons Ave Sioux Falls, SD | 3.0 | 2.0 | 1100 | $1,005 | $0.91 | 43d | 1 | 0.57mi |
| 5801 W Christopher Pl Sioux Falls, SD | 2.0–3.0 | 1.0 | 989 | $1,047 | $1.06 | 21d | 3 | 0.66mi |
| 5811 W Christopher Pl Unit 15 Sioux Falls, SD | 2.0 | 2.0 | 1100 | $1,095 | $1.00 | 43d | 1 | 0.68mi |
| 5811 W Christopher Pl Unit 02 Sioux Falls, SD | 2.0 | 1.0 | 1010 | $900 | $0.89 | 43d | 1 | 0.68mi |
| 2301 S Lorraine Pl Sioux Falls, SD | 2.0 | 1.0–2.0 | 834 | $1,695 | $2.03 | 13d | 15 | 1.00mi |
| 500 S Kiwanis Ave Sioux Falls, SD | 1.0–2.0 | 1.0–2.0 | 859 | $1,045 | $1.22 | 13d | 11 | 1.28mi |
HOA detail
- Monthly dues
- $565 · $6,780/yr
Listing history 8 events
-
2026-06-18days on market $29,000 Active 10 DOM
-
2026-06-17days on market $29,000 Active 9 DOM
-
2026-06-16days on market $29,000 Active 8 DOM
-
2026-06-15days on market $29,000 Active 7 DOM
-
2026-06-14days on market $29,000 Active 5 DOM
-
2026-06-13statusdays on market $29,000 Active 4 DOM
-
2026-06-07statusdays on market $29,000 Pending 2 DOM
-
2026-06-05$29,000 Active 1 DOM
ⓘ Source: listings_history table (triggers on properties + properties_extension) + one-shot
backfill from property_details.listing_events for pre-trigger history.
Climate risk First Street
- Flood 1/10 Low FEMA zone X · 0% chance over 30 yrs
- Wildfire 2/10 Low
- Heat 2/10 Low 7 d/yr ≥99°F today · 14 d/yr by 30 yrs out
- Wind 2/10 Low
- Air quality 2/10 Low 1 unhealthy d/yr today · 1 by 30 yrs out
Nearby sold comps map
Loading sold comps map…
Walkable amenities ~0.75 mi
Loading nearby amenities…
Taxation est. · year 1
- Rental income
- $16,508
- − Mortgage interest
- −$1,624
- − Property taxes
- −$435
- − Insurance
- −$145
- − Repairs & maintenance
- −$1,321
- − Management
- −$1,321
- − HOA
- −$6,780
- − Depreciation
- −$844
- Taxable income
- $4,038
- Est. tax owed @ 24.0%
- −$969
- After-tax cash flow
- $2,887/yr
For passive investors: Depreciation is non-cash, so a rental often shows a tax loss while cash-flowing — sheltering income. Rental losses are passive: they offset passive income freely, and up to $25,000/yr can offset ordinary (W-2) income if you actively participate and your MAGI is under $100k (phasing out to $0 by $150k); unused losses carry forward. On sale, claimed depreciation is recaptured at up to 25%, and gains may owe capital-gains tax (a 1031 exchange can defer both). Figures are a year-1 estimate at your 24.0% rate — not tax advice; consult a CPA.
Schools (NCES district)
- District
- Sioux Falls School District 49-5
- NCES district ID
- 4666270
- Math proficiency
- 39% ▼ -4.00%
- Reading proficiency
- 48% ▼ -2.00%
- Median HH income
- $51,093
- Composite
- 37.47/100
- National rank
- #4407
- State rank
- #45 of 59 in SD
Livability — Sioux Falls
- Score
- 85/100
- State rank
- #3
- US rank
- #610
Category grades
Schools grade is shown separately in the Schools card above.
Census & demographics
- Census place
- Sioux Falls, SD
- County
- Minnehaha County · 191,523 people
- City population
- 207,623
- Metro
- Sioux Falls, SD
- Population (ZIP)
- 51,907
- Household income
- $77,580
- Rent vs Own
- Severe rent burden
- 1500.0
Population outlook (Minnehaha County) Hauer SSP2
- Today (2025)
- 222,323 people
- By 2030
- 241,430 · +8.6%
- By 2040
- 281,643 · +26.7%
- By 2050
- 325,574 · +46.4%
- By 2075
- 469,313 · +111.1%
- By 2100
- 664,763 · +199.0%
Race, ethnicity, and origin ACS 2023
- Neighborhood character
- Predominantly White (81%)
- Race & ethnicity
- White 81% Hispanic / Latino 7% Two or more races 7% Black 5% Asian 1% Native American 1%
- Hispanic origin (detail)
- Mexican 2%
- Common ancestry
- Portuguese 12% Iranian 7% Lithuanian 2%
- Foreign-born
- 7% · Canada
- Languages at home
- 91% English-only · Spanish 5% Russian/Polish/Slavic 1% Other Indo-European 1%
Political lean MEDSL · Minnehaha
- 2024 margin
- R (+12.7) · D 42.5% · R 55.2% · Other 2.4%
- 2008→2024 swing
- -13.4pp toward R · 2008: 0.7pp · 2024: -12.7pp
- All cycles
- 2024: R+12.7 2020: R+9.5 2016: R+14.6 2012: R+7.4 2008: D+0.7
Not yet ingested
- Civics
- —
Market trends
- HPI YoY
- ▼ -138.17%
- Current HPI
- 214.9065
- Rent YoY
- ▲ 2.18%
- Metro
- Sioux Falls, SD
- State GDP YoY
- ▲ 0.70%
- F500 in state
- 2
Industry mix (Fortune 500 HQ in SD)
| Industry | F500 HQs | Revenue |
|---|---|---|
| Utilities | 1 | $1B |
|
||
Price history
-29.3% since first listed4 events — show timeline
- 2026-06-02 Listed $29,000 REALTOR® Association of the Sioux Empire
- 2025-10-21 Listing Removed — REALTOR® Association of the Sioux Empire
- 2025-09-25 Price Changed $38,000 REALTOR® Association of the Sioux Empire
- 2025-08-23 Listed $41,000 REALTOR® Association of the Sioux Empire
Property tax history
-5.5%/yrLatest (2022): $45 · -20.2% YoY. Source: county tax records.
Cash-flow waterfall
monthlySold comps — $/sqft
last 12 mo · ≤1 miLoading sold comps…