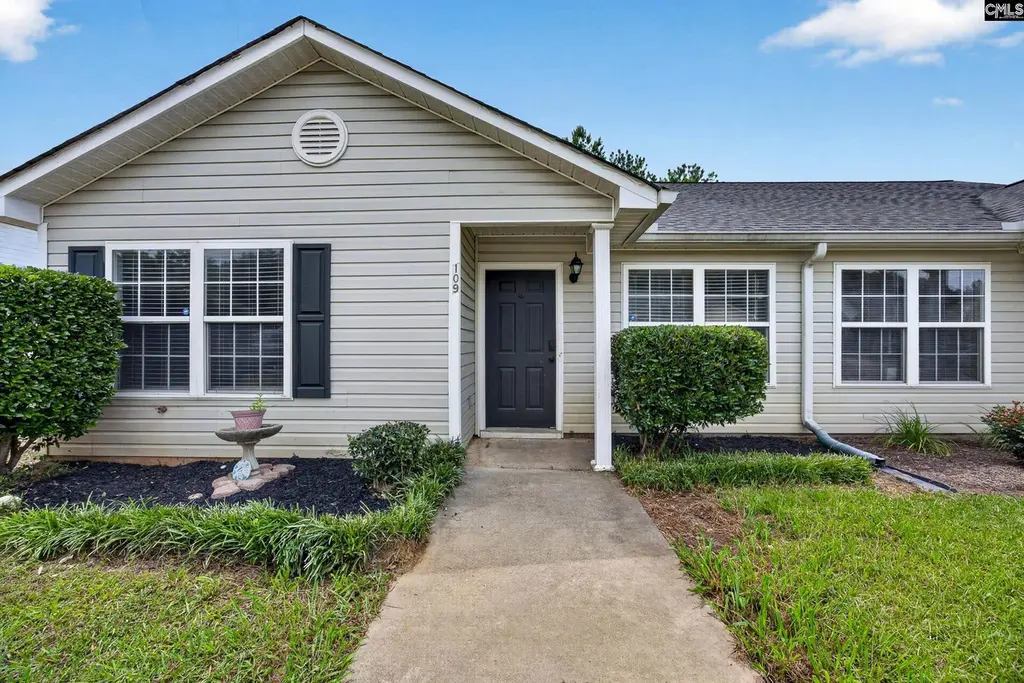
109 Owl Trace Ln · Lake Murray of Richland, SC
Flood risk 1/10 · Minimal
- FEMA flood zone
- X (unshaded)
- Chance of flooding over 30 yrs
- 0.0%
- Est. flood insurance / yr
- $507 – $1,088
Fire risk 4/10 · Minor
- Est. fire insurance / yr
- $783 – $1,453
Heat risk 6/10 · Moderate
- Hot days now (above 108°F)
- 7 days/yr
- Hot days in 30 yrs
- 16 days/yr
Wind risk 6/10 · Moderate
- Chance of severe wind over 30 yrs
- 49.0%
Air-quality risk 3/10 · Minor
- Unhealthy air days now
- 2 days/yr
- Unhealthy air days in 30 yrs
- 3 days/yr
Risk factors via First Street. Map © Google.
Why this score? — see what drove the B+ grade
The composite is a weighted blend of 9 inputs, each scored 0–100. Each bar is that input's sub-score; the figure is the points it added to the 100-point composite (weight × sub-score).
- Cash flow +30.0/30.0
- 1% rule +10.0/10.0
- DSCR +10.0/10.0
- ARV discount +7.5/15.0
- Appreciation +5.0/10.0
- Schools +4.5/10.0
- Livability +3.4/5.0
- Rent growth +2.5/5.0
- Condition / age +2.5/5.0
$198,000
🖨 Deal sheet 📄 Offer letter ✓ Due diligence
Listing remarks
Charming 3BR/2BA patio home in a quiet Chapin cul-de-sac! Features include an eat-in kitchen, a spacious great room, a private primary suite with walk-in closet, and two additional bedrooms with shared bath. Enjoy a fully fenced backyard, outdoor storage, and a fantastic location off Sid Bickley, close to shopping, interstates, and top-rated Chapin schools. No HOA and under $200,000! Disclaimer: CMLS has not reviewed and, therefore, does not endorse vendors who may appear in listings.
Key facts
- Outdoor storage
- Spacious great room
- Walk-in closet
Tags
Property features AI
Exterior
- Utilities: Public water; Public sewer
- Home design: Single-story home; Built on a slab foundation
- Construction: Slab foundation
- Exterior features: Patio; Partial gutters; Vinyl exterior finish; Rear wood fencing
Interior
- Kitchen: Wood-natural cabinets; Eat-in kitchen; Solid surface countertops; Vinyl flooring; Dishwasher; Free-standing range; Refrigerator; Freezer
- Bedrooms: Master bedroom on the main level with private bath, walk-in closet, tub/shower and ceiling fan; Two additional main-level bedrooms each with ceiling fan, private closet and luxury vinyl plank flooring
- Flooring: Carpet in great room; Luxury vinyl plank in bedrooms; Vinyl in kitchen
- Bathrooms: Two full bathrooms (including the master bath)
- Heating & cooling: Central heating; Central cooling
- Interior features: Attic with pull-down access; Great room with ceiling fan and carpeted floors
- Laundry & utility: Main-level laundry in a heated closet; Washer and dryer included
Neighborhood map
What this means for you Summary
Snapshot
- This is a 3-bed/2.0-bath single-family listed at $198k.
Deal economics
- At list price, monthly cash flow is $1k ($12k/yr) — positive.
- The deal already cash-flows at list — no discount required.
- Meets the 1% rule at list price ($3k rent vs $198k).
Location & tenants
- Location reads 67/100 on livability (#102 in SC) — a middle-class / working-renter tenant base. Strengths: crime A+, employment A+, housing A+; Watch: amenities F, commute F, cost of living F.
- Lexington 05 (suburban): math 47% / reading 55% proficiency, ranked #5 of 80 in SC (top 6%) — acceptable for families but not a draw, mixed tenant base, ~2y average lease.
- Zoned schools: Lake Murray Elementary (math 78% / reading 82%, grade A+, #4 of 597 statewide, top 1%, 809 students, 18% FRL); Chapin High (math 82% / reading 91%, grade A, #7 of 196 statewide, top 4%, 1,615 students, 100% FRL) — zoned schools average 59% FRL vs 27% district-wide (32 pts higher); higher-poverty schools than district average — tighter screening recommended.
- Zoned-school proficiency averages 83% at this address vs 51% district-wide (+32 pts) — the actual schools serving this property are materially stronger than the Lexington 05 average implies; a family-tenant draw the district grade alone would hide.
- Market conditions: 1 active listings in the ZIP; 1 comparable units currently listed for rent nearby; 1,712 units permitted in Lexington County in 2024 (0 in 5+ unit buildings).
Forward outlook
- In year one you build about $7k of equity ($1k loan paydown + $6k appreciation (3.0% local appreciation)).
- Lexington County population projected at +26% by 2050 — long-run rental-demand tailwind backs the buy-and-hold thesis.
- At projected returns (3.0% appreciation + 3.0% rent growth), your $55k cash investment doubles in ~3 years — after that, you're playing with house money.
- By year 5, paydown + projected appreciation supports a ~$32k cash-out refi (75% LTV) — recoverable capital for the next deal without selling this one.
Negotiation context
- Only 9 days on market — expect competitive offers; lowballing is unlikely to land.
- 4 sale attempts since 5y ago with the ask held roughly flat each time — persistent listings suggest the price (not the market) is what's stuck; bring a comps-based counter.
- Current owner paid $140k; 41% above their basis — modest negotiation headroom, anchor on the comps not their cost.
Risks & watch-outs
- Climate carrying-cost: major wind risk, 49% chance of damaging wind over 30y; extreme-heat days projected 7→16/yr by 2055 (HVAC capex compounding) — expect insurance premiums to compound above CPI over the hold.
Questions for the listing agent
- Is there a deadline driving the sale (1031 exchange, divorce, estate, relocation)? That informs how much negotiation room exists.
- Schools are D-rated, which usually means shorter tenancies and higher turnover. Who's the typical renter profile here, and what's been the actual vacancy rate?
- What's the average days-on-market for RENTAL listings here right now (not sales)? A rising rental-DOM trend means longer vacancies and softer asking-rent achievability than the comps imply.
- What's the recent tenant-quality profile in this submarket — average credit score on applications, eviction rate, late-payment / NSF rate, and stable-employment percentage? A property-management company in the area should have these aggregated.
- How much new for-sale + rental construction is in the pipeline within 1–3 miles? Heavy new supply typically softens prices + rents 12–24 months out; constrained supply supports both.
Investment metrics
- 1% rule
- 1.62% ✓
- Cap rate
- 12.47%
- Cash-on-cash
- 22.07%
- DSCR
- 1.98
- GRM
- 5.2
CMA / ARV
No comps found within radius.
Projected returns pro-forma
3.0% appreciation · 3.0% rent growth · sell at horizon
- IRR
- 28.3%
- Equity multiple
- 2.60×
- Total profit
- $88,914
- Equity at exit
- $89,029
- IRR
- 28.9%
- Equity multiple
- 5.07×
- Total profit
- $225,746
- Equity at exit
- $137,205
Cash invested: $55,440 (down + closing). Projections, not guarantees.
Landlord ↔ Tenant lean methodology
- Overall (STATE)
- 90 Strongly Landlord-Friendly
- State South Carolina
- 90 Strongly Landlord-Friendly · R+6
- County
- — inherits STATE
- City
- — inherits STATE
ZIP-level market 29036-8694
- Active inventory
- 1
- Price-to-rent
- 5.2×
Monthly cashflow live
- Estimated rent
- $3,200 medium interval (Pro) →
- Mortgage (P&I)
- −$1,038
- Tax from tax record
- −$388 /mo · $4,653/yr
- Insurance
- −$82
- HOA
- −$0
- Vacancy / Maint / Mgmt
- −$672
- Net cashflow
- $1,019
Break-even live
UW: 25.0% down · 7.5% · 30yr · 1.5% tax · 5.0% vac · 8.0% maint · 8.0% mgmt
Financing live
Cash to close
- Down payment
- $49,500
- Closing costs
- $5,940
- Reserves months
- —
- Total cash needed
- —
Loan-product check · same deal, 3 products live
Conventional
25% down · 7.5% · 30yr
- Down + closing
- —
- Monthly P&I
- —
- Monthly cashflow
- —
- DSCR
- —
- Eligible?
- —
Personal DTI + credit; lowest rate.
DSCR
20% down · 8.5% · 30yr
- Down + closing
- —
- Monthly P&I
- —
- Monthly cashflow
- —
- DSCR
- —
- Eligible?
- —
No personal income docs; deal must DSCR.
Hard money
10% down · 12.0% · 12mo
- Down + closing
- —
- Monthly P&I
- —
- Monthly cashflow
- —
- DSCR
- —
- Eligible?
- —
Short-term bridge; refi at stabilization.
Rent comps 1 comps
| Address | Beds | Baths | Sqft | Rent | $/sqft | DOM | Units | Dist |
|---|---|---|---|---|---|---|---|---|
| 217 Whispering Oak Ln Chapin, SC | 3.0 | 2.0 | 1375 | $3,200 | $2.33 | 11d | 1 | 1.44mi |
Listing history 8 events
-
2026-06-18days on market $198,000 Active 9 DOM
-
2026-06-17days on market $198,000 Active 8 DOM
-
2026-06-16days on market $198,000 Active 7 DOM
-
2026-06-15days on market $198,000 Active 6 DOM
-
2026-06-14days on market $198,000 Active 4 DOM
-
2026-06-13days on market $198,000 Active 3 DOM
-
2026-06-10remarks 490-char remark
-
2026-06-10$198,000 Active 1 DOM
ⓘ Source: listings_history table (triggers on properties + properties_extension) + one-shot
backfill from property_details.listing_events for pre-trigger history.
Tax reassessment forecast SC · Resets to sale price
- Current annual tax
- $4,653 · $388/mo
- Projected year-2 tax
- $4,653 · $388/mo
- Expected delta
- $0/yr ($0/mo · 0.0%)
ⓘ Screening estimate from a state-policy table — verify with the county assessor before closing.
Climate risk First Street
- Flood 1/10 Low FEMA zone X (unshaded) · 0% chance over 30 yrs
- Wildfire 4/10 Moderate
- Heat 6/10 Major 7 d/yr ≥108°F today · 16 d/yr by 30 yrs out
- Wind 6/10 Major 49% chance of damaging wind over 30 yrs
- Air quality 3/10 Moderate 2 unhealthy d/yr today · 3 by 30 yrs out
Nearby sold comps map
Loading sold comps map…
Walkable amenities ~0.75 mi
Loading nearby amenities…
Taxation est. · year 1
- Rental income
- $38,400
- − Mortgage interest
- −$11,091
- − Property taxes
- −$4,653
- − Insurance
- −$990
- − Repairs & maintenance
- −$3,072
- − Management
- −$3,072
- − Depreciation
- −$5,760
- Taxable income
- $9,762
- Est. tax owed @ 24.0%
- −$2,343
- After-tax cash flow
- $9,890/yr
For passive investors: Depreciation is non-cash, so a rental often shows a tax loss while cash-flowing — sheltering income. Rental losses are passive: they offset passive income freely, and up to $25,000/yr can offset ordinary (W-2) income if you actively participate and your MAGI is under $100k (phasing out to $0 by $150k); unused losses carry forward. On sale, claimed depreciation is recaptured at up to 25%, and gains may owe capital-gains tax (a 1031 exchange can defer both). Figures are a year-1 estimate at your 24.0% rate — not tax advice; consult a CPA.
Schools (NCES district)
- District
- Lexington 05
- NCES district ID
- 4502820
- Math proficiency
- 47% ▼ -7.00%
- Reading proficiency
- 55% ▼ -4.00%
- Median HH income
- $67,732
- Composite
- 45.28/100
- National rank
- #2656
- State rank
- #5 of 80 in SC
Livability — Lake Murray of Richland
- Score
- 67/100
- State rank
- #102
- US rank
- #10903
Category grades
Schools grade is shown separately in the Schools card above.
Census & demographics
No demographic data for this ZIP.
Market trends
- HPI YoY
- —
- Current HPI
- —
- Rent YoY
- —
- Metro
- —
- State GDP YoY
- ▲ 4.51%
- F500 in state
- 2
Industry mix (Fortune 500 HQ in SC)
| Industry | F500 HQs | Revenue |
|---|---|---|
| Packaging | 1 | $7B |
|
||
Price history
+209.4% since first listed17 events — show timeline
- 2026-06-09 Listed $198,000 Consolidated MLS
- 2025-04-07 Rental Removed $1,450 APPFOLIO
- 2025-03-14 Price Changed $1,450 APPFOLIO
- 2025-01-14 Price Changed $1,550 APPFOLIO
- 2024-12-05 Listed for Rent $1,650 APPFOLIO
- 2023-12-02 Pending — Consolidated MLS
- 2023-11-17 Contingent — Consolidated MLS
- 2023-11-14 Price Changed $179,000 Consolidated MLS
- 2023-10-27 Price Changed $194,000 Consolidated MLS
- 2023-10-13 Listed $199,900 Consolidated MLS
- 2021-09-01 Sold (Public Records) $140,000 Public Records
- 2021-08-01 Delisted — Consolidated MLS
- 2021-07-30 Listed $147,000 Consolidated MLS
- 2010-06-22 Sold (Public Records) $110,000 Public Records
- 2007-12-28 Sold (Public Records) $113,000 Public Records
- 2006-07-07 Sold (Public Records) $80,000 Public Records
- 2004-07-13 Sold (Public Records) $64,000 Public Records
Property tax history
+10.6%/yrLatest (2024): $4,653 · +28.1% YoY. Source: county tax records.
Cash-flow waterfall
monthlySold comps — $/sqft
last 12 mo · ≤1 miLoading sold comps…