 Triplex
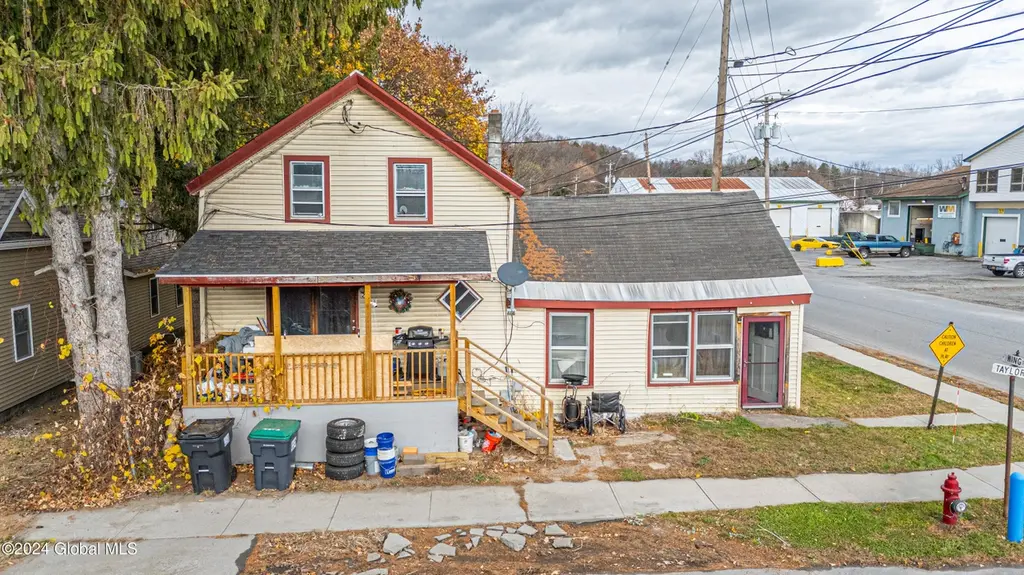
27-29 Taylor St · Fort Edward, NY
Flood risk 9/10 · Severe
- FEMA flood zone
- X
- Chance of flooding over 30 yrs
- 0.99%
- Est. flood insurance / yr
- $473 – $860
Fire risk 3/10 · Minor
- Est. fire insurance / yr
- $691 – $1,283
Heat risk 3/10 · Minor
- Hot days now (above 97°F)
- 7 days/yr
- Hot days in 30 yrs
- 16 days/yr
Wind risk 2/10 · Minimal
- Chance of severe wind over 30 yrs
- 3.0%
Air-quality risk 1/10 · Minimal
- Unhealthy air days now
- 0 days/yr
- Unhealthy air days in 30 yrs
- 0 days/yr
Risk factors via First Street. Map © Google.
Why this score? — see what drove the A grade
The composite is a weighted blend of 9 inputs, each scored 0–100. Each bar is that input's sub-score; the figure is the points it added to the 100-point composite (weight × sub-score).
- Cash flow +30.0/30.0
- ARV discount +15.0/15.0
- 1% rule +10.0/10.0
- DSCR +10.0/10.0
- Appreciation +8.0/10.0
- Schools +4.3/10.0
- Livability +3.7/5.0
- Rent growth +2.5/5.0
- Condition / age +2.2/5.0
$119,900
🖨 Deal sheet (PDF) 📄 Offer letter ✓ Due diligence
Multi-family units
County records classify this as Multi-Family (2-4 Unit). Listing-text estimate: 3 units. confirmed
Listing remarks MLS
Attention Investors! 3-unit multi-family with a double lot and tons of upside. Features include (1) 3-bedroom unit, (1) 1-bedroom unit, and (2) 2-bedroom units. Long-term tenants pay their own utilities; units are separately metered. Property is conveniently located right next to the train station and bus lines, and features natural gas heat. Can be sold with 36 River St., Hudson Falls, and 192 Broadway, Fort Edward.
Key facts
- Multi-family
- Double lot
- Long term tenants
Tags
Neighborhood map
What this means for you Summary
Snapshot
- This is a 2×2bd/1.0ba + 1×1bd/1.0ba units multifamily listed at $120k. Condition is rated fair.
Deal economics
- At list price, monthly cash flow is $1k ($18k/yr) — positive. Per door: $492/mo.
- The deal already cash-flows at list — no discount required.
- Meets the 1% rule at list price ($3k rent vs $120k).
- Recommended offer: $113k (6.0% below list) — sets the bar for market timing.
- Cap rate 21.6% vs local median 3.8% in Fort Edward — top-decile yield for the area; either an underpriced asset or a hidden risk that comps aren't pricing in. Stress-test before assuming the spread holds.
Location & tenants
- Location reads 73/100 on livability (#334 in NY) — a middle-class / working-renter tenant base. Strengths: housing A+, health & safety A+, cost of living A; Watch: schools D+, commute D+, employment D.
- Fort Edward Union Free School District (suburban): math 50% / reading 45% proficiency, ranked #512 of 755 in NY (top 68%) — families likely to look elsewhere, expect single-tenant / working-renter base with shorter leases.
- Market conditions: 45 active listings in the ZIP; 106 units permitted in Washington County in 2024 (0 in 5+ unit buildings).
Forward outlook
- In year one you build about $8k of equity ($829 loan paydown + $7k appreciation (6.1% local appreciation)).
- Washington County population projected at -20% by 2050 — secular population decline; favor cash flow + early exit over multi-decade hold.
- At projected returns (6.1% appreciation + 3.0% rent growth), your $34k cash investment doubles in ~2 years — after that, you're playing with house money.
- By year 5, paydown + projected appreciation supports a ~$36k cash-out refi (75% LTV) — recoverable capital for the next deal without selling this one.
Negotiation context
- It's been on market 74 days — a 6% lower offer ($113k) is reasonable based on typical stale-listing flexibility.
- 9 sale attempts since 16y ago; this cycle's ask has dropped $10k (8%) from the opening price — seller is motivated, your offer sets the floor, not the list.
Risks & watch-outs
- Watch-outs: flood insurance adds $56/mo; built in 1900 — expect roof / HVAC / electrical / plumbing capex.
- Climate carrying-cost: severe flood risk — expect insurance premiums to compound above CPI over the hold.
Questions for the listing agent
- It's been on market 74 days. Have you received any prior offers? Is the seller open to a 6% concession, seller financing, or rate buy-down credit?
- Can we see the unit-by-unit rent roll, current vacancy, and any below-market leases? What's the average tenancy length?
- What capital expenditures (roof, boiler, parking lot, exteriors) have been made in the last 5 years, and what's planned in the next 2?
- Have any recent inspections been done? Can we get a copy of the seller's disclosures and any deferred-maintenance estimates?
- Built in 1900 — when were the roof, HVAC, electrical panel, plumbing, and water heater last replaced?
- What's the actual annual flood-insurance premium (NFIP or private), and is the property in a SFHA with mandatory coverage?
- Why hasn't it sold? Are there any deal-killer items the seller is aware of (foundation, flood, title, zoning, code violations)?
- Is there a deadline driving the sale (1031 exchange, divorce, estate, relocation)? That informs how much negotiation room exists.
- Schools are D-rated, which usually means shorter tenancies and higher turnover. Who's the typical renter profile here, and what's been the actual vacancy rate?
- What's the average days-on-market for RENTAL listings here right now (not sales)? A rising rental-DOM trend means longer vacancies and softer asking-rent achievability than the comps imply.
- What's the recent tenant-quality profile in this submarket — average credit score on applications, eviction rate, late-payment / NSF rate, and stable-employment percentage? A property-management company in the area should have these aggregated.
- How much new apartment / multifamily construction is in the pipeline within 1–3 miles? Heavy new supply (>2% of stock underway) typically softens rents 12–24 months out; light construction supports rent growth.
Investment metrics
- 1% rule
- 2.49% ✓
- Cap rate
- 21.61%
- Cash-on-cash
- 54.70%
- DSCR
- 3.43
- GRM
- 3.3
CMA / ARV
- ARV (median comp)
- $205,130
- List price
- $119,900
- Delta
- -41.55%
- Verdict
- UNDERPRICED
- Comps
- 14 within 1.0 mi
Show comp detail 2 sales within ~0.75 mi
| Address | Dist | Beds/Ba | Sqft | Sold | Price | $/sf | Match |
|---|---|---|---|---|---|---|---|
| 4-6 Liberty St | 0.33mi | 5/3.0 (-1) | 1,726 (-2%) | 9mo | $115,000 | $67 | 68 |
| 41 Mechanic St | 0.50mi | 6/2.0 | 1,868 (+6%) | 7mo | $161,120 | $86 | 57 |
Match score weights: distance 35% · size 25% · config 20% · recency 20%. Top-matched comps best support the ARV.
Projected returns pro-forma
6.08% appreciation · 3.0% rent growth · sell at horizon
- IRR
- 61.4%
- Equity multiple
- 4.85×
- Total profit
- $129,181
- Equity at exit
- $75,963
- IRR
- 58.2%
- Equity multiple
- 10.13×
- Total profit
- $306,441
- Equity at exit
- $138,266
Cash invested: $33,572 (down + closing). Projections, not guarantees.
Landlord ↔ Tenant lean methodology
- Overall (STATE)
- 15 Strongly Tenant-Friendly
- State New York
- 15 Strongly Tenant-Friendly · D+10
- County
- — inherits STATE
- City
- — inherits STATE
ZIP-level market 12828
- Home prices YoY
- 1.9%
- Active inventory
- 45
- Price-to-rent
- 9.9×
Monthly cashflow live
- Estimated rent
- $2,986 medium interval (Pro) →
- Mortgage (P&I)
- −$629
- Tax est. 1.5%
- −$150 /mo · $1,798/yr
- Insurance
- −$50
- Flood insurance flood zone
- −$56 /mo · $666/yr
- HOA
- −$0
- Vacancy / Maint / Mgmt
- −$627
- Net cashflow
- $1,475
Break-even live
Sensitivity live
| Price | -10% $1,558 | -5% $1,516 | +0% $1,475 | +5% $1,433 | +10% $1,392 |
|---|---|---|---|---|---|
| Rent | -10% $1,239 | -5% $1,357 | +0% $1,475 | +5% $1,593 | +10% $1,711 |
| Rate | -1.0pp $1,535 | -0.5pp $1,505 | base $1,475 | +0.5pp $1,444 | +1.0pp $1,412 |
3-unit breakdown (identical units grouped — click to expand)
| Units | Beds | Baths | Est. rent |
|---|---|---|---|
| 2× units | 2 | 1 | $2,014 |
| #1 | 2 | 1 | $1,007 |
| #2 | 2 | 1 | $1,007 |
| 1× unit | 1 | 1 | $972 |
| Total (3 units) | $2,986 | ||
UW: 25.0% down · 7.5% · 30yr · 1.5% tax · 5.0% vac · 8.0% maint · 8.0% mgmt
Financing live
Cash to close
- Down payment
- $29,975
- Closing costs
- $3,597
- Reserves months
- —
- Total cash needed
- —
Loan-product check · same deal, 3 products live
Conventional
25% down · 7.5% · 30yr
- Down + closing
- —
- Monthly P&I
- —
- Monthly cashflow
- —
- DSCR
- —
- Eligible?
- —
Personal DTI + credit; lowest rate.
DSCR
20% down · 8.5% · 30yr
- Down + closing
- —
- Monthly P&I
- —
- Monthly cashflow
- —
- DSCR
- —
- Eligible?
- —
No personal income docs; deal must DSCR.
Hard money
10% down · 12.0% · 12mo
- Down + closing
- —
- Monthly P&I
- —
- Monthly cashflow
- —
- DSCR
- —
- Eligible?
- —
Short-term bridge; refi at stabilization.
Listing history 39 events
-
2026-06-21days on market $119,900 Active 74 DOM
-
2026-06-21days on market $119,900 Active 73 DOM
-
2026-06-18days on market $119,900 Active 71 DOM
-
2026-06-17days on market $119,900 Active 70 DOM
-
2026-06-16days on market $119,900 Active 69 DOM
-
2026-06-15days on market $119,900 Active 68 DOM
-
2026-06-13days on market $119,900 Active 66 DOM
-
2026-06-12days on market $119,900 Active 65 DOM
-
2026-06-09days on market $119,900 Active 62 DOM
-
2026-06-08days on market $119,900 Active 61 DOM
-
2026-06-07days on market $119,900 Active 60 DOM
-
2026-06-07days on market $119,900 Active 59 DOM
-
2026-06-04days on market $119,900 Active 56 DOM
-
2026-06-02days on market $119,900 Active 55 DOM
-
2026-06-01days on market $119,900 Active 54 DOM
-
2026-05-31days on market $119,900 Active 53 DOM
-
2026-04-17price $119,900 420-char remark
Show marketing remark (420 chars)
Attention Investors! 3-unit multi-family with a double lot and tons of upside. Features include (1) 3-bedroom unit, (1) 1-bedroom unit, and (2) 2-bedroom units. Long-term tenants pay their own utilities; units are separately metered. Property is conveniently located right next to the train station and bus lines, and features natural gas heat. Can be sold with 36 River St., Hudson Falls, and 192 Broadway, Fort Edward.
-
2026-04-07$129,900 Active 420-char remark
Show marketing remark (420 chars)
Attention Investors! 3-unit multi-family with a double lot and tons of upside. Features include (1) 3-bedroom unit, (1) 1-bedroom unit, and (2) 2-bedroom units. Long-term tenants pay their own utilities; units are separately metered. Property is conveniently located right next to the train station and bus lines, and features natural gas heat. Can be sold with 36 River St., Hudson Falls, and 192 Broadway, Fort Edward.
-
2026-02-19status Active
-
2026-02-02historical Contingent
-
2026-02-02historical
-
2026-01-20status Active
-
2025-12-29historical Contingent
-
2025-12-19status Active
-
2025-12-19price $129,900
-
2025-09-18status Pending
-
2025-09-11historical Contingent
-
2025-08-20price $125,000
-
2025-07-30$145,000 Active
-
2025-07-30historical
-
2025-06-10price $145,000
-
2025-04-29$170,000 Active
-
2025-04-28historical
-
2025-04-04price $170,000
-
2025-02-19status Active
-
2025-02-18historical
-
2024-11-16$185,000 Active
-
2010-12-23historical
-
2010-06-23$99,900
ⓘ Source: listings_history table (triggers on properties + properties_extension) + one-shot
backfill from property_details.listing_events for pre-trigger history.
Climate risk First Street
- Flood 9/10 Extreme FEMA zone X · 99% chance over 30 yrs
- Wildfire 3/10 Moderate
- Heat 3/10 Moderate 7 d/yr ≥97°F today · 16 d/yr by 30 yrs out
- Wind 2/10 Low 3% chance of damaging wind over 30 yrs
- Air quality 1/10 Low 0 unhealthy d/yr today · 0 by 30 yrs out
Nearby sold comps map
Loading sold comps map…
Walkable amenities ~0.75 mi
Loading nearby amenities…
Taxation est. · year 1
- Rental income
- $35,832
- − Mortgage interest
- −$6,716
- − Property taxes
- −$1,798
- − Insurance
- −$1,266
- − Repairs & maintenance
- −$2,867
- − Management
- −$2,867
- − Depreciation
- −$3,488
- Taxable income
- $16,830
- Est. tax owed @ 24.0%
- −$4,039
- After-tax cash flow
- $13,658/yr
For passive investors: Depreciation is non-cash, so a rental often shows a tax loss while cash-flowing — sheltering income. Rental losses are passive: they offset passive income freely, and up to $25,000/yr can offset ordinary (W-2) income if you actively participate and your MAGI is under $100k (phasing out to $0 by $150k); unused losses carry forward. On sale, claimed depreciation is recaptured at up to 25%, and gains may owe capital-gains tax (a 1031 exchange can defer both). Figures are a year-1 estimate at your 24.0% rate — not tax advice; consult a CPA.
Condition & rehab AI · 12 photos
This 3-unit multi-family property requires moderate renovations, including updating the kitchen and HVAC system, to improve its resale and rental value.
Repairs flagged
- Major kitchen cabinets — Severely outdated and worn
- Major kitchen countertops — Severely worn and dirty
- Moderate exterior siding — Weathered and in need of repainting
- Major HVAC system — No visible photos
Value-add opportunities
- Both Paint and update kitchen cabinets — Improves both resale and rental value
- Both Replace HVAC system — Improves both resale and rental value
- Both Landscaping and curb appeal — Improves both resale and rental value
Renovation cost estimate screening
| Repair item | Severity | Est. cost |
|---|---|---|
| kitchen cabinets · Severely outdated and worn | Major | $15,000–50,000 |
| kitchen countertops · Severely worn and dirty | Major | $15,000–50,000 |
| exterior siding · Weathered and in need of repainting | Moderate | $3,000–15,000 |
| HVAC system · No visible photos | Major | $15,000–50,000 |
| Total estimated repair cost · 4 items | $48,000–165,000 |
Value-add ROI direction
- Both Paint and update kitchen cabinets — Improves both resale and rental value ↑
- Both Replace HVAC system — Improves both resale and rental value ↑
- Both Landscaping and curb appeal — Improves both resale and rental value ↑
ⓘ Cost ranges are severity-bucket heuristics (US national rule-of-thumb). Get contractor quotes + a written scope before underwriting a rehab budget.
Schools (NCES district)
- District
- Fort Edward Union Free School District
- NCES district ID
- 3611310
- Math proficiency
- 50% ▼ -10.00%
- Reading proficiency
- 45% ▬ 0.00%
- Median HH income
- $49,124
- Composite
- 42.76/100
- National rank
- #6771
- State rank
- #512 of 755 in NY
Livability — Fort Edward
- Score
- 73/100
- State rank
- #334
- US rank
- #5647
Category grades
Schools grade is shown separately in the Schools card above.
Census & demographics
- Census place
- Fort Edward, NY
- Population (ZIP)
- 9,775
Population outlook (Washington County) Hauer SSP2
- Today (2025)
- 59,576 people
- By 2030
- 57,618 · -3.3%
- By 2040
- 52,751 · -11.5%
- By 2050
- 47,514 · -20.2%
- By 2075
- 35,690 · -40.1%
- By 2100
- 24,807 · -58.4%
Race, ethnicity, and origin ACS 2023
- Neighborhood character
- Predominantly White (94%)
- Race & ethnicity
- White 94% Two or more races 3% Hispanic / Latino 2%
- Common ancestry
- Lithuanian 12% Iranian 3% Romanian 3%
- Foreign-born
- 3% · Canada
- Languages at home
- 96% English-only · Spanish 2% Other Indo-European 1%
Political lean MEDSL · Washington
- 2024 margin
- Strong R (+21.2) · D 39.4% · R 60.6%
- 2008→2024 swing
- -22.0pp toward R · 2008: 0.8pp · 2024: -21.2pp
- All cycles
- 2024: R+21.2 2020: R+15.6 2016: R+20.2 2012: D+1.6 2008: D+0.8
Not yet ingested
- Civics
- —
Market trends
- HPI YoY
- ▲ 6.08%
- Current HPI
- 327.6439
- Rent YoY
- —
- Metro
- —
- State GDP YoY
- ▲ 2.60%
- F500 in state
- 92
Industry mix (Fortune 500 HQ in NY)
| Industry | F500 HQs | Revenue |
|---|---|---|
| Financial Services | 10 | $950B |
|
||
| Consumer Goods | 9 | $162B |
|
||
| Insurance | 4 | $225B |
|
||
| Telecommunications | 2 | $144B |
|
||
| Pharmaceuticals | 2 | $112B |
|
||
| Media / Entertainment | 2 | $69B |
|
||
Price history
+20.0% since first listed23 events — show timeline
- 2026-04-17 Price Changed $119,900 Global MLS
- 2026-04-07 Listed $129,900 Global MLS
- 2026-02-19 Relisted — Global MLS
- 2026-02-02 Contingent — Global MLS
- 2026-02-02 Listing Removed — Global MLS
- 2026-01-20 Relisted — Global MLS
- 2025-12-29 Contingent — Global MLS
- 2025-12-19 Relisted — Global MLS
- 2025-12-19 Price Changed $129,900 Global MLS
- 2025-09-18 Pending — Global MLS
- 2025-09-11 Contingent — Global MLS
- 2025-08-20 Price Changed $125,000 Global MLS
- 2025-07-30 Listed $145,000 Global MLS
- 2025-07-30 Listing Removed — Global MLS
- 2025-06-10 Price Changed $145,000 Global MLS
- 2025-04-29 Listed $170,000 Global MLS
- 2025-04-28 Listing Removed — Global MLS
- 2025-04-04 Price Changed $170,000 Global MLS
- 2025-02-19 Relisted — Global MLS
- 2025-02-18 Listing Removed — Global MLS
- 2024-11-16 Listed $185,000 Global MLS
- 2010-12-23 Listing Removed — Global MLS
- 2010-06-23 Listed $99,900 Global MLS
Cash-flow waterfall
monthlySold comps — $/sqft
last 12 mo · ≤1 miLoading sold comps…