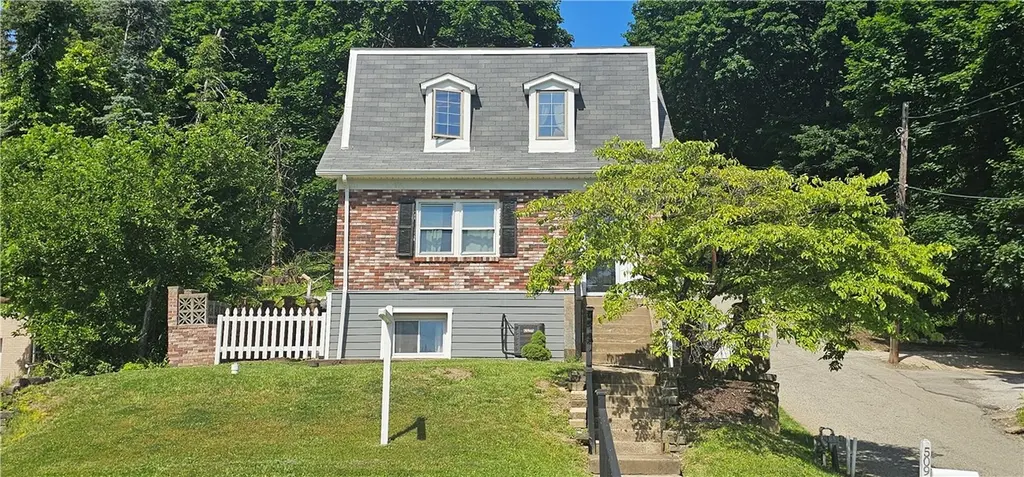
509 Bascom Ave · Pittsburgh, PA
Flood risk 1/10 · Minimal
- FEMA flood zone
- X (unshaded)
- Chance of flooding over 30 yrs
- 0.0%
- Est. flood insurance / yr
- $473 – $860
Fire risk 1/10 · Minimal
- Est. fire insurance / yr
- $511 – $949
Heat risk 3/10 · Minor
- Hot days now (above 97°F)
- 7 days/yr
- Hot days in 30 yrs
- 17 days/yr
Wind risk 2/10 · Minimal
- Chance of severe wind over 30 yrs
- —
Air-quality risk 4/10 · Minor
- Unhealthy air days now
- 4 days/yr
- Unhealthy air days in 30 yrs
- 5 days/yr
Risk factors via First Street. Map © Google.
Why this score? — see what drove the C- grade
The composite is a weighted blend of 9 inputs, each scored 0–100. Each bar is that input's sub-score; the figure is the points it added to the 100-point composite (weight × sub-score).
- ARV discount +15.0/15.0
- Cash flow +13.3/30.0
- Schools +5.2/10.0
- Livability +4.2/5.0
- DSCR +4.0/10.0
- 1% rule +3.9/10.0
- Rent growth +3.5/5.0
- Condition / age +2.5/5.0
- Appreciation +0.0/10.0
$200,000
🖨 Deal sheet (PDF) 📄 Offer letter ✓ Due diligence
Listing remarks MLS
Welcome to this charming 3 bedroom, 1 1/2 bath home located in Ross Twp. and North Hills school district, just minutes from I-279, Ross Park Mall, and downtown Pittsburgh. Thoughtful updates provide comfort and peace of mind, including a new roof, water heater, electrical, central air, fresh paint, and new sewer line inside and out. Inside you'll find character and warmth from the living area to the mudroom that features built-in cubbies and a wood burning fireplace. The upstairs bathroom has been tastefully remodeled, while the finished basement and half bath create extra living space perfect for entertaining, relaxing, or working from home. With its blend of updates, character, and convenient location close to shopping, dining, and everything Pittsburgh has to offer, this home is move-in-ready and full of charm! Home Warranty included with purchase of property.
Key facts
- Fresh paint
- Water heater
- Electrical
Tags
Property features AI
Exterior
- Parking: Off-street parking
- Utilities: Public water; Public sewer
- Home design: 2-story home; Resale property; Asphalt roof
- Construction: Brick and frame construction; Home warranty included
- Exterior features: Public transportation nearby
Interior
- Kitchen: Kitchen on main level (10 x 9); Refrigerator; Stove
- Bedrooms: Bedroom 2 on upper level (15 x 10); Bedroom 3 on upper level (19 x 8); Additional bedroom-sized space on upper level (16 x 11); Bonus room on main level (17 x 7)
- Flooring: Carpet; Ceramic tile; Hardwood
- Bathrooms: 1 full bathroom; 1 half bathroom
- Heating & cooling: Gas forced-air heating; Central air conditioning
- Interior features: Finished basement with interior entry; Wood-burning fireplace
- Laundry & utility: Laundry room in basement (14 x 8); Washer; Dryer
Neighborhood map
What this means for you Summary
Snapshot
- This is a 3-bed/1.5-bath single-family listed at $200k.
Deal economics
- At list price, monthly cash flow is $1 ($14/yr) — positive.
- The deal already cash-flows at list — no discount required.
- To meet the 1% rule (rent ≥ 1% of price), the offer needs to be $177k (11.3% below list).
- Recommended offer: $177k (11.3% below list) — sets the bar for 1% rule.
- Cap rate 6.3% vs local median 3.7% in Pittsburgh — top-decile yield for the area; either an underpriced asset or a hidden risk that comps aren't pricing in. Stress-test before assuming the spread holds.
Location & tenants
- Location reads 85/100 on livability (#76 in PA, #546 nationally) — a professional / high-income tenant draw. Strengths: amenities A+, commute A+, cost of living A+; Watch: crime D-.
- North Hills SD (suburban): math 48% / reading 72% proficiency, ranked #70 of 539 in PA (top 13%) — acceptable for families but not a draw, mixed tenant base, ~2y average lease; only 20% free/reduced lunch — higher-income household profile.
- Zoned schools: Highcliff El Sch (math 49% / reading 73%, grade B, #368 of 1,518 statewide, top 24%, 540 students, 28% FRL); North Hills Ms (math 37% / reading 70%, grade C+, #86 of 512 statewide, top 17%, 1,070 students, 28% FRL); North Hills Shs (math 71% / reading 75%, grade B+, #35 of 437 statewide, top 8%, 1,383 students, 24% FRL).
- Market conditions: Rents rising fast (+4.0%/yr); 12 active listings in the ZIP; 8 comparable units currently listed for rent nearby; rentals lingering (median 46d on market — plan ~5-8 weeks vacancy on turnover, expect pricing pressure); 50% of comp listings sitting > 30 days — soft ceiling on asking rent; 2,996 units permitted in Allegheny County in 2024 (1,588 in 5+ unit buildings).
- This rent runs 33% of the median local income ($64k/yr) — at the standard rent-burdened threshold; future hikes will face affordability resistance.
Forward outlook
- Local home prices are declining (-3.0%/yr); year-one equity from $1k of loan paydown is wiped out by about $6k of value loss. Plan a longer hold.
Negotiation context
- Only 5 days on market — expect competitive offers; lowballing is unlikely to land.
- 3 sale attempts since 22y ago with the ask held roughly flat each time — persistent listings suggest the price (not the market) is what's stuck; bring a comps-based counter.
- Current owner paid $43k; list at $200k implies a 365% gain — meaningful room to come down on a strong offer.
Risks & watch-outs
- Watch-outs: built in 1940 — expect roof / HVAC / electrical / plumbing capex.
Questions for the listing agent
- Built in 1940 — when were the roof, HVAC, electrical panel, plumbing, and water heater last replaced?
- Is there a deadline driving the sale (1031 exchange, divorce, estate, relocation)? That informs how much negotiation room exists.
- Schools are B-rated — typically a magnet for longer-tenancy family renters. What's the average tenant stay here, and is there a school-zone premium baked into asking?
- Crime grade is D in this area — have there been break-ins, vandalism, or insurance claims at this property in the last 3 years? What carrier currently insures it and at what premium?
- What's the average days-on-market for RENTAL listings here right now (not sales)? A rising rental-DOM trend means longer vacancies and softer asking-rent achievability than the comps imply.
- What's the recent tenant-quality profile in this submarket — average credit score on applications, eviction rate, late-payment / NSF rate, and stable-employment percentage? A property-management company in the area should have these aggregated.
- How much new for-sale + rental construction is in the pipeline within 1–3 miles? Heavy new supply typically softens prices + rents 12–24 months out; constrained supply supports both.
Investment metrics
- 1% rule
- 0.89% ✗
- Cap rate
- 6.30%
- Cash-on-cash
- 0.02%
- DSCR
- 1.00
- GRM
- 9.4
CMA / ARV
- ARV (on-the-fly)
- $267,960
- Comps found
- 12
Show comp detail 12 sales within ~0.75 mi
| Address | Dist | Beds/Ba | Sqft | Sold | Price | $/sf | Match |
|---|---|---|---|---|---|---|---|
| 15 Clarion Ave | 0.48mi | 3/2.5 | 1,625 (+0%) | 6mo | $244,900 | $151 | 69 |
| 106 Longmount Dr | 0.48mi | 4/1.5 (+1) | 1,652 (+2%) | 2mo | $305,000 | $185 | 68 |
| 258 Brighton Rd | 0.36mi | 3/1.0 | 1,500 (-8%) | 2mo | $158,000 | $105 | 66 |
| 76 Sumner Ave | 0.27mi | 3/1.5 | 1,846 (+14%) | 2mo | $287,000 | $155 | 63 |
| 1541 Pennock Rd | 0.39mi | 3/2.0 | 1,516 (-7%) | 7mo | $250,000 | $165 | 63 |
| 8 Keswick Ave | 0.35mi | 3/1.5 | 1,821 (+12%) | 5mo | $280,000 | $154 | 59 |
| 4024 Oswald St | 0.52mi | 3/2.5 | 1,536 (-5%) | 6mo | $298,000 | $194 | 58 |
| 1207 San Pedro | 0.48mi | 4/1.5 (+1) | 1,512 (-7%) | 7mo | $209,000 | $138 | 56 |
| 1156 W Point Ave | 0.70mi | 3/1.5 | 1,515 (-7%) | 3mo | $265,500 | $175 | 53 |
| 1224 Goe | 0.72mi | 4/1.0 (+1) | 1,584 (-2%) | 3mo | $277,500 | $175 | 53 |
| 296 Dakota Ave | 0.74mi | 4/1.0 (+1) | 1,686 (+4%) | 5mo | $40,000 | $24 | 48 |
| 199 N Fremont Ave | 0.60mi | 4/2.5 (+1) | 1,408 (-13%) | 2mo | $369,000 | $262 | 39 |
Match score weights: distance 35% · size 25% · config 20% · recency 20%. Top-matched comps best support the ARV.
Projected returns pro-forma
-3.0% appreciation · 4.01% rent growth · sell at horizon
- IRR
- -15.1%
- Equity multiple
- 0.46×
- Total profit
- $-30,477
- Equity at exit
- $29,821
- IRR
- -4.9%
- Equity multiple
- 0.67×
- Total profit
- $-18,667
- Equity at exit
- $17,292
Cash invested: $56,000 (down + closing). Projections, not guarantees.
Landlord ↔ Tenant lean methodology
- Overall (STATE)
- 62 Landlord-Friendly
- State Pennsylvania
- 62 Landlord-Friendly · EVEN
- County
- — inherits STATE
- City
- — inherits STATE
ZIP-level market 15212
- Home prices YoY
- -31.6%
- Rents YoY
- 4.0%
- Active inventory
- 12
- Price-to-rent
- 9.4×
Monthly cashflow live
- Estimated rent
- $1,773 high interval (Pro) →
- Mortgage (P&I)
- −$1,049
- Tax from tax record
- −$268 /mo · $3,212/yr
- Insurance
- −$83
- HOA
- −$0
- Vacancy / Maint / Mgmt
- −$372
- Net cashflow
- $1
Break-even live
Sensitivity live
| Price | -10% $114 | -5% $58 | +0% $1 | +5% $-55 | +10% $-112 |
|---|---|---|---|---|---|
| Rent | -10% $-139 | -5% $-69 | +0% $1 | +5% $71 | +10% $141 |
| Rate | -1.0pp $102 | -0.5pp $52 | base $1 | +0.5pp $-51 | +1.0pp $-103 |
UW: 25.0% down · 7.5% · 30yr · 1.5% tax · 5.0% vac · 8.0% maint · 8.0% mgmt
Financing live
Cash to close
- Down payment
- $50,000
- Closing costs
- $6,000
- Reserves months
- —
- Total cash needed
- —
Loan-product check · same deal, 3 products live
Conventional
25% down · 7.5% · 30yr
- Down + closing
- —
- Monthly P&I
- —
- Monthly cashflow
- —
- DSCR
- —
- Eligible?
- —
Personal DTI + credit; lowest rate.
DSCR
20% down · 8.5% · 30yr
- Down + closing
- —
- Monthly P&I
- —
- Monthly cashflow
- —
- DSCR
- —
- Eligible?
- —
No personal income docs; deal must DSCR.
Hard money
10% down · 12.0% · 12mo
- Down + closing
- —
- Monthly P&I
- —
- Monthly cashflow
- —
- DSCR
- —
- Eligible?
- —
Short-term bridge; refi at stabilization.
Rent comps 8 comps
| Address | Beds | Baths | Sqft | Rent | $/sqft | DOM | Units | Dist |
|---|---|---|---|---|---|---|---|---|
| 189 N Balph Ave Pittsburgh, PA | 3.0 | 1.0 | 1550 | $1,850 | $1.19 | 45d | 1 | 0.76mi |
| 434 Katherine St Pittsburgh, PA | 3.0 | 1.5 | 1344 | $1,295 | $0.96 | 16d | 1 | 0.78mi |
| 555 Orchard Ave Bellevue, PA | 3.0 | 1.0 | 1400 | $1,295 | $0.93 | 45d | 1 | 0.84mi |
| 115 Meade Ave Pittsburgh, PA | 4.0 | 1.0 | 1392 | $1,600 | $1.15 | 45d | 1 | 0.92mi |
| 107 Perryview Ave Pittsburgh, PA | 3.0 | 1.5 | 1534 | $2,250 | $1.47 | 4d | 1 | 0.94mi |
| 713 Clinton Pl Pittsburgh, PA | 4.0 | 2.0 | 1760 | $2,750 | $1.56 | 3d | 1 | 1.06mi |
| 250 Nazareth Way Pittsburgh, PA | 1.0–2.0 | 1.0 | 1187 | $1,150 | $0.97 | 45d | 1 | 1.07mi |
| 100 E West Dr Pittsburgh, PA | 1.0–2.0 | 1.0–1.5 | 912 | $1,640 | $1.80 | 3d | 19 | 1.46mi |
Listing history 4 events
-
2026-06-13statusdays on market $200,000 Pending 5 DOM
-
2026-06-09days on market $200,000 Active 2 DOM
-
2026-06-08remarks 699-char remark
-
2026-06-08$200,000 Active 1 DOM
ⓘ Source: listings_history table (triggers on properties + properties_extension) + one-shot
backfill from property_details.listing_events for pre-trigger history.
Tax reassessment forecast PA · Partial reset (capped growth)
- Current annual tax
- $3,212 · $268/mo
- Projected year-2 tax
- $3,212 · $268/mo
- Expected delta
- $0/yr ($0/mo · -0.0%)
ⓘ Screening estimate from a state-policy table — verify with the county assessor before closing.
Climate risk First Street
- Flood 1/10 Low FEMA zone X (unshaded) · 0% chance over 30 yrs
- Wildfire 1/10 Low
- Heat 3/10 Moderate 7 d/yr ≥97°F today · 17 d/yr by 30 yrs out
- Wind 2/10 Low
- Air quality 4/10 Moderate 4 unhealthy d/yr today · 5 by 30 yrs out
Nearby sold comps map
Loading sold comps map…
Walkable amenities ~0.75 mi
Loading nearby amenities…
Taxation est. · year 1
- Rental income
- $21,281
- − Mortgage interest
- −$11,203
- − Property taxes
- −$3,212
- − Insurance
- −$1,000
- − Repairs & maintenance
- −$1,702
- − Management
- −$1,702
- − Depreciation
- −$5,818
- Taxable loss
- −$3,358
- Est. tax savings @ 24.0%
- +$806
- After-tax cash flow
- $820/yr
For passive investors: Depreciation is non-cash, so a rental often shows a tax loss while cash-flowing — sheltering income. Rental losses are passive: they offset passive income freely, and up to $25,000/yr can offset ordinary (W-2) income if you actively participate and your MAGI is under $100k (phasing out to $0 by $150k); unused losses carry forward. On sale, claimed depreciation is recaptured at up to 25%, and gains may owe capital-gains tax (a 1031 exchange can defer both). Figures are a year-1 estimate at your 24.0% rate — not tax advice; consult a CPA.
Schools (NCES district)
- District
- North Hills SD
- NCES district ID
- 4217220
- Math proficiency
- 48% ▼ -20.00%
- Reading proficiency
- 72% ▼ -10.00%
- Median HH income
- $60,841
- Composite
- 52.02/100
- National rank
- #1637
- State rank
- #70 of 539 in PA
Livability — Pittsburgh
- Score
- 85/100
- State rank
- #76
- US rank
- #546
Category grades
Schools grade is shown separately in the Schools card above.
Census & demographics
- County
- Allegheny County · 1,022,028 people
- City population
- 564,884
- Metro
- Pittsburgh, PA
- Population (ZIP)
- 27,652
- Household income
- $64,077
- Rent vs Own
- Severe rent burden
- 1584.0
Population outlook (Allegheny County) Hauer SSP2
- Today (2025)
- 1,250,282 people
- By 2030
- 1,256,482 · +0.5%
- By 2040
- 1,256,318 · +0.5%
- By 2050
- 1,244,169 · -0.5%
- By 2075
- 1,197,693 · -4.2%
- By 2100
- 1,093,187 · -12.6%
Race, ethnicity, and origin ACS 2023
- Neighborhood character
- Diverse neighborhood (Simpson 0.56)
- Race & ethnicity
- White 62% Black 25% Two or more races 7% Hispanic / Latino 4% Asian 2%
- Common ancestry
- Romanian 6% Lithuanian 3% Serbian 1%
- Foreign-born
- 5% · Canada
- Languages at home
- 94% English-only · Spanish 3% Other Indo-European 1% Arabic 1%
Political lean MEDSL · Allegheny
- 2024 margin
- Strong D (+20.3) · D 59.7% · R 39.4%
- 2008→2024 swing
- +4.8pp toward D · 2008: 15.5pp · 2024: 20.3pp
- All cycles
- 2024: D+20.3 2020: D+20.4 2016: D+16.4 2012: D+14.4 2008: D+15.5
Not yet ingested
- Civics
- —
Market trends
- HPI YoY
- ▼ -120.40%
- Current HPI
- 260.4262
- Rent YoY
- ▲ 4.01%
- Metro
- Pittsburgh, PA
- State GDP YoY
- ▲ 1.68%
- F500 in state
- 34
Industry mix (Fortune 500 HQ in PA)
| Industry | F500 HQs | Revenue |
|---|---|---|
| Healthcare | 2 | $309B |
|
||
| Insurance | 2 | $27B |
|
||
| Telecommunications / Media | 1 | $124B |
|
||
| Industrial Distribution | 1 | $22B |
|
||
| Financial Services | 1 | $20B |
|
||
| Chemicals / Materials | 1 | $18B |
|
||
Price history
+377.3% since first listed5 events — show timeline
- 2026-06-07 Listed $200,000 West Penn MLS
- 2025-08-30 Listed $210,000 West Penn MLS
- 2004-05-27 Sold (Public Records) $43,000 Public Records
- 2004-05-11 Sold (MLS) $43,000 West Penn MLS
- 2004-02-26 Listed $41,900 West Penn MLS
Property tax history
+1.9%/yrLatest (2026): $3,212 · +1.0% YoY. Source: county tax records.
Cash-flow waterfall
monthlySold comps — $/sqft
last 12 mo · ≤1 miLoading sold comps…