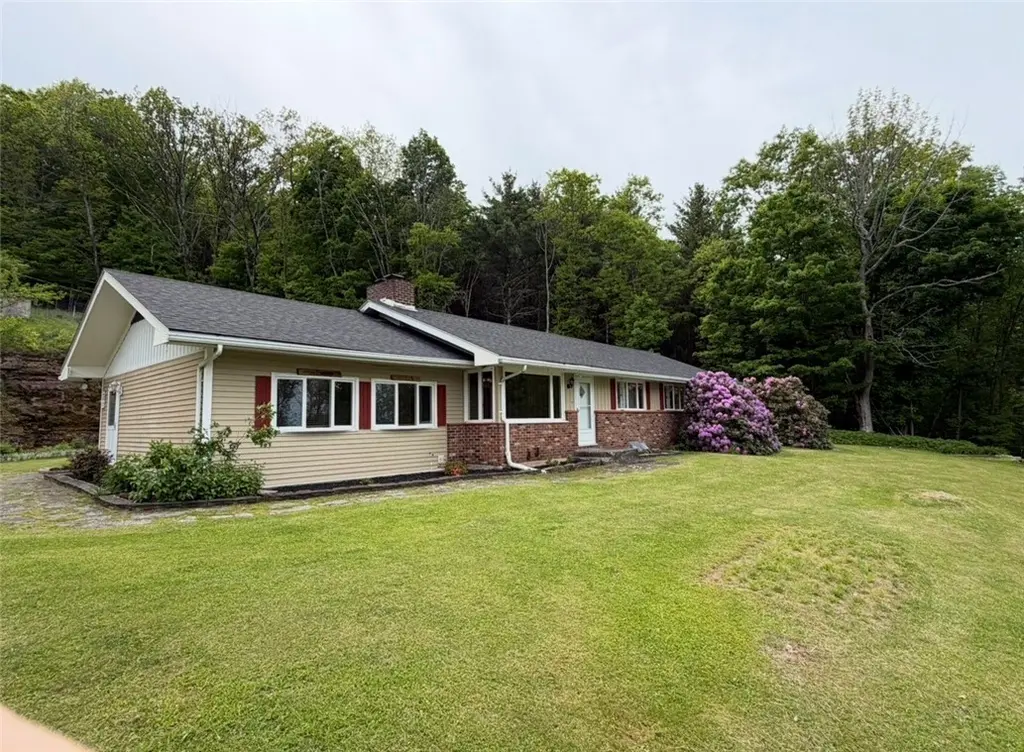
415 Cape Horn Rd · Stamford, NY
Flood risk 1/10 · Minimal
- FEMA flood zone
- X (unshaded)
- Chance of flooding over 30 yrs
- 0.0%
- Est. flood insurance / yr
- $473 – $860
Fire risk 3/10 · Minor
- Est. fire insurance / yr
- $691 – $1,283
Heat risk 1/10 · Minimal
- Hot days now (above 89°F)
- 7 days/yr
- Hot days in 30 yrs
- 15 days/yr
Wind risk 2/10 · Minimal
- Chance of severe wind over 30 yrs
- 2.0%
Air-quality risk 1/10 · Minimal
- Unhealthy air days now
- 0 days/yr
- Unhealthy air days in 30 yrs
- 0 days/yr
Risk factors via First Street. Map © Google.
Why this score? — see what drove the B grade
The composite is a weighted blend of 9 inputs, each scored 0–100. Each bar is that input's sub-score; the figure is the points it added to the 100-point composite (weight × sub-score).
- Cash flow +25.8/30.0
- ARV discount +14.3/15.0
- DSCR +8.6/10.0
- Appreciation +7.6/10.0
- 1% rule +6.1/10.0
- Schools +3.4/10.0
- Livability +3.4/5.0
- Rent growth +2.5/5.0
- Condition / age +2.5/5.0
$325,000
🖨 Deal sheet 📄 Offer letter ✓ Due diligence
Listing remarks
Welcome to your Catskills retreat! Nestled on a scenic 2.1-acre lot just outside the charming village of Stamford, this spacious 4-bedroom, 2-full-bath ranch offers the perfect blend of comfort and country living. The expansive, open-concept floor plan is anchored by beautiful wood floors and baseboard heating that keeps the home warm. In the heart of the winter, gather around the wood stove in the family room or the pellet stove in the living room for the ultimate cozy atmosphere. The kitchen flows seamlessly into the main living areas, making it ideal for entertaining. And the primary bedroom comes with a heated stone bed which stays cool in the summer and warm in the winter. A full basem
Key facts
- Wood stove
- Scenic 2.1 acre lot
- Full basement
Tags
Property features AI
Exterior
- Parking: No garage
- Utilities: Electricity connected with circuit breakers; Well water; Septic tank; High-speed internet available
- Home design: Single-story home; Frame construction; Existing (previously built)
- Construction: Poured foundation; Frame construction; Built previously (existing)
- Exterior features: Deck; Gravel driveway; Shed(s) and storage
Interior
- Kitchen: Electric oven and electric range; Dishwasher; Microwave; Freezer; Refrigerator
- Bedrooms: 4 main-level bedrooms
- Flooring: Hardwood; Laminate; Tile; Varies
- Bathrooms: 2 full bathrooms, both on the main level
- Heating & cooling: Oil heating; Baseboard heating; Hot water heating
- Interior features: Breakfast bar; Separate/formal living room; Kitchen/family room combo; Sliding glass doors; Bath in primary bedroom; Main-level primary
- Laundry & utility: Washer and dryer in basement; Electric water heater
Neighborhood map
What this means for you Summary
Snapshot
- This is a 4-bed/2.0-bath single-family listed at $325k.
Deal economics
- At list price, monthly cash flow is $788 ($9k/yr) — positive.
- The deal already cash-flows at list — no discount required.
- Meets the 1% rule at list price ($4k rent vs $325k).
- Cap rate 9.2% vs local median 5.3% in Stamford — top-decile yield for the area; either an underpriced asset or a hidden risk that comps aren't pricing in. Stress-test before assuming the spread holds.
Location & tenants
- Location reads 67/100 on livability (#574 in NY) — a middle-class / working-renter tenant base. Strengths: housing A+, cost of living A, crime A-; Watch: employment C-, schools D-, amenities F.
- Stamford Central School District (rural): math 40% / reading 35% proficiency, ranked #675 of 755 in NY (top 89%) — families likely to look elsewhere, expect single-tenant / working-renter base with shorter leases.
- Market conditions: 36 active listings in the ZIP; 35 units permitted in Schoharie County in 2024 (0 in 5+ unit buildings).
Forward outlook
- In year one you build about $19k of equity ($2k loan paydown + $17k appreciation (5.2% local appreciation)).
- Schoharie County population projected at -30% by 2050 — secular population decline; favor cash flow + early exit over multi-decade hold.
- At projected returns (5.2% appreciation + 3.0% rent growth), your $91k cash investment doubles in ~3 years — after that, you're playing with house money.
- By year 2, paydown + projected appreciation supports a ~$31k cash-out refi (75% LTV) — recoverable capital for the next deal without selling this one.
Negotiation context
- Only 13 days on market — expect competitive offers; lowballing is unlikely to land.
Questions for the listing agent
- Built in 1968 — when were the roof, HVAC, electrical panel, plumbing, and water heater last replaced?
- Is there a deadline driving the sale (1031 exchange, divorce, estate, relocation)? That informs how much negotiation room exists.
- Schools are D-rated, which usually means shorter tenancies and higher turnover. Who's the typical renter profile here, and what's been the actual vacancy rate?
- What's the average days-on-market for RENTAL listings here right now (not sales)? A rising rental-DOM trend means longer vacancies and softer asking-rent achievability than the comps imply.
- What's the recent tenant-quality profile in this submarket — average credit score on applications, eviction rate, late-payment / NSF rate, and stable-employment percentage? A property-management company in the area should have these aggregated.
- How much new for-sale + rental construction is in the pipeline within 1–3 miles? Heavy new supply typically softens prices + rents 12–24 months out; constrained supply supports both.
Investment metrics
- 1% rule
- 1.11% ✓
- Cap rate
- 9.20%
- Cash-on-cash
- 10.39%
- DSCR
- 1.46
- GRM
- 7.5
CMA / ARV
- ARV (on-the-fly)
- $382,713
- Comps found
- 1
Show comp detail 1 sale within ~0.75 mi
| Address | Dist | Beds/Ba | Sqft | Sold | Price | $/sf | Match |
|---|---|---|---|---|---|---|---|
| 398 Cape Horn Rd | 0.12mi | 3/2.0 (-1) | 1,600 (+4%) | 14mo | $399,000 | $249 | 71 |
Match score weights: distance 35% · size 25% · config 20% · recency 20%. Top-matched comps best support the ARV.
Projected returns pro-forma
5.21% appreciation · 3.0% rent growth · sell at horizon
- IRR
- 22.2%
- Equity multiple
- 2.42×
- Total profit
- $128,869
- Equity at exit
- $188,274
- IRR
- 21.6%
- Equity multiple
- 4.78×
- Total profit
- $344,407
- Equity at exit
- $328,378
Cash invested: $91,000 (down + closing). Projections, not guarantees.
Landlord ↔ Tenant lean methodology
- Overall (STATE)
- 15 Strongly Tenant-Friendly
- State New York
- 15 Strongly Tenant-Friendly · D+10
- County
- — inherits STATE
- City
- — inherits STATE
ZIP-level market 12167
- Home prices YoY
- 1.4%
- Active inventory
- 36
- Price-to-rent
- 7.5×
Monthly cashflow live
- Estimated rent
- $3,619 medium interval (Pro) →
- Mortgage (P&I)
- −$1,704
- Tax from tax record
- −$232 /mo · $2,779/yr
- Insurance
- −$135
- HOA
- −$0
- Vacancy / Maint / Mgmt
- −$760
- Net cashflow
- $788
Break-even live
UW: 25.0% down · 7.5% · 30yr · 1.5% tax · 5.0% vac · 8.0% maint · 8.0% mgmt
Financing live
Cash to close
- Down payment
- $81,250
- Closing costs
- $9,750
- Reserves months
- —
- Total cash needed
- —
Loan-product check · same deal, 3 products live
Conventional
25% down · 7.5% · 30yr
- Down + closing
- —
- Monthly P&I
- —
- Monthly cashflow
- —
- DSCR
- —
- Eligible?
- —
Personal DTI + credit; lowest rate.
DSCR
20% down · 8.5% · 30yr
- Down + closing
- —
- Monthly P&I
- —
- Monthly cashflow
- —
- DSCR
- —
- Eligible?
- —
No personal income docs; deal must DSCR.
Hard money
10% down · 12.0% · 12mo
- Down + closing
- —
- Monthly P&I
- —
- Monthly cashflow
- —
- DSCR
- —
- Eligible?
- —
Short-term bridge; refi at stabilization.
Listing history 11 events
-
2026-06-18days on market $325,000 Active 13 DOM
-
2026-06-17days on market $325,000 Active 12 DOM
-
2026-06-16days on market $325,000 Active 11 DOM
-
2026-06-15days on market $325,000 Active 10 DOM
-
2026-06-13days on market $325,000 Active 8 DOM
-
2026-06-12days on market $325,000 Active 7 DOM
-
2026-06-09days on market $325,000 Active 4 DOM
-
2026-06-08days on market $325,000 Active 3 DOM
-
2026-06-07days on market $325,000 Active 2 DOM
-
2026-06-07remarks 699-char remark
-
2026-06-07$325,000 Active 1 DOM
ⓘ Source: listings_history table (triggers on properties + properties_extension) + one-shot
backfill from property_details.listing_events for pre-trigger history.
Tax reassessment forecast NY · Partial reset (capped growth)
- Current annual tax
- $2,779 · $232/mo
- Projected year-2 tax
- $4,136 · $345/mo
- Expected delta
- +$1,357/yr (+$113/mo · 48.8%)
ⓘ Screening estimate from a state-policy table — verify with the county assessor before closing.
Climate risk First Street
- Flood 1/10 Low FEMA zone X (unshaded) · 0% chance over 30 yrs
- Wildfire 3/10 Moderate
- Heat 1/10 Low 7 d/yr ≥89°F today · 15 d/yr by 30 yrs out
- Wind 2/10 Low 2% chance of damaging wind over 30 yrs
- Air quality 1/10 Low 0 unhealthy d/yr today · 0 by 30 yrs out
Nearby sold comps map
Loading sold comps map…
Walkable amenities ~0.75 mi
Loading nearby amenities…
Taxation est. · year 1
- Rental income
- $43,426
- − Mortgage interest
- −$18,205
- − Property taxes
- −$2,779
- − Insurance
- −$1,625
- − Repairs & maintenance
- −$3,474
- − Management
- −$3,474
- − Depreciation
- −$9,455
- Taxable income
- $4,414
- Est. tax owed @ 24.0%
- −$1,059
- After-tax cash flow
- $8,391/yr
For passive investors: Depreciation is non-cash, so a rental often shows a tax loss while cash-flowing — sheltering income. Rental losses are passive: they offset passive income freely, and up to $25,000/yr can offset ordinary (W-2) income if you actively participate and your MAGI is under $100k (phasing out to $0 by $150k); unused losses carry forward. On sale, claimed depreciation is recaptured at up to 25%, and gains may owe capital-gains tax (a 1031 exchange can defer both). Figures are a year-1 estimate at your 24.0% rate — not tax advice; consult a CPA.
Schools (NCES district)
- District
- Stamford Central School District
- NCES district ID
- 3628020
- Math proficiency
- 40% ▼ -10.00%
- Reading proficiency
- 35% ▼ -10.00%
- Median HH income
- $42,968
- Composite
- 34.29/100
- National rank
- #10231
- State rank
- #675 of 755 in NY
Livability — Stamford
- Score
- 67/100
- State rank
- #574
- US rank
- #10332
Category grades
Schools grade is shown separately in the Schools card above.
Census & demographics
- Population (ZIP)
- 2,257
Population outlook (Schoharie County) Hauer SSP2
- Today (2025)
- 29,080 people
- By 2030
- 27,417 · -5.7%
- By 2040
- 23,835 · -18.0%
- By 2050
- 20,482 · -29.6%
- By 2075
- 14,323 · -50.7%
- By 2100
- 9,636 · -66.9%
Race, ethnicity, and origin ACS 2023
- Neighborhood character
- Predominantly White (94%)
- Race & ethnicity
- White 94% Two or more races 4% Hispanic / Latino 2%
- Common ancestry
- Romanian 8% Iranian 3% Lithuanian 2%
- Foreign-born
- 3% · Canada, China
- Languages at home
- 94% English-only · Other Indo-European 3% Spanish 1% Russian/Polish/Slavic 1%
Political lean MEDSL · Schoharie
- 2024 margin
- Solid R (+30.5) · D 34.7% · R 65.3%
- 2008→2024 swing
- -16.2pp toward R · 2008: -14.3pp · 2024: -30.5pp
- All cycles
- 2024: R+30.5 2020: R+29.0 2016: R+34.7 2012: R+16.6 2008: R+14.3
Not yet ingested
- Civics
- —
Market trends
- HPI YoY
- ▲ 5.21%
- Current HPI
- 368.4492
- Rent YoY
- —
- Metro
- —
- State GDP YoY
- ▲ 2.60%
- F500 in state
- 92
Industry mix (Fortune 500 HQ in NY)
| Industry | F500 HQs | Revenue |
|---|---|---|
| Financial Services | 10 | $950B |
|
||
| Consumer Goods | 9 | $162B |
|
||
| Insurance | 4 | $225B |
|
||
| Telecommunications | 2 | $144B |
|
||
| Pharmaceuticals | 2 | $112B |
|
||
| Media / Entertainment | 2 | $69B |
|
||
Price history
1 event — show timeline
- 2026-06-05 Listed $325,000 UNYREIS
Property tax history
+0.2%/yrLatest (2025): $2,779 · -2.9% YoY. Source: county tax records.
Cash-flow waterfall
monthlySold comps — $/sqft
last 12 mo · ≤1 miLoading sold comps…