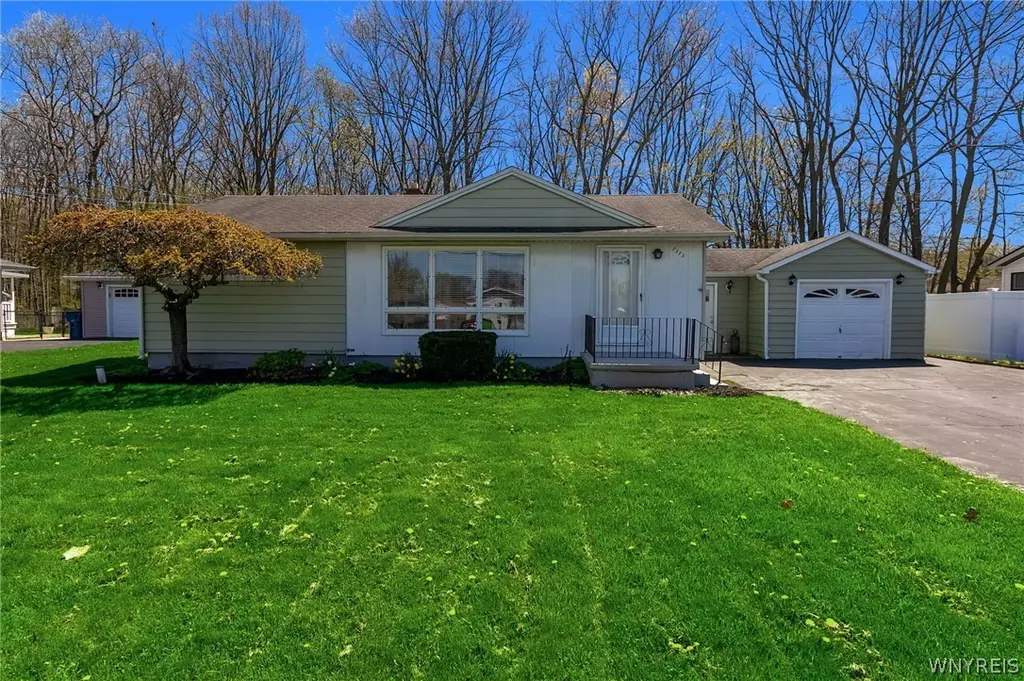
7375 Saint Joseph Rd · Niagara Falls, NY
Flood risk 1/10 · Minimal
- FEMA flood zone
- X (unshaded)
- Chance of flooding over 30 yrs
- 0.0%
- Est. flood insurance / yr
- $473 – $860
Fire risk 2/10 · Minimal
- Est. fire insurance / yr
- $691 – $1,283
Heat risk 2/10 · Minimal
- Hot days now (above 94°F)
- 7 days/yr
- Hot days in 30 yrs
- 13 days/yr
Wind risk 1/10 · Minimal
- Chance of severe wind over 30 yrs
- —
Air-quality risk 3/10 · Minor
- Unhealthy air days now
- 2 days/yr
- Unhealthy air days in 30 yrs
- 3 days/yr
Risk factors via First Street. Map © Google.
Why this score? — see what drove the D grade
The composite is a weighted blend of 9 inputs, each scored 0–100. Each bar is that input's sub-score; the figure is the points it added to the 100-point composite (weight × sub-score).
- ARV discount +15.0/15.0
- Cash flow +9.7/30.0
- Schools +5.8/10.0
- Livability +3.0/5.0
- DSCR +2.7/10.0
- Rent growth +2.5/5.0
- Condition / age +2.5/5.0
- 1% rule +1.6/10.0
- Appreciation +0.0/10.0
$239,900
🖨 Deal sheet (PDF) 📄 Offer letter ✓ Due diligence
Listing remarks
Welcome to 7375 St. Joseph’s Rd in the Town of Niagara, a well-maintained and spacious Ranch home offering comfort, flexibility, and a great setting on a quiet neighborhood street. This 3-bedroom, 2 full bath home features a functional layout with both a bright living room and a cozy family room, providing plenty of space to relax or entertain, a formal dining area is perfect for gatherings, while the primary bedroom includes its own en suite bath for added convenience. Looking for extra space? There’s excellent potential for a 4th bedroom, plus a partially finished basement ready for a rec room, home gym, hobbies, or additional living space. Step outside to a fully vinyl-fenced
Key facts
- Bright living room
- Cozy family room
- Formal dining area
Tags
Property features AI
Exterior
- Parking: Attached garage; Driveway; 1 garage space
- Utilities: Public water connected; Sewer connected; Electric service with circuit breakers
- Home design: Single-story home; Existing construction; Main-level entry
- Construction: Aluminum siding; Copper plumbing; Asphalt shingle roof; Poured foundation; Resale property
- Exterior features: Blacktop driveway; Shed(s) / exterior storage; Rectangular residential lot with 80 x 160 dimensions; City street frontage
Interior
- Kitchen: Gas oven; Gas range; Range hood; Dishwasher; Refrigerator; Exhaust fan; Appliances negotiable
- Bedrooms: Three main-level bedrooms
- Flooring: Hardwood; Carpet; Ceramic tile; Laminate; Luxury vinyl; Tile; Varied flooring types
- Bathrooms: Two full bathrooms (both on main level)
- Heating & cooling: Gas heating; Forced air; Baseboard heating; Central air conditioning; Circuit breaker electrical
- Interior features: Ceiling fans; Separate/formal dining room; Entrance foyer; Eat-in kitchen; Separate/formal living room; Sliding glass doors; Solid surface counters; Natural woodwork; Bedroom on main level; Convertible bedroom; Bath in primary bedroom; Main level primary suite
- Laundry & utility: Washer; Dryer; Laundry located in basement; Gas water heater
Neighborhood map
What this means for you Summary
Snapshot
- This is a 3-bed/2.0-bath single-family listed at $240k.
Deal economics
- At list price, monthly cash flow is $-158 ($-2k/yr) — negative.
- To cash-flow at today's rent, offer at most $212k (11.6% below list).
- To meet the 1% rule (rent ≥ 1% of price), the offer needs to be $158k (34.3% below list).
- Recommended offer: $158k (34.3% below list) — sets the bar for 1% rule.
- Cap rate 5.5% vs local median 7.5% in Niagara Falls — below-typical yield; the buyer is paying a premium for something (appreciation thesis, condition, location) that the cap rate doesn't capture.
Location & tenants
- Location reads 60/100 on livability (#956 in NY) — a middle-class / working-renter tenant base. Strengths: cost of living A+, housing A+; Watch: crime F, amenities F, commute F.
- Niagara-Wheatfield Central School District (rural): math 64% / reading 70% proficiency, ranked #163 of 590 in NY (top 28%) — acceptable for families but not a draw, mixed tenant base, ~2y average lease.
- Zoned schools: Edward Town Middle School (math 37% / reading 60%, grade C-, #300 of 729 statewide, top 41%, 736 students, 47% FRL); Niagara-Wheatfield Senior High School (math 95% / reading 97%, grade A+, #68 of 1,100 statewide, top 6%, 1,092 students, 36% FRL) — zoned schools average 42% FRL vs 25% district-wide (17 pts higher); higher-poverty schools than district average — tighter screening recommended.
- Market conditions: 144 active listings in the ZIP; 167 units permitted in Niagara County in 2024 (0 in 5+ unit buildings).
Forward outlook
- Local home prices are declining (-3.0%/yr); year-one equity from $2k of loan paydown is wiped out by about $7k of value loss. Plan a longer hold.
- Niagara County population projected at -19% by 2050 — secular population decline; favor cash flow + early exit over multi-decade hold.
Negotiation context
- It's been on market 27 days — a 2% lower offer ($236k) is reasonable based on typical stale-listing flexibility.
- Current owner paid $86k; list at $240k implies a 179% gain — meaningful room to come down on a strong offer.
Risks & watch-outs
- Watch-outs: built in 1959 — expect roof / HVAC / electrical / plumbing capex.
Questions for the listing agent
- What do current leases actually rent for vs. the listed asking? Can we see a recent rent roll and the last 12 months of T-12 income?
- Built in 1959 — when were the roof, HVAC, electrical panel, plumbing, and water heater last replaced?
- Is there a deadline driving the sale (1031 exchange, divorce, estate, relocation)? That informs how much negotiation room exists.
- Schools are F-rated, which usually means shorter tenancies and higher turnover. Who's the typical renter profile here, and what's been the actual vacancy rate?
- Crime grade is F in this area — have there been break-ins, vandalism, or insurance claims at this property in the last 3 years? What carrier currently insures it and at what premium?
- The area grade is low — what's the realistic commute time and amenity access for the typical tenant pool here? Any planned neighborhood developments (good or bad) we should know about?
- What's the average days-on-market for RENTAL listings here right now (not sales)? A rising rental-DOM trend means longer vacancies and softer asking-rent achievability than the comps imply.
- What's the recent tenant-quality profile in this submarket — average credit score on applications, eviction rate, late-payment / NSF rate, and stable-employment percentage? A property-management company in the area should have these aggregated.
- How much new for-sale + rental construction is in the pipeline within 1–3 miles? Heavy new supply typically softens prices + rents 12–24 months out; constrained supply supports both.
Investment metrics
- 1% rule
- 0.66% ✗
- Cap rate
- 5.50%
- Cash-on-cash
- -2.83%
- DSCR
- 0.87
- GRM
- 12.7
CMA / ARV
- ARV (median comp)
- $300,097
- List price
- $239,900
- Delta
- -20.06%
- Verdict
- UNDERPRICED
- Comps
- 20 within 1.0 mi
Show comp detail 9 sales within ~0.75 mi
| Address | Dist | Beds/Ba | Sqft | Sold | Price | $/sf | Match |
|---|---|---|---|---|---|---|---|
| 7399 Sunnydale Dr | 0.08mi | 3/2.0 | 1,340 (-4%) | 11mo | $352,000 | $263 | 81 |
| 3210 Woodland Ave | 0.14mi | 3/2.5 | 1,248 (-10%) | 4mo | $170,000 | $136 | 71 |
| 3165 Jordan Dr | 0.39mi | 3/1.0 | 1,216 (-13%) | 2mo | $148,000 | $122 | 54 |
| 4450 Miller Rd | 0.66mi | 3/1.5 | 1,536 (+10%) | 2mo | $267,000 | $174 | 48 |
| 7721 E Britton Dr | 0.33mi | 3/1.0 | 1,230 (-12%) | 23mo | $190,000 | $154 | 42 |
| 7630 Dean Brown Dr | 0.35mi | 3/1.5 | 1,200 (-14%) | 20mo | $250,000 | $208 | 42 |
| 6110 Edgewood Dr | 0.71mi | 2/1.5 (-1) | 1,528 (+10%) | 15mo | $325,000 | $213 | 31 |
| 6300 Edgewood Dr | 0.64mi | 2/1.0 (-1) | 1,536 (+10%) | 23mo | $222,000 | $145 | 25 |
| 6210 Edgewood Dr | 0.66mi | 2/2.0 (-1) | 1,215 (-13%) | 24mo | $138,000 | $114 | 23 |
Match score weights: distance 35% · size 25% · config 20% · recency 20%. Top-matched comps best support the ARV.
Projected returns pro-forma
-3.0% appreciation · 3.0% rent growth · sell at horizon
- IRR
- -21.1%
- Equity multiple
- 0.27×
- Total profit
- $-49,082
- Equity at exit
- $35,770
- IRR
- -14.7%
- Equity multiple
- 0.16×
- Total profit
- $-56,252
- Equity at exit
- $20,742
Cash invested: $67,172 (down + closing). Projections, not guarantees.
Landlord ↔ Tenant lean methodology
- Overall (STATE)
- 15 Strongly Tenant-Friendly
- State New York
- 15 Strongly Tenant-Friendly · D+10
- County
- — inherits STATE
- City
- — inherits STATE
ZIP-level market 14304
- Active inventory
- 144
- Price-to-rent
- 12.7×
Monthly cashflow live
- Estimated rent
- $1,577 medium interval (Pro) →
- Mortgage (P&I)
- −$1,258
- Tax from tax record
- −$46 /mo · $554/yr
- Insurance
- −$100
- HOA
- −$0
- Vacancy / Maint / Mgmt
- −$331
- Net cashflow
- $-158
Break-even live
Sensitivity live
| Price | -10% $-22 | -5% $-90 | +0% $-158 | +5% $-226 | +10% $-294 |
|---|---|---|---|---|---|
| Rent | -10% $-283 | -5% $-221 | +0% $-158 | +5% $-96 | +10% $-34 |
| Rate | -1.0pp $-37 | -0.5pp $-97 | base $-158 | +0.5pp $-220 | +1.0pp $-284 |
UW: 25.0% down · 7.5% · 30yr · 1.5% tax · 5.0% vac · 8.0% maint · 8.0% mgmt
Financing live
Cash to close
- Down payment
- $59,975
- Closing costs
- $7,197
- Reserves months
- —
- Total cash needed
- —
Loan-product check · same deal, 3 products live
Conventional
25% down · 7.5% · 30yr
- Down + closing
- —
- Monthly P&I
- —
- Monthly cashflow
- —
- DSCR
- —
- Eligible?
- —
Personal DTI + credit; lowest rate.
DSCR
20% down · 8.5% · 30yr
- Down + closing
- —
- Monthly P&I
- —
- Monthly cashflow
- —
- DSCR
- —
- Eligible?
- —
No personal income docs; deal must DSCR.
Hard money
10% down · 12.0% · 12mo
- Down + closing
- —
- Monthly P&I
- —
- Monthly cashflow
- —
- DSCR
- —
- Eligible?
- —
Short-term bridge; refi at stabilization.
Listing history 3 events
-
2026-05-13price $239,900 1126-char remark
-
2026-04-29$255,900 Active 1126-char remark
-
1999-07-07soldstatus $86,000
ⓘ Source: listings_history table (triggers on properties + properties_extension) + one-shot
backfill from property_details.listing_events for pre-trigger history.
Tax reassessment forecast NY · Partial reset (capped growth)
- Current annual tax
- $554 · $46/mo
- Projected year-2 tax
- $2,304 · $192/mo
- Expected delta
- +$1,750/yr (+$146/mo · 315.8%)
ⓘ Screening estimate from a state-policy table — verify with the county assessor before closing.
Climate risk First Street
- Flood 1/10 Low FEMA zone X (unshaded) · 0% chance over 30 yrs
- Wildfire 2/10 Low
- Heat 2/10 Low 7 d/yr ≥94°F today · 13 d/yr by 30 yrs out
- Wind 1/10 Low
- Air quality 3/10 Moderate 2 unhealthy d/yr today · 3 by 30 yrs out
Nearby sold comps map
Loading sold comps map…
Walkable amenities ~0.75 mi
Loading nearby amenities…
Taxation est. · year 1
- Rental income
- $18,927
- − Mortgage interest
- −$13,438
- − Property taxes
- −$554
- − Insurance
- −$1,200
- − Repairs & maintenance
- −$1,514
- − Management
- −$1,514
- − Depreciation
- −$6,979
- Taxable loss
- −$6,272
- Est. tax savings @ 24.0%
- +$1,505
- After-tax cash flow
- $-393/yr
For passive investors: Depreciation is non-cash, so a rental often shows a tax loss while cash-flowing — sheltering income. Rental losses are passive: they offset passive income freely, and up to $25,000/yr can offset ordinary (W-2) income if you actively participate and your MAGI is under $100k (phasing out to $0 by $150k); unused losses carry forward. On sale, claimed depreciation is recaptured at up to 25%, and gains may owe capital-gains tax (a 1031 exchange can defer both). Figures are a year-1 estimate at your 24.0% rate — not tax advice; consult a CPA.
Schools (NCES district)
- District
- Niagara-Wheatfield Central School District
- NCES district ID
- 3620850
- Math proficiency
- 64% ▼ -1.00%
- Reading proficiency
- 70% ▲ 10.00%
- Median HH income
- $57,051
- Composite
- 57.53/100
- National rank
- #1067
- State rank
- #163 of 590 in NY
Livability — Niagara Falls
- Score
- 60/100
- State rank
- #956
- US rank
- #18749
Category grades
Schools grade is shown separately in the Schools card above.
Census & demographics
- County
- Niagara County · 157,377 people
- City population
- 62,983
- Metro
- Buffalo-Cheektowaga, NY
- Population (ZIP)
- 29,208
- Household income
- $66,660
- Rent vs Own
- Severe rent burden
- 698.0
Population outlook (Niagara County) Hauer SSP2
- Today (2025)
- 204,149 people
- By 2030
- 197,900 · -3.1%
- By 2040
- 182,239 · -10.7%
- By 2050
- 165,198 · -19.1%
- By 2075
- 129,416 · -36.6%
- By 2100
- 96,222 · -52.9%
Race, ethnicity, and origin ACS 2023
- Neighborhood character
- Predominantly White (85%)
- Race & ethnicity
- White 85% Two or more races 6% Hispanic / Latino 4% Black 3% Asian 2%
- Common ancestry
- Romanian 10% Lithuanian 3% Slovak 2%
- Foreign-born
- 3% · Canada, China, Vietnam
- Languages at home
- 93% English-only · Spanish 3% Other Indo-European 1% Russian/Polish/Slavic 1%
Political lean MEDSL · Niagara
- 2024 margin
- R (+14.9) · D 42.5% · R 57.5%
- 2008→2024 swing
- -15.9pp toward R · 2008: 1.0pp · 2024: -14.9pp
- All cycles
- 2024: R+14.9 2020: R+9.7 2016: R+19.0 2012: D+0.6 2008: D+1.0
Not yet ingested
- Civics
- —
Market trends
- HPI YoY
- ▼ -231.77%
- Current HPI
- 280.3295
- Rent YoY
- —
- Metro
- Buffalo-Cheektowaga, NY
- State GDP YoY
- ▲ 2.60%
- F500 in state
- 92
Industry mix (Fortune 500 HQ in NY)
| Industry | F500 HQs | Revenue |
|---|---|---|
| Financial Services | 10 | $950B |
|
||
| Consumer Goods | 9 | $162B |
|
||
| Insurance | 4 | $225B |
|
||
| Telecommunications | 2 | $144B |
|
||
| Pharmaceuticals | 2 | $112B |
|
||
| Media / Entertainment | 2 | $69B |
|
||
Price history
+179.0% since first listed4 events — show timeline
- 2026-05-26 Pending — WNYREIS
- 2026-05-13 Price Changed $239,900 WNYREIS
- 2026-04-29 Listed $255,900 WNYREIS
- 1999-07-07 Sold (Public Records) $86,000 Public Records
Property tax history
+5.2%/yrLatest (2025): $554 · +5.3% YoY. Source: county tax records.
Cash-flow waterfall
monthlySold comps — $/sqft
last 12 mo · ≤1 miLoading sold comps…