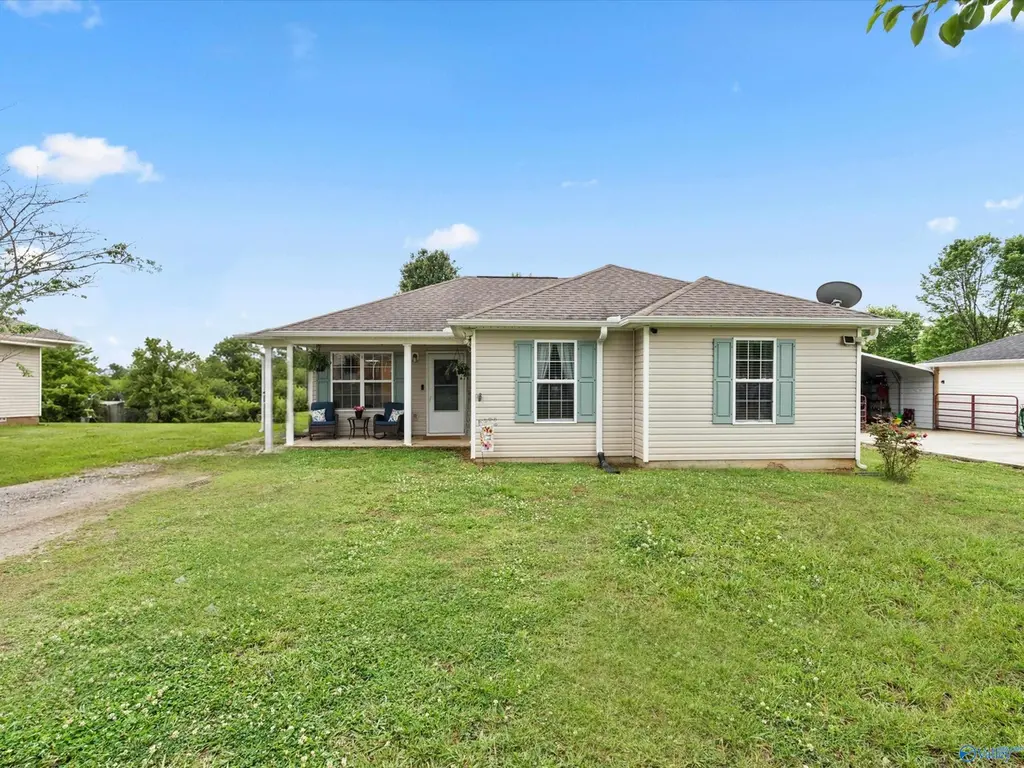
160 Sophia Dr · Harvest, AL
Flood risk 1/10 · Minimal
- FEMA flood zone
- X (unshaded)
- Chance of flooding over 30 yrs
- 0.0%
- Est. flood insurance / yr
- $507 – $1,088
Fire risk 4/10 · Minor
- Est. fire insurance / yr
- $916 – $1,700
Heat risk 5/10 · Moderate
- Hot days now (above 104°F)
- 7 days/yr
- Hot days in 30 yrs
- 20 days/yr
Wind risk 4/10 · Minor
- Chance of severe wind over 30 yrs
- 17.0%
Air-quality risk 1/10 · Minimal
- Unhealthy air days now
- 0 days/yr
- Unhealthy air days in 30 yrs
- 0 days/yr
Risk factors via First Street. Map © Google.
Why this score? — see what drove the D- grade
The composite is a weighted blend of 9 inputs, each scored 0–100. Each bar is that input's sub-score; the figure is the points it added to the 100-point composite (weight × sub-score).
- Appreciation +10.0/10.0
- ARV discount +8.0/15.0
- Cash flow +6.7/30.0
- Schools +3.7/10.0
- Livability +3.6/5.0
- Rent growth +2.5/5.0
- Condition / age +2.5/5.0
- 1% rule +1.7/10.0
- DSCR +1.0/10.0
$215,000
🖨 Deal sheet (PDF) 📄 Offer letter ✓ Due diligence
Listing remarks MLS
Great starter home! Low maintenance vinyl exterior with fresh paint, new carpet and tile in wet areas inside. Good location across from Madison Cross Roads school. 100% financing possible - call for details. Sq. ft. from builder records, buyer to verify all information.
Key facts
- Spacious backyard
- No hoa
- Hardwood floors
Tags
Property features AI
Finance
- Other: Property listed as Residential — Single Family Residence; Living area approximately 1,038 square feet
- Financial info: Financial details not specified
- HOA & community: No homeowners association; Subdivision: Metes And Bounds
Exterior
- Parking: No designated parking
- Security: Security details not specified
- Utilities: Septic tank
- Home design: Single-family residence; Built in 2004; Vinyl siding
- Construction: Slab foundation; One story
- Exterior features: Lot of 0.34 acres
Interior
- Kitchen: Kitchen details not specified
- Bedrooms: Bedrooms not specified
- Flooring: Flooring details not specified
- Bathrooms: 2 full bathrooms
- Heating & cooling: Central heating; Central cooling
- Interior features: One-level living; No fireplaces
- Laundry & utility: Laundry details not specified
Neighborhood map
What this means for you Summary
Snapshot
- This is a 3-bed/1.0-bath single-family listed at $215k.
Deal economics
- At list price, monthly cash flow is $-340 ($-4k/yr) — negative.
- To cash-flow at today's rent, offer at most $166k (22.9% below list).
- To meet the 1% rule (rent ≥ 1% of price), the offer needs to be $145k (32.6% below list).
- Recommended offer: $145k (32.6% below list) — sets the bar for 1% rule.
- Cap rate 4.4% vs local median 3.5% in Harvest — meaningfully above typical; check what's discounted (condition, days-on-market, listing class) to confirm the premium yield is real.
Location & tenants
- Location reads 72/100 on livability (#27 in AL) — a middle-class / working-renter tenant base. Strengths: crime A+, employment A+, cost of living A+; Watch: amenities F, commute F, health & safety F.
- Madison County (rural): math 27% / reading 56% proficiency, ranked #19 of 129 in AL (top 15%) — families likely to look elsewhere, expect single-tenant / working-renter base with shorter leases.
- Zoned schools: Madison Cross Roads Elementary School (math 14% / reading 48%, grade F, #360 of 627 statewide, top 58%, 1,035 students, 59% FRL); Sparkman Middle School (math 18% / reading 53%, grade F, #81 of 257 statewide, top 33%, 859 students, 60% FRL); Sparkman High School (math 28% / reading 37%, grade F, #58 of 305 statewide, top 19%, 1,738 students, 37% FRL) — zoned schools average 52% FRL vs 29% district-wide (23 pts higher); higher-poverty schools than district average — tighter screening recommended.
- Market conditions: 319 active listings in the ZIP; 1 comparable units currently listed for rent nearby; 4,709 units permitted in Madison County in 2024 (1,186 in 5+ unit buildings).
Forward outlook
- In year one you build about $23k of equity ($1k loan paydown + $22k appreciation (10.0% local appreciation)).
- Madison County population projected at +18% by 2050 — long-run rental-demand tailwind backs the buy-and-hold thesis.
- By year 2, paydown + projected appreciation supports a ~$37k cash-out refi (75% LTV) — recoverable capital for the next deal without selling this one.
Negotiation context
- It's been on market 48 days — a 3% lower offer ($209k) is reasonable based on typical stale-listing flexibility.
- 3 sale attempts since 14y ago with the ask held roughly flat each time — persistent listings suggest the price (not the market) is what's stuck; bring a comps-based counter.
- Current owner paid $72k; list at $215k implies a 199% gain — meaningful room to come down on a strong offer.
Risks & watch-outs
- Climate carrying-cost: extreme-heat days projected 7→20/yr by 2055 (HVAC capex compounding) — expect insurance premiums to compound above CPI over the hold.
Questions for the listing agent
- What do current leases actually rent for vs. the listed asking? Can we see a recent rent roll and the last 12 months of T-12 income?
- It's been on market 48 days. Have you received any prior offers? Is the seller open to a 33% concession, seller financing, or rate buy-down credit?
- Is there a deadline driving the sale (1031 exchange, divorce, estate, relocation)? That informs how much negotiation room exists.
- The area grade is low — what's the realistic commute time and amenity access for the typical tenant pool here? Any planned neighborhood developments (good or bad) we should know about?
- What's the average days-on-market for RENTAL listings here right now (not sales)? A rising rental-DOM trend means longer vacancies and softer asking-rent achievability than the comps imply.
- What's the recent tenant-quality profile in this submarket — average credit score on applications, eviction rate, late-payment / NSF rate, and stable-employment percentage? A property-management company in the area should have these aggregated.
- How much new for-sale + rental construction is in the pipeline within 1–3 miles? Heavy new supply typically softens prices + rents 12–24 months out; constrained supply supports both.
Investment metrics
- 1% rule
- 0.67% ✗
- Cap rate
- 4.39%
- Cash-on-cash
- -6.78%
- DSCR
- 0.70
- GRM
- 12.4
CMA / ARV
- ARV (median comp)
- $217,343
- List price
- $215,000
- Delta
- -1.08%
- Verdict
- FAIR
- Comps
- 20 within 1.0 mi
Show comp detail 2 sales within ~0.75 mi
| Address | Dist | Beds/Ba | Sqft | Sold | Price | $/sf | Match |
|---|---|---|---|---|---|---|---|
| 118 Sophia Dr | 0.10mi | 3/2.0 | 1,038 (-2%) | 12mo | $205,000 | $197 | 78 |
| 162 Jamie Ln | 0.36mi | 3/2.0 | 1,131 (+6%) | 22mo | $188,000 | $166 | 51 |
Match score weights: distance 35% · size 25% · config 20% · recency 20%. Top-matched comps best support the ARV.
Projected returns pro-forma
10.0% appreciation · 3.0% rent growth · sell at horizon
- IRR
- 19.5%
- Equity multiple
- 2.59×
- Total profit
- $95,442
- Equity at exit
- $193,689
- IRR
- 17.9%
- Equity multiple
- 5.95×
- Total profit
- $298,148
- Equity at exit
- $417,698
Cash invested: $60,200 (down + closing). Projections, not guarantees.
Landlord ↔ Tenant lean methodology
- Overall (STATE)
- 90 Strongly Landlord-Friendly
- State Alabama
- 90 Strongly Landlord-Friendly · R+15
- County
- — inherits STATE
- City
- — inherits STATE
ZIP-level market 35773
- Home prices YoY
- 28.8%
- Active inventory
- 319
- Price-to-rent
- 12.4×
Monthly cashflow live
- Estimated rent
- $1,450 medium interval (Pro) →
- Mortgage (P&I)
- −$1,127
- Tax est. 1.5%
- −$269 /mo · $3,225/yr
- Insurance
- −$90
- HOA
- −$0
- Vacancy / Maint / Mgmt
- −$304
- Net cashflow
- $-340
Break-even live
Sensitivity live
| Price | -10% $-192 | -5% $-266 | +0% $-340 | +5% $-415 | +10% $-489 |
|---|---|---|---|---|---|
| Rent | -10% $-455 | -5% $-398 | +0% $-340 | +5% $-283 | +10% $-226 |
| Rate | -1.0pp $-232 | -0.5pp $-286 | base $-340 | +0.5pp $-396 | +1.0pp $-453 |
UW: 25.0% down · 7.5% · 30yr · 1.5% tax · 5.0% vac · 8.0% maint · 8.0% mgmt
Financing live
Cash to close
- Down payment
- $53,750
- Closing costs
- $6,450
- Reserves months
- —
- Total cash needed
- —
Loan-product check · same deal, 3 products live
Conventional
25% down · 7.5% · 30yr
- Down + closing
- —
- Monthly P&I
- —
- Monthly cashflow
- —
- DSCR
- —
- Eligible?
- —
Personal DTI + credit; lowest rate.
DSCR
20% down · 8.5% · 30yr
- Down + closing
- —
- Monthly P&I
- —
- Monthly cashflow
- —
- DSCR
- —
- Eligible?
- —
No personal income docs; deal must DSCR.
Hard money
10% down · 12.0% · 12mo
- Down + closing
- —
- Monthly P&I
- —
- Monthly cashflow
- —
- DSCR
- —
- Eligible?
- —
Short-term bridge; refi at stabilization.
Rent comps 1 comps
| Address | Beds | Baths | Sqft | Rent | $/sqft | DOM | Units | Dist |
|---|---|---|---|---|---|---|---|---|
| 110 Fox Haven Ln Toney, AL | 3.0 | 2.0 | 1392 | $1,450 | $1.04 | 45d | 1 | 1.11mi |
Listing history 19 events
-
2026-06-18days on market $215,000 Active 48 DOM
-
2026-06-17days on market $215,000 Active 47 DOM
-
2026-06-16days on market $215,000 Active 46 DOM
-
2026-06-15days on market $215,000 Active 45 DOM
-
2026-06-14pricedays on market $215,000 Active 43 DOM
-
2026-06-10days on market $225,000 Active 40 DOM
-
2026-06-09days on market $225,000 Active 39 DOM
-
2026-06-08days on market $225,000 Active 38 DOM
-
2026-06-07days on market $225,000 Active 37 DOM
-
2026-06-02days on market $225,000 Active 32 DOM
-
2026-06-01days on market $225,000 Active 31 DOM
-
2026-05-31days on market $225,000 Active 30 DOM
-
2026-05-30days on market $225,000 Active 29 DOM
-
2026-05-01$225,000 Active 226-char remark
-
2013-07-15soldstatus $72,000
-
2013-07-12soldstatus $72,000 270-char remark
Show marketing remark (270 chars)
Great starter home! Low maintenance vinyl exterior with fresh paint, new carpet and tile in wet areas inside. Good location across from Madison Cross Roads school. 100% financing possible - call for details. Sq. ft. from builder records, buyer to verify all information.
-
2013-05-06$72,900 270-char remark
Show marketing remark (270 chars)
Great starter home! Low maintenance vinyl exterior with fresh paint, new carpet and tile in wet areas inside. Good location across from Madison Cross Roads school. 100% financing possible - call for details. Sq. ft. from builder records, buyer to verify all information.
-
2013-03-08soldstatus $40,000
Show marketing remark (169 chars)
With a little TLC would make a great home. Ideal for starter home or investment. All information to be verified by purchaser or their agent. Right of redemption applies.
-
2012-11-19$44,900
Show marketing remark (169 chars)
With a little TLC would make a great home. Ideal for starter home or investment. All information to be verified by purchaser or their agent. Right of redemption applies.
ⓘ Source: listings_history table (triggers on properties + properties_extension) + one-shot
backfill from property_details.listing_events for pre-trigger history.
Climate risk First Street
- Flood 1/10 Low FEMA zone X (unshaded) · 0% chance over 30 yrs
- Wildfire 4/10 Moderate
- Heat 5/10 Major 7 d/yr ≥104°F today · 20 d/yr by 30 yrs out
- Wind 4/10 Moderate 17% chance of damaging wind over 30 yrs
- Air quality 1/10 Low 0 unhealthy d/yr today · 0 by 30 yrs out
Nearby sold comps map
Loading sold comps map…
Walkable amenities ~0.75 mi
Loading nearby amenities…
Taxation est. · year 1
- Rental income
- $17,400
- − Mortgage interest
- −$12,043
- − Property taxes
- −$3,225
- − Insurance
- −$1,075
- − Repairs & maintenance
- −$1,392
- − Management
- −$1,392
- − Depreciation
- −$6,255
- Taxable loss
- −$7,982
- Est. tax savings @ 24.0%
- +$1,916
- After-tax cash flow
- $-2,168/yr
For passive investors: Depreciation is non-cash, so a rental often shows a tax loss while cash-flowing — sheltering income. Rental losses are passive: they offset passive income freely, and up to $25,000/yr can offset ordinary (W-2) income if you actively participate and your MAGI is under $100k (phasing out to $0 by $150k); unused losses carry forward. On sale, claimed depreciation is recaptured at up to 25%, and gains may owe capital-gains tax (a 1031 exchange can defer both). Figures are a year-1 estimate at your 24.0% rate — not tax advice; consult a CPA.
Schools (NCES district)
- District
- Madison County
- NCES district ID
- 0102220
- Math proficiency
- 27% ▼ -32.00%
- Reading proficiency
- 56% ▼ -1.00%
- Median HH income
- $66,058
- Composite
- 37.15/100
- National rank
- #4483
- State rank
- #19 of 129 in AL
Livability — Harvest
- Score
- 72/100
- State rank
- #27
- US rank
- #5986
Category grades
Schools grade is shown separately in the Schools card above.
Census & demographics
- City population
- 30,710
- Population (ZIP)
- 13,977
Population outlook (Madison County) Hauer SSP2
- Today (2025)
- 392,086 people
- By 2030
- 409,788 · +4.5%
- By 2040
- 440,557 · +12.4%
- By 2050
- 460,990 · +17.6%
- By 2075
- 502,872 · +28.3%
- By 2100
- 513,623 · +31.0%
Race, ethnicity, and origin ACS 2023
- Neighborhood character
- Predominantly White (72%)
- Race & ethnicity
- White 72% Black 17% Hispanic / Latino 7% Two or more races 3% Asian 2%
- Hispanic origin (detail)
- Mexican 5%
- Common ancestry
- Italian 3% Slovak 1% Serbian 1%
- Foreign-born
- 2% · Canada
- Languages at home
- 95% English-only · Spanish 4%
Political lean MEDSL · Madison
- 2024 margin
- Lean R (+9.0) · D 44.7% · R 53.7% · Other 1.6%
- 2008→2024 swing
- +6.0pp toward D · 2008: -14.9pp · 2024: -9.0pp
- All cycles
- 2024: R+9.0 2020: R+8.0 2016: R+16.8 2012: R+18.7 2008: R+14.9
Not yet ingested
- Civics
- —
Market trends
- HPI YoY
- ▲ 149.14%
- Current HPI
- 666.8602
- Rent YoY
- —
- Metro
- —
- State GDP YoY
- ▲ 2.94%
- F500 in state
- 4
Industry mix (Fortune 500 HQ in AL)
| Industry | F500 HQs | Revenue |
|---|---|---|
| Financial Services | 1 | $8B |
|
||
| Healthcare | 1 | $5B |
|
||
Price history
+378.8% since first listed7 events — show timeline
- 2026-06-10 Price Changed $215,000 VMLS
- 2026-05-01 Listed $225,000 VMLS
- 2013-07-15 Sold (Public Records) $72,000 Public Records
- 2013-07-12 Sold (MLS) $72,000 VMLS
- 2013-05-06 Listed $72,900 VMLS
- 2013-03-08 Sold (MLS) $40,000 VMLS
- 2012-11-19 Listed $44,900 VMLS
Property tax history
+3.8%/yrLatest (2024): $296 · +0.0% YoY. Source: county tax records.
Cash-flow waterfall
monthlySold comps — $/sqft
last 12 mo · ≤1 miLoading sold comps…