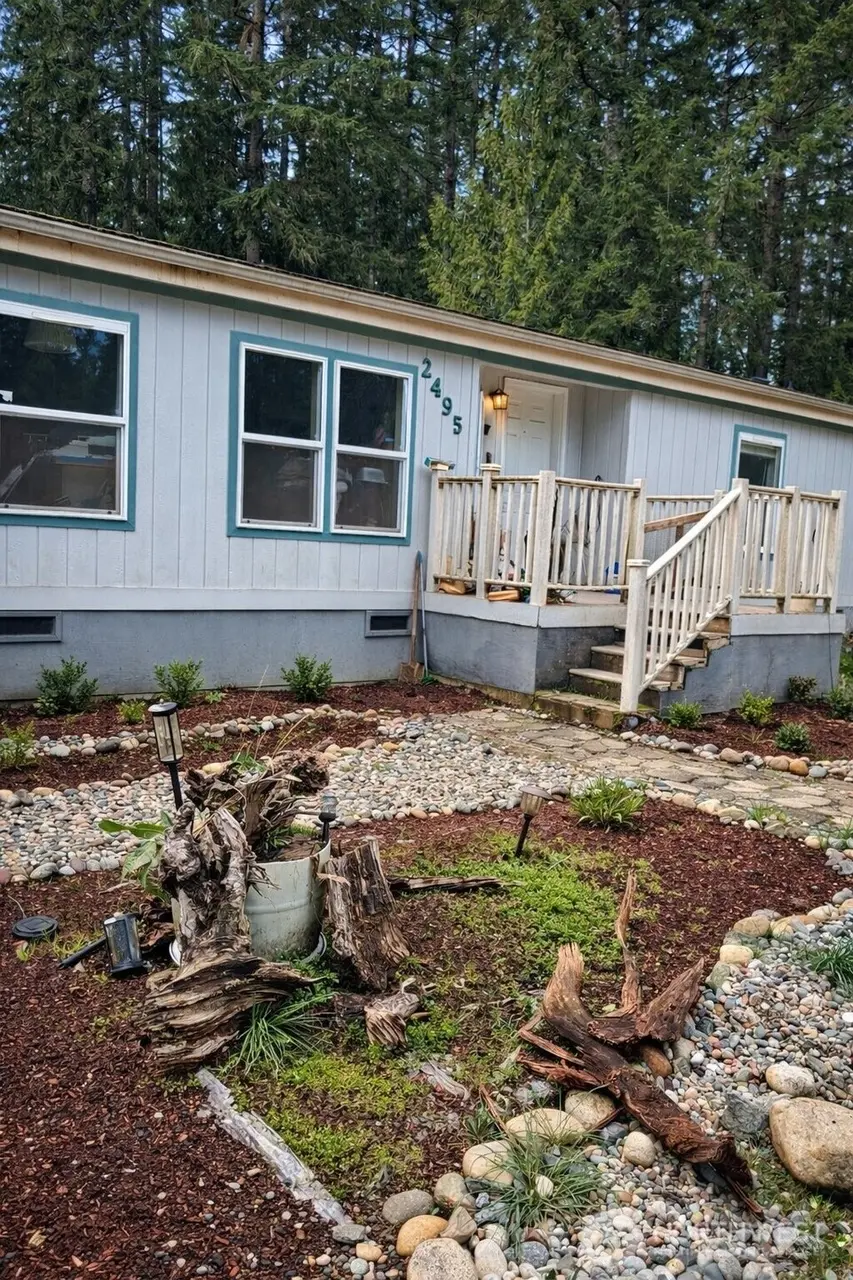
2495 Christopher Rd NW · Seabeck, WA
Flood risk 1/10 · Minimal
- FEMA flood zone
- X (unshaded)
- Chance of flooding over 30 yrs
- 0.0%
- Est. flood insurance / yr
- $507 – $1,088
Fire risk 3/10 · Minor
- Est. fire insurance / yr
- $604 – $1,122
Heat risk 2/10 · Minimal
- Hot days now (above 87°F)
- 7 days/yr
- Hot days in 30 yrs
- 15 days/yr
Wind risk 1/10 · Minimal
- Chance of severe wind over 30 yrs
- —
Air-quality risk 6/10 · Moderate
- Unhealthy air days now
- 7 days/yr
- Unhealthy air days in 30 yrs
- 8 days/yr
Risk factors via First Street. Map © Google.
Why this score? — see what drove the C- grade
The composite is a weighted blend of 9 inputs, each scored 0–100. Each bar is that input's sub-score; the figure is the points it added to the 100-point composite (weight × sub-score).
- ARV discount +15.0/15.0
- Cash flow +14.0/30.0
- Schools +5.5/10.0
- DSCR +4.3/10.0
- 1% rule +3.3/10.0
- Livability +3.2/5.0
- Rent growth +2.5/5.0
- Condition / age +2.5/5.0
- Appreciation +0.0/10.0
$309,900
🖨 Deal sheet (PDF) 📄 Offer letter ✓ Due diligence
Listing remarks
INVESTOR SPECIAL! Tucked away on over 2 private acres in peaceful Seabeck, this 1994 double-wide manufactured home offers the perfect blend of space, privacy, and opportunity. With 3 bedrooms and 2 bathrooms, this property is ideal for those looking to create their own slice of country living while building equity. Step outside and you’ll find a setting that feels like a retreat, featuring multiple outbuildings, a charming chicken coop, and plenty of room to garden, expand, or simply enjoy the outdoors. The partially fenced yard provides flexibility for pets or hobby farming, while the covered patio invites you to slow down and take in the quiet surroundings. Inside, the home offers
Key facts
- Private acres
- Covered patio
- Usable land
Tags
Neighborhood map
What this means for you Summary
Snapshot
- This is a 3-bed/2.0-bath manufactured listed at $310k.
Deal economics
- At list price, monthly cash flow is $42 ($509/yr) — positive.
- The deal already cash-flows at list — no discount required.
- To meet the 1% rule (rent ≥ 1% of price), the offer needs to be $258k (16.7% below list).
- Recommended offer: $258k (16.7% below list) — sets the bar for 1% rule.
- Cap rate 6.5% vs local median 2.2% in Seabeck — top-decile yield for the area; either an underpriced asset or a hidden risk that comps aren't pricing in. Stress-test before assuming the spread holds.
Location & tenants
- Location reads 64/100 on livability (#366 in WA) — a middle-class / working-renter tenant base. Strengths: employment A+, housing A+, crime A; Watch: health & safety C-, amenities F, commute F.
- Central Kitsap School District (urban): math 55% / reading 67% proficiency, ranked #49 of 291 in WA (top 17%) — acceptable for families but not a draw, mixed tenant base, ~2y average lease.
- Zoned schools: Green Mountain Elementary (366 students, 40% FRL); Klahowya Secondary (969 students, 32% FRL).
- Market conditions: 57 active listings in the ZIP; 1,294 units permitted in Kitsap County in 2024 (302 in 5+ unit buildings).
Forward outlook
- Local home prices are declining (-3.0%/yr); year-one equity from $2k of loan paydown is wiped out by about $9k of value loss. Plan a longer hold.
- Kitsap County population projected at +8% by 2050 — modest demand growth; plan on rents tracking national, not racing it.
Negotiation context
- It's been on market 16 days — a 2% lower offer ($305k) is reasonable based on typical stale-listing flexibility.
- 2 sale attempts; this cycle's ask has dropped $19k (6%) from the opening price — seller is motivated, your offer sets the floor, not the list.
- Current owner paid $22k; list at $310k implies a 1317% gain — meaningful room to come down on a strong offer.
Questions for the listing agent
- Is there a deadline driving the sale (1031 exchange, divorce, estate, relocation)? That informs how much negotiation room exists.
- Schools are F-rated, which usually means shorter tenancies and higher turnover. Who's the typical renter profile here, and what's been the actual vacancy rate?
- What's the average days-on-market for RENTAL listings here right now (not sales)? A rising rental-DOM trend means longer vacancies and softer asking-rent achievability than the comps imply.
- What's the recent tenant-quality profile in this submarket — average credit score on applications, eviction rate, late-payment / NSF rate, and stable-employment percentage? A property-management company in the area should have these aggregated.
- How much new for-sale + rental construction is in the pipeline within 1–3 miles? Heavy new supply typically softens prices + rents 12–24 months out; constrained supply supports both.
Investment metrics
- 1% rule
- 0.83% ✗
- Cap rate
- 6.46%
- Cash-on-cash
- 0.59%
- DSCR
- 1.03
- GRM
- 10.0
CMA / ARV
- ARV (median comp)
- $455,194
- List price
- $309,900
- Delta
- -31.92%
- Verdict
- UNDERPRICED
- Comps
- 4 within 2.0 mi
Show comp detail 1 sale within ~0.75 mi
| Address | Dist | Beds/Ba | Sqft | Sold | Price | $/sf | Match |
|---|---|---|---|---|---|---|---|
| 15514 NW Hite Center Rd | 0.62mi | 3/2.5 | 1,512 (0%) | 9mo | $515,050 | $341 | 61 |
Match score weights: distance 35% · size 25% · config 20% · recency 20%. Top-matched comps best support the ARV.
Projected returns pro-forma
-3.0% appreciation · 3.0% rent growth · sell at horizon
- IRR
- -15.4%
- Equity multiple
- 0.45×
- Total profit
- $-47,563
- Equity at exit
- $46,207
- IRR
- -6.9%
- Equity multiple
- 0.56×
- Total profit
- $-38,138
- Equity at exit
- $26,794
Cash invested: $86,772 (down + closing). Projections, not guarantees.
Landlord ↔ Tenant lean methodology
- Overall (STATE)
- 28 Tenant-Leaning
- State Washington
- 28 Tenant-Leaning · D+8
- County
- — inherits STATE
- City
- — inherits STATE
ZIP-level market 98380
- Home prices YoY
- -7.2%
- Active inventory
- 57
- Price-to-rent
- 10.0×
Monthly cashflow live
- Estimated rent
- $2,581 medium interval (Pro) →
- Mortgage (P&I)
- −$1,625
- Tax from tax record
- −$243 /mo · $2,911/yr
- Insurance
- −$129
- HOA
- −$0
- Vacancy / Maint / Mgmt
- −$542
- Net cashflow
- $42
Break-even live
Sensitivity live
| Price | -10% $218 | -5% $130 | +0% $42 | +5% $-45 | +10% $-133 |
|---|---|---|---|---|---|
| Rent | -10% $-161 | -5% $-60 | +0% $42 | +5% $144 | +10% $246 |
| Rate | -1.0pp $199 | -0.5pp $121 | base $42 | +0.5pp $-38 | +1.0pp $-120 |
UW: 25.0% down · 7.5% · 30yr · 1.5% tax · 5.0% vac · 8.0% maint · 8.0% mgmt
Financing live
Cash to close
- Down payment
- $77,475
- Closing costs
- $9,297
- Reserves months
- —
- Total cash needed
- —
Loan-product check · same deal, 3 products live
Conventional
25% down · 7.5% · 30yr
- Down + closing
- —
- Monthly P&I
- —
- Monthly cashflow
- —
- DSCR
- —
- Eligible?
- —
Personal DTI + credit; lowest rate.
DSCR
20% down · 8.5% · 30yr
- Down + closing
- —
- Monthly P&I
- —
- Monthly cashflow
- —
- DSCR
- —
- Eligible?
- —
No personal income docs; deal must DSCR.
Hard money
10% down · 12.0% · 12mo
- Down + closing
- —
- Monthly P&I
- —
- Monthly cashflow
- —
- DSCR
- —
- Eligible?
- —
Short-term bridge; refi at stabilization.
Listing history 8 events
-
2026-06-01status $309,900 Pending 16 DOM
-
2026-05-04status Pending - Backup Offer Requested
-
2026-05-01price $309,900
-
2026-04-27status Active
-
2026-04-03status Pending - Backup Offer Requested
-
2026-04-02price $319,000
-
2026-03-25$329,000 Active
-
1991-11-25soldstatus $21,875
ⓘ Source: listings_history table (triggers on properties + properties_extension) + one-shot
backfill from property_details.listing_events for pre-trigger history.
Tax reassessment forecast WA · Resets to sale price
- Current annual tax
- $2,911 · $243/mo
- Projected year-2 tax
- $3,037 · $253/mo
- Expected delta
- +$126/yr (+$10/mo · 4.3%)
ⓘ Screening estimate from a state-policy table — verify with the county assessor before closing.
Climate risk First Street
- Flood 1/10 Low FEMA zone X (unshaded) · 0% chance over 30 yrs
- Wildfire 3/10 Moderate
- Heat 2/10 Low 7 d/yr ≥87°F today · 15 d/yr by 30 yrs out
- Wind 1/10 Low
- Air quality 6/10 Major 7 unhealthy d/yr today · 8 by 30 yrs out
Nearby sold comps map
Loading sold comps map…
Walkable amenities ~0.75 mi
Loading nearby amenities…
Taxation est. · year 1
- Rental income
- $30,977
- − Mortgage interest
- −$17,359
- − Property taxes
- −$2,911
- − Insurance
- −$1,550
- − Repairs & maintenance
- −$2,478
- − Management
- −$2,478
- − Depreciation
- −$9,015
- Taxable loss
- −$4,814
- Est. tax savings @ 24.0%
- +$1,155
- After-tax cash flow
- $1,665/yr
For passive investors: Depreciation is non-cash, so a rental often shows a tax loss while cash-flowing — sheltering income. Rental losses are passive: they offset passive income freely, and up to $25,000/yr can offset ordinary (W-2) income if you actively participate and your MAGI is under $100k (phasing out to $0 by $150k); unused losses carry forward. On sale, claimed depreciation is recaptured at up to 25%, and gains may owe capital-gains tax (a 1031 exchange can defer both). Figures are a year-1 estimate at your 24.0% rate — not tax advice; consult a CPA.
Schools (NCES district)
- District
- Central Kitsap School District
- NCES district ID
- 5301080
- Math proficiency
- 55% ▲ 1.00%
- Reading proficiency
- 67% ▬ 0.00%
- Median HH income
- $64,825
- Composite
- 54.87/100
- National rank
- #2813
- State rank
- #49 of 291 in WA
Livability — Seabeck
- Score
- 64/100
- State rank
- #366
- US rank
- #13916
Category grades
Schools grade is shown separately in the Schools card above.
Census & demographics
- Population (ZIP)
- 5,187
Population outlook (Kitsap County) Hauer SSP2
- Today (2025)
- 277,525 people
- By 2030
- 285,040 · +2.7%
- By 2040
- 294,957 · +6.3%
- By 2050
- 300,622 · +8.3%
- By 2075
- 315,580 · +13.7%
- By 2100
- 304,340 · +9.7%
Race, ethnicity, and origin ACS 2023
- Neighborhood character
- Predominantly White (88%)
- Race & ethnicity
- White 88% Two or more races 6% Hispanic / Latino 4% Asian 3% Native American 1%
- Common ancestry
- Italian 13% Portuguese 9% Slovak 2%
- Foreign-born
- 4% · Canada, China
- Languages at home
- 94% English-only · Spanish 2% Tagalog/Filipino 2% Other Asian/Pacific 1%
Political lean MEDSL · Kitsap
- 2024 margin
- Strong D (+20.9) · D 58.8% · R 37.9% · Other 3.3%
- 2008→2024 swing
- +8.6pp toward D · 2008: 12.3pp · 2024: 20.9pp
- All cycles
- 2024: D+20.9 2020: D+18.1 2016: D+11.6 2012: D+11.1 2008: D+12.3
Not yet ingested
- Civics
- —
Market trends
- HPI YoY
- ▼ -31.17%
- Current HPI
- 398.8004
- Rent YoY
- —
- Metro
- —
- State GDP YoY
- ▲ 4.65%
- F500 in state
- 22
Industry mix (Fortune 500 HQ in WA)
| Industry | F500 HQs | Revenue |
|---|---|---|
| Retail | 2 | $269B |
|
||
| Technology / Retail | 1 | $638B |
|
||
| Technology | 1 | $245B |
|
||
| Telecommunications | 1 | $38B |
|
||
| Food / Beverage | 1 | $36B |
|
||
| Automotive / Trucks | 1 | $34B |
|
||
Price history
+1316.7% since first listed7 events — show timeline
- 2026-05-04 Pending — NWMLS as Distributed by MLS Grid
- 2026-05-01 Price Changed $309,900 NWMLS as Distributed by MLS Grid
- 2026-04-27 Relisted — NWMLS as Distributed by MLS Grid
- 2026-04-03 Pending — NWMLS as Distributed by MLS Grid
- 2026-04-02 Price Changed $319,000 NWMLS as Distributed by MLS Grid
- 2026-03-25 Listed $329,000 NWMLS as Distributed by MLS Grid
- 1991-11-25 Sold (Public Records) $21,875 Public Records
Property tax history
+3.3%/yrLatest (2026): $2,911 · +1.1% YoY. Source: county tax records.
Cash-flow waterfall
monthlySold comps — $/sqft
last 12 mo · ≤1 miLoading sold comps…