 Triplex
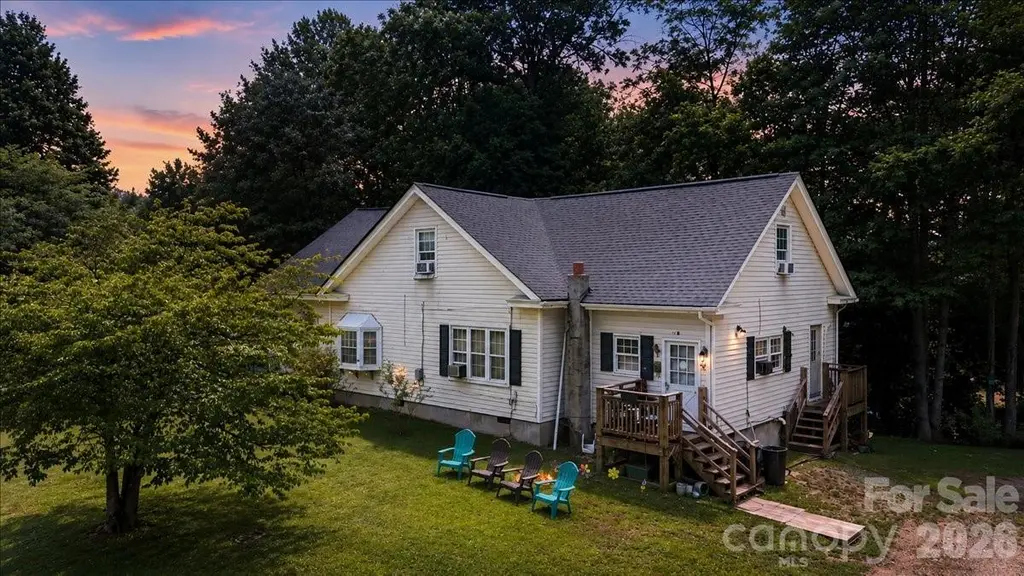
193 Duckworth Ave · Brevard, NC
Flood risk 1/10 · Minimal
- FEMA flood zone
- X (unshaded)
- Chance of flooding over 30 yrs
- 0.0%
- Est. flood insurance / yr
- $507 – $1,088
Fire risk 4/10 · Minor
- Est. fire insurance / yr
- $906 – $1,684
Heat risk 4/10 · Minor
- Hot days now (above 96°F)
- 7 days/yr
- Hot days in 30 yrs
- 21 days/yr
Wind risk 2/10 · Minimal
- Chance of severe wind over 30 yrs
- —
Air-quality risk 3/10 · Minor
- Unhealthy air days now
- 3 days/yr
- Unhealthy air days in 30 yrs
- 3 days/yr
Risk factors via First Street. Map © Google.
Why this score? — see what drove the B- grade
The composite is a weighted blend of 9 inputs, each scored 0–100. Each bar is that input's sub-score; the figure is the points it added to the 100-point composite (weight × sub-score).
- Cash flow +30.0/30.0
- 1% rule +10.0/10.0
- DSCR +10.0/10.0
- ARV discount +7.5/15.0
- Schools +4.0/10.0
- Livability +3.2/5.0
- Rent growth +2.5/5.0
- Condition / age +2.2/5.0
- Appreciation +0.0/10.0
$385,000
🖨 Deal sheet 📄 Offer letter ✓ Due diligence
Multi-family units
County records classify this as Multi-Family (2-4 Unit). Listing-text estimate: 3 units. confirmed
Listing remarks
Attention Investors, Visionaries, and Opportunity Seekers! Rarely does a true triplex become available this close to downtown Brevard. Currently operating as three separate rental units, this income-producing property offers immediate cash-flow potential along with the opportunity to add value through thoughtful improvements and updates. Recognizing the potential of the property, the seller is offering a $10,000 closing credit to help the next owner jumpstart renovations and bring their vision to life. Whether you're an experienced investor, a first-time buyer looking to offset your mortgage with rental income, or someone passionate about creating quality housing in our community, this prop
Key facts
- Cash flow potential
- Easy access to shops
- Easy access to parks
Tags
Property features AI
Finance
- Other: Lot approximately 0.5 acres; Zoned GR8
- Financial info: Tenant pays all utilities; Owner pays none; 3 separate units (triplex)
- HOA & community: No HOA; Pets allowed
Exterior
- Parking: Driveway parking
- Utilities: City water; Public sewer
- Home design: Residential income property (Triplex)
- Construction: Site-built construction; Vinyl exterior; Basement foundation
- Exterior features: Driveway; Gravel and paved road access; Publicly maintained road
Interior
- Kitchen: Oven; Refrigerator
- Bedrooms: 8 bedrooms
- Bathrooms: 3 full bathrooms
- Heating & cooling: Forced air heating; Central air conditioning
- Interior features: Oven; Refrigerator; Washer/Dryer; Apartment in basement; Walk-out basement access
- Laundry & utility: Washer/Dryer; Laundry in multiple locations
Neighborhood map
What this means for you Summary
Snapshot
- This is a 3 × 3-bed/1.0-bath units multifamily listed at $385k. Condition is rated fair.
Deal economics
- At list price, monthly cash flow is $2k ($26k/yr) — positive. Per door: $712/mo.
- The deal already cash-flows at list — no discount required.
- Meets the 1% rule at list price ($6k rent vs $385k).
- Cap rate 12.9% vs local median 2.1% in Brevard — top-decile yield for the area; either an underpriced asset or a hidden risk that comps aren't pricing in. Stress-test before assuming the spread holds.
Location & tenants
- Location reads 64/100 on livability (#353 in NC) — a middle-class / working-renter tenant base. Strengths: cost of living A+, health & safety A+, crime B; Watch: schools D+, amenities F, commute F.
- Transylvania County Schools (town): math 44% / reading 50% proficiency, ranked #79 of 178 in NC (top 44%) — families likely to look elsewhere, expect single-tenant / working-renter base with shorter leases.
- Market conditions: 351 active listings in the ZIP; 217 units permitted in Transylvania County in 2024 (10 in 5+ unit buildings).
- At $6,071/mo this rent would consume 116% of the median local household income ($63k/yr) (locally 852% of renters already pay >50% of income on rent) — very limited rent-growth headroom before tenants either downsize or default.
Forward outlook
- Local home prices are declining (-3.0%/yr); year-one equity from $3k of loan paydown is wiped out by about $12k of value loss. Plan a longer hold.
- Transylvania County population projected to shrink 7% by 2050 — rents likely to lag national; underwrite the cash flow, not the appreciation.
- At projected returns (-3.0% appreciation + 3.0% rent growth), your $108k cash investment doubles in ~6 years — after that, you're playing with house money.
Negotiation context
- Only 13 days on market — expect competitive offers; lowballing is unlikely to land.
Questions for the listing agent
- Can we see the unit-by-unit rent roll, current vacancy, and any below-market leases? What's the average tenancy length?
- What capital expenditures (roof, boiler, parking lot, exteriors) have been made in the last 5 years, and what's planned in the next 2?
- Have any recent inspections been done? Can we get a copy of the seller's disclosures and any deferred-maintenance estimates?
- Is there a deadline driving the sale (1031 exchange, divorce, estate, relocation)? That informs how much negotiation room exists.
- Schools are D-rated, which usually means shorter tenancies and higher turnover. Who's the typical renter profile here, and what's been the actual vacancy rate?
- What's the average days-on-market for RENTAL listings here right now (not sales)? A rising rental-DOM trend means longer vacancies and softer asking-rent achievability than the comps imply.
- What's the recent tenant-quality profile in this submarket — average credit score on applications, eviction rate, late-payment / NSF rate, and stable-employment percentage? A property-management company in the area should have these aggregated.
- How much new apartment / multifamily construction is in the pipeline within 1–3 miles? Heavy new supply (>2% of stock underway) typically softens rents 12–24 months out; light construction supports rent growth.
Investment metrics
- 1% rule
- 1.58% ✓
- Cap rate
- 12.95%
- Cash-on-cash
- 23.77%
- DSCR
- 2.06
- GRM
- 5.3
CMA / ARV
No comps found within radius.
Projected returns pro-forma
-3.0% appreciation · 3.0% rent growth · sell at horizon
- IRR
- 16.9%
- Equity multiple
- 1.68×
- Total profit
- $73,712
- Equity at exit
- $57,405
- IRR
- 25.5%
- Equity multiple
- 3.22×
- Total profit
- $239,691
- Equity at exit
- $33,288
Cash invested: $107,800 (down + closing). Projections, not guarantees.
Landlord ↔ Tenant lean methodology
- Overall (STATE)
- 85 Strongly Landlord-Friendly
- State North Carolina
- 85 Strongly Landlord-Friendly · R+3
- County
- — inherits STATE
- City
- — inherits STATE
ZIP-level market 28712
- Active inventory
- 351
- Price-to-rent
- 15.9×
Monthly cashflow live
- Estimated rent
- $6,071 high interval (Pro) →
- Mortgage (P&I)
- −$2,019
- Tax est. 1.5%
- −$481 /mo · $5,775/yr
- Insurance
- −$160
- HOA
- −$0
- Vacancy / Maint / Mgmt
- −$1,275
- Net cashflow
- $2,135
Break-even live
3-unit breakdown (identical units grouped — click to expand)
| Units | Beds | Baths | Est. rent |
|---|---|---|---|
| 3× units | 3 | 1 | $6,072 |
| #1 | 3 | 1 | $2,024 |
| #2 | 3 | 1 | $2,024 |
| #3 | 3 | 1 | $2,024 |
| Total (3 units) | $6,071 | ||
UW: 25.0% down · 7.5% · 30yr · 1.5% tax · 5.0% vac · 8.0% maint · 8.0% mgmt
Financing live
Cash to close
- Down payment
- $96,250
- Closing costs
- $11,550
- Reserves months
- —
- Total cash needed
- —
Loan-product check · same deal, 3 products live
Conventional
25% down · 7.5% · 30yr
- Down + closing
- —
- Monthly P&I
- —
- Monthly cashflow
- —
- DSCR
- —
- Eligible?
- —
Personal DTI + credit; lowest rate.
DSCR
20% down · 8.5% · 30yr
- Down + closing
- —
- Monthly P&I
- —
- Monthly cashflow
- —
- DSCR
- —
- Eligible?
- —
No personal income docs; deal must DSCR.
Hard money
10% down · 12.0% · 12mo
- Down + closing
- —
- Monthly P&I
- —
- Monthly cashflow
- —
- DSCR
- —
- Eligible?
- —
Short-term bridge; refi at stabilization.
Listing history 10 events
-
2026-06-18days on market $385,000 Active 13 DOM
-
2026-06-17days on market $385,000 Active 12 DOM
-
2026-06-16days on market $385,000 Active 11 DOM
-
2026-06-15days on market $385,000 Active 10 DOM
-
2026-06-14days on market $385,000 Active 8 DOM
-
2026-06-10days on market $385,000 Active 5 DOM
-
2026-06-09days on market $385,000 Active 4 DOM
-
2026-06-08days on market $385,000 Active 3 DOM
-
2026-06-07remarks 699-char remark
-
2026-06-07$385,000 Active 2 DOM
ⓘ Source: listings_history table (triggers on properties + properties_extension) + one-shot
backfill from property_details.listing_events for pre-trigger history.
Climate risk First Street
- Flood 1/10 Low FEMA zone X (unshaded) · 0% chance over 30 yrs
- Wildfire 4/10 Moderate
- Heat 4/10 Moderate 7 d/yr ≥96°F today · 21 d/yr by 30 yrs out
- Wind 2/10 Low
- Air quality 3/10 Moderate 3 unhealthy d/yr today · 3 by 30 yrs out
Nearby sold comps map
Loading sold comps map…
Walkable amenities ~0.75 mi
Loading nearby amenities…
Taxation est. · year 1
- Rental income
- $72,852
- − Mortgage interest
- −$21,566
- − Property taxes
- −$5,775
- − Insurance
- −$1,925
- − Repairs & maintenance
- −$5,828
- − Management
- −$5,828
- − Depreciation
- −$11,200
- Taxable income
- $20,730
- Est. tax owed @ 24.0%
- −$4,975
- After-tax cash flow
- $20,650/yr
For passive investors: Depreciation is non-cash, so a rental often shows a tax loss while cash-flowing — sheltering income. Rental losses are passive: they offset passive income freely, and up to $25,000/yr can offset ordinary (W-2) income if you actively participate and your MAGI is under $100k (phasing out to $0 by $150k); unused losses carry forward. On sale, claimed depreciation is recaptured at up to 25%, and gains may owe capital-gains tax (a 1031 exchange can defer both). Figures are a year-1 estimate at your 24.0% rate — not tax advice; consult a CPA.
Condition & rehab AI · 13 photos
This triplex requires moderate renovations, including painting the exterior siding, updating the kitchen, and improving the landscaping. These updates will significantly increase its resale and rental value.
Repairs flagged
- Major Flooring — The flooring is visibly worn and in poor condition, requiring replacement.
- Moderate Exterior siding — The exterior siding shows some discoloration and minor wear, indicating a need for repainting or staining.
Value-add opportunities
- Both Painting the exterior siding — Painting the exterior siding will improve the curb appeal and increase the property's resale and rental value.
- Rental Refrigerator replacement — Replacing the old refrigerator with a modern, energy-efficient model will improve the rental experience and attract tenants.
- Both Kitchen cabinets and countertops replacement — Updating the kitchen with new cabinets and countertops will improve the overall look and functionality of the space, increasing both resale and rental value.
- Both Painting interior walls and ceilings — Painting the interior walls and ceilings will freshen up the space and improve the overall appearance, increasing both resale and rental value.
- Both Landscaping and yard maintenance — A well-maintained yard and landscaping will improve the curb appeal and attract potential buyers or tenants, increasing both resale and rental value.
Renovation cost estimate screening
| Repair item | Severity | Est. cost |
|---|---|---|
| Flooring · The flooring is visibly worn and in poor condition, requiring replacement. | Major | $15,000–50,000 |
| Exterior siding · The exterior siding shows some discoloration and minor wear, indicating a need for repainting or staining. | Moderate | $3,000–15,000 |
| Total estimated repair cost · 2 items | $18,000–65,000 |
Value-add ROI direction
- Both Painting the exterior siding — Painting the exterior siding will improve the curb appeal and increase the property's resale and rental value. ↑
- Rental Refrigerator replacement — Replacing the old refrigerator with a modern, energy-efficient model will improve the rental experience and attract tenants. ↑
- Both Kitchen cabinets and countertops replacement — Updating the kitchen with new cabinets and countertops will improve the overall look and functionality of the space, increasing both resale and rental value. ↑
- Both Painting interior walls and ceilings — Painting the interior walls and ceilings will freshen up the space and improve the overall appearance, increasing both resale and rental value. ↑
- Both Landscaping and yard maintenance — A well-maintained yard and landscaping will improve the curb appeal and attract potential buyers or tenants, increasing both resale and rental value. ↑
ⓘ Cost ranges are severity-bucket heuristics (US national rule-of-thumb). Get contractor quotes + a written scope before underwriting a rehab budget.
Schools (NCES district)
- District
- Transylvania County Schools
- NCES district ID
- 3704530
- Math proficiency
- 44% ▼ -1.00%
- Reading proficiency
- 50% ▼ -1.00%
- Median HH income
- $42,365
- Composite
- 39.55/100
- National rank
- #3938
- State rank
- #79 of 178 in NC
Livability — Brevard
- Score
- 64/100
- State rank
- #353
- US rank
- #13958
Category grades
Schools grade is shown separately in the Schools card above.
Census & demographics
- Census place
- Brevard, NC
- County
- Transylvania County · 19,977 people
- City population
- 19,977
- Metro
- Brevard, NC
- Population (ZIP)
- 19,977
- Household income
- $63,045
- Rent vs Own
- Severe rent burden
- 852.0
Population outlook (Transylvania County) Hauer SSP2
- Today (2025)
- 33,142 people
- By 2030
- 32,987 · -0.5%
- By 2040
- 32,159 · -3.0%
- By 2050
- 30,937 · -6.7%
- By 2075
- 27,778 · -16.2%
- By 2100
- 24,136 · -27.2%
Race, ethnicity, and origin ACS 2023
- Neighborhood character
- Predominantly White (89%)
- Race & ethnicity
- White 89% Black 5% Two or more races 5% Hispanic / Latino 3%
- Common ancestry
- Slovak 5% Serbian 4% Lithuanian 3%
- Foreign-born
- 2% · Canada
- Languages at home
- 99% English-only · Spanish 1%
Political lean MEDSL · Transylvania
- 2024 margin
- R (+12.2) · D 43.3% · R 55.5% · Other 1.2%
- 2008→2024 swing
- +0.4pp no change · 2008: -12.6pp · 2024: -12.2pp
- All cycles
- 2024: R+12.2 2020: R+15.7 2016: R+22.5 2012: R+16.9 2008: R+12.6
Not yet ingested
- Civics
- —
Market trends
- HPI YoY
- ▼ -197.94%
- Current HPI
- 217.8358
- Rent YoY
- —
- Metro
- Brevard, NC
- State GDP YoY
- ▲ 3.28%
- F500 in state
- 26
Industry mix (Fortune 500 HQ in NC)
| Industry | F500 HQs | Revenue |
|---|---|---|
| Financial Services | 2 | $213B |
|
||
| Retail | 2 | $95B |
|
||
| Industrial Conglomerate | 1 | $38B |
|
||
| Metals / Steel | 1 | $35B |
|
||
| Utilities | 1 | $30B |
|
||
| Industrial Machinery | 1 | $19B |
|
||
Price history
1 event — show timeline
- 2026-06-05 Listed $385,000 CANOPYMLS as Distributed by MLS Grid
Cash-flow waterfall
monthlySold comps — $/sqft
last 12 mo · ≤1 miLoading sold comps…