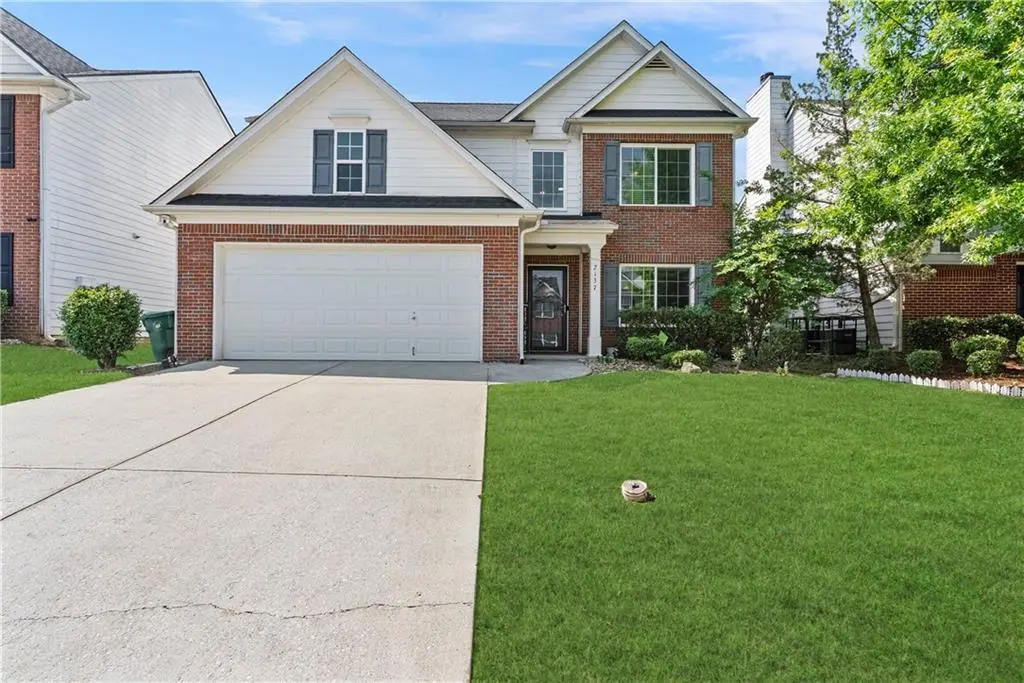
2137 Black Oak Ln · Conley, GA
Flood risk 1/10 · Minimal
- FEMA flood zone
- X (unshaded)
- Chance of flooding over 30 yrs
- 0.0%
- Est. flood insurance / yr
- $507 – $1,088
Fire risk 3/10 · Minor
- Est. fire insurance / yr
- $963 – $1,789
Heat risk 6/10 · Moderate
- Hot days now (above 105°F)
- 7 days/yr
- Hot days in 30 yrs
- 19 days/yr
Wind risk 6/10 · Moderate
- Chance of severe wind over 30 yrs
- 27.0%
Air-quality risk 4/10 · Minor
- Unhealthy air days now
- 4 days/yr
- Unhealthy air days in 30 yrs
- 6 days/yr
Risk factors via First Street. Map © Google.
Why this score? — see what drove the D- grade
The composite is a weighted blend of 9 inputs, each scored 0–100. Each bar is that input's sub-score; the figure is the points it added to the 100-point composite (weight × sub-score).
- ARV discount +12.0/15.0
- Cash flow +10.2/30.0
- Rent growth +3.6/5.0
- Livability +3.1/5.0
- 1% rule +2.9/10.0
- DSCR +2.9/10.0
- Condition / age +2.5/5.0
- Schools +2.1/10.0
- Appreciation +0.0/10.0
$299,900
🖨 Deal sheet (PDF) 📄 Offer letter ✓ Due diligence
Listing remarks
Welcome to 2137 Black Oak Lane in Ellenwood, GA where space, comfort, and convenience come together! This beautifully maintained 4-bedroom, 2.5-bathroom home offers a functional layout designed for both everyday living and entertaining. Step inside to find an open-concept kitchen that flows seamlessly into the main living areas, making it ideal for hosting family and friends while preparing meals. The home features a massive primary suite, providing a private retreat with ample space to relax and unwind. One of the standout features is the custom sunroom, offering additional living space filled with natural light perfect for morning coffee, a home office, or year-round enjoyment. Outside, y
Key facts
- Open-concept kitchen
- Custom sunroom
- 6,098 sq ft lot
Tags
Property features AI
Finance
- Other: City street frontage; Located in Dekalb County
- HOA & community: Homeowners association with an annual fee of $285 covering grounds maintenance
Exterior
- Parking: Attached parking
- Utilities: Public water; Public sewer; Electricity available; Natural gas available; Cable available; Underground utilities
- Home design: Two-story home; Brick front with vinyl siding; Slab foundation; Composition roof; ENERGY STAR Certified home
- Construction: Brick front and vinyl siding construction; Composition roof; Slab foundation
- Exterior features: Private backyard; Back yard wood fencing; Awning(s); Covered patio/porch
Interior
- Kitchen: Eat-in kitchen with breakfast area and pantry; Open view to the family room; Gas range; Microwave; Range hood; Dishwasher; Disposal
- Bedrooms: Oversized primary suite; Roommate floor plan; Four bedrooms on the upper level
- Flooring: Carpet; Luxury vinyl
- Bathrooms: Two full bathrooms; One half bathroom; Primary bathroom with double vanity, separate tub and shower, soaking tub, and vaulted ceiling
- Heating & cooling: Central heating (natural gas); Central air; Ceiling fans
- Interior features: Entrance foyer; Low-flow plumbing fixtures; Walk-in closets; Bay windows; Double-pane windows; Window treatments; One fireplace in the family room; ENERGY STAR qualified appliances
- Laundry & utility: Upper-level laundry in hall/laundry room
Neighborhood map
What this means for you Summary
Snapshot
- This is a 4-bed/2.5-bath single-family listed at $300k.
Deal economics
- At list price, monthly cash flow is $-171 ($-2k/yr) — negative.
- To cash-flow at today's rent, offer at most $270k (10.1% below list).
- To meet the 1% rule (rent ≥ 1% of price), the offer needs to be $237k (20.9% below list).
- Recommended offer: $237k (20.9% below list) — sets the bar for 1% rule.
Location & tenants
- Location reads 62/100 on livability (#299 in GA) — a middle-class / working-renter tenant base. Strengths: cost of living A+, housing A+; Watch: crime D+, amenities F, commute F.
- Dekalb County (suburban): math 19% / reading 28% proficiency, ranked #125 of 174 in GA (top 72%) — low school quality limits family demand, transient renter base, plan for 1-2y turnover; 68% free/reduced lunch — lower-income household profile, screen leases tightly.
- Zoned schools: Cedar Grove Elementary School (math 15% / reading 24%, grade F, #873 of 1,228 statewide, top 71%, 565 students, 100% FRL); Cedar Grove Middle School (math 2% / reading 17%, grade F, #433 of 470 statewide, top 93%, 777 students, 100% FRL); Cedar Grove High School (math 8% / reading 17%, grade F, #336 of 424 statewide, top 80%, 1,123 students, 100% FRL) — zoned schools average 100% FRL vs 68% district-wide (32 pts higher); higher-poverty schools than district average — tighter screening recommended.
- Market conditions: Rents rising fast (+4.6%/yr); 254 active listings in the ZIP; 23 comparable units currently listed for rent nearby; rentals at typical pace (median 26d on market — plan ~3-4 weeks tenant-placement turnaround); solid renter incomes; 1,240 units permitted in DeKalb County in 2024 (385 in 5+ unit buildings).
- This rent runs 36% of the median local income ($80k/yr) — at the standard rent-burdened threshold; future hikes will face affordability resistance.
Forward outlook
- Local home prices are declining (-3.0%/yr); year-one equity from $2k of loan paydown is wiped out by about $9k of value loss. Plan a longer hold.
- DeKalb County population projected at +28% by 2050 — long-run rental-demand tailwind backs the buy-and-hold thesis.
Negotiation context
- It's been on market 36 days — a 3% lower offer ($291k) is reasonable based on typical stale-listing flexibility.
- 4 sale attempts with the ask held roughly flat each time — persistent listings suggest the price (not the market) is what's stuck; bring a comps-based counter.
Risks & watch-outs
- Climate carrying-cost: major wind risk, 27% chance of damaging wind over 30y; extreme-heat days projected 7→19/yr by 2055 (HVAC capex compounding) — expect insurance premiums to compound above CPI over the hold.
Questions for the listing agent
- What do current leases actually rent for vs. the listed asking? Can we see a recent rent roll and the last 12 months of T-12 income?
- It's been on market 36 days. Have you received any prior offers? Is the seller open to a 21% concession, seller financing, or rate buy-down credit?
- What does the HOA fee cover, when was the last increase, and are there any pending special assessments or reserve-fund shortfalls?
- Is there a deadline driving the sale (1031 exchange, divorce, estate, relocation)? That informs how much negotiation room exists.
- Schools are F-rated, which usually means shorter tenancies and higher turnover. Who's the typical renter profile here, and what's been the actual vacancy rate?
- Crime grade is D in this area — have there been break-ins, vandalism, or insurance claims at this property in the last 3 years? What carrier currently insures it and at what premium?
- The area grade is low — what's the realistic commute time and amenity access for the typical tenant pool here? Any planned neighborhood developments (good or bad) we should know about?
- What's the average days-on-market for RENTAL listings here right now (not sales)? A rising rental-DOM trend means longer vacancies and softer asking-rent achievability than the comps imply.
- What's the recent tenant-quality profile in this submarket — average credit score on applications, eviction rate, late-payment / NSF rate, and stable-employment percentage? A property-management company in the area should have these aggregated.
- How much new for-sale + rental construction is in the pipeline within 1–3 miles? Heavy new supply typically softens prices + rents 12–24 months out; constrained supply supports both.
Investment metrics
- 1% rule
- 0.79% ✗
- Cap rate
- 5.61%
- Cash-on-cash
- -2.45%
- DSCR
- 0.89
- GRM
- 10.5
CMA / ARV
- ARV (median comp)
- $333,352
- List price
- $299,900
- Delta
- -10.04%
- Verdict
- UNDERPRICED
- Comps
- 20 within 1.0 mi
Show comp detail 12 sales within ~0.75 mi
| Address | Dist | Beds/Ba | Sqft | Sold | Price | $/sf | Match |
|---|---|---|---|---|---|---|---|
| 2153 Pine View Trl | 0.06mi | 4/2.5 | 2,258 (+5%) | 8mo | $275,000 | $122 | 82 |
| 2114 Black Oak Ln | 0.05mi | 4/2.5 | 2,258 (+5%) | 11mo | $292,500 | $130 | 80 |
| 4111 Village Crossing Cir | 0.50mi | 4/2.5 | 2,120 (-2%) | 5mo | $339,000 | $160 | 70 |
| 4376 Grant Forest Cir | 0.10mi | 3/2.5 (-1) | 1,990 (-8%) | 11mo | $295,000 | $148 | 69 |
| 2243 Pine View Trl | 0.10mi | 4/2.5 | 2,438 (+13%) | 7mo | $320,000 | $131 | 67 |
| 2309 Pine View Trl | 0.15mi | 5/3.0 (+1) | 1,967 (-9%) | 7mo | $260,000 | $132 | 66 |
| 3891 Village Crossing Ln | 0.40mi | 4/2.5 | 2,374 (+10%) | 5mo | $339,000 | $143 | 60 |
| 2680 Lower Village Dr | 0.34mi | 4/2.5 | 2,374 (+10%) | 10mo | $352,000 | $148 | 59 |
| 2535 Brookgate Xing | 0.47mi | 5/2.0 (+1) | 2,252 (+5%) | 9mo | $284,000 | $126 | 56 |
| 4425 Boulder Springs Cv | 0.58mi | 5/3.0 (+1) | 2,442 (+13%) | 5mo | $278,999 | $114 | 40 |
| 3943 Brookgate Ct | 0.62mi | 5/2.5 (+1) | 2,402 (+12%) | 10mo | $300,000 | $125 | 39 |
| 2825 Ellenwood Village Way | 0.45mi | 5/4.0 (+1) | 2,442 (+13%) | 11mo | $380,000 | $156 | 36 |
Match score weights: distance 35% · size 25% · config 20% · recency 20%. Top-matched comps best support the ARV.
Projected returns pro-forma
-3.0% appreciation · 4.56% rent growth · sell at horizon
- IRR
- -18.7%
- Equity multiple
- 0.34×
- Total profit
- $-55,698
- Equity at exit
- $44,716
- IRR
- -8.3%
- Equity multiple
- 0.45×
- Total profit
- $-46,451
- Equity at exit
- $25,930
Cash invested: $83,972 (down + closing). Projections, not guarantees.
Landlord ↔ Tenant lean methodology
- Overall (STATE)
- 90 Strongly Landlord-Friendly
- State Georgia
- 90 Strongly Landlord-Friendly · R+3
- County
- — inherits STATE
- City
- — inherits STATE
ZIP-level market 30294
- Home prices YoY
- -25.0%
- Rents YoY
- 4.6%
- Active inventory
- 254
- Price-to-rent
- 10.5×
Monthly cashflow live
- Estimated rent
- $2,371 high interval (Pro) →
- Mortgage (P&I)
- −$1,573
- Tax from tax record
- −$323 /mo · $3,871/yr
- Insurance
- −$125
- HOA
- −$24
- Vacancy / Maint / Mgmt
- −$498
- Net cashflow
- $-171
Break-even live
Sensitivity live
| Price | -10% $-1 | -5% $-86 | +0% $-171 | +5% $-256 | +10% $-341 |
|---|---|---|---|---|---|
| Rent | -10% $-358 | -5% $-265 | +0% $-171 | +5% $-77 | +10% $16 |
| Rate | -1.0pp $-20 | -0.5pp $-95 | base $-171 | +0.5pp $-249 | +1.0pp $-328 |
UW: 25.0% down · 7.5% · 30yr · 1.5% tax · 5.0% vac · 8.0% maint · 8.0% mgmt
Financing live
Cash to close
- Down payment
- $74,975
- Closing costs
- $8,997
- Reserves months
- —
- Total cash needed
- —
Loan-product check · same deal, 3 products live
Conventional
25% down · 7.5% · 30yr
- Down + closing
- —
- Monthly P&I
- —
- Monthly cashflow
- —
- DSCR
- —
- Eligible?
- —
Personal DTI + credit; lowest rate.
DSCR
20% down · 8.5% · 30yr
- Down + closing
- —
- Monthly P&I
- —
- Monthly cashflow
- —
- DSCR
- —
- Eligible?
- —
No personal income docs; deal must DSCR.
Hard money
10% down · 12.0% · 12mo
- Down + closing
- —
- Monthly P&I
- —
- Monthly cashflow
- —
- DSCR
- —
- Eligible?
- —
Short-term bridge; refi at stabilization.
Rent comps 23 comps
| Address | Beds | Baths | Sqft | Rent | $/sqft | DOM | Units | Dist |
|---|---|---|---|---|---|---|---|---|
| 2135 Pine View Trl Ellenwood, GA | 5.0 | 3.0 | 2282 | $2,300 | $1.01 | 7d | 1 | 0.03mi |
| 4197 Grant Forest Cir Ellenwood, GA | 4.0 | 2.5 | 2208 | $2,300 | $1.04 | 45d | 1 | 0.17mi |
| 2274 Silver Maple Cir Ellenwood, GA | 3.0 | 2.5 | 1673 | $2,000 | $1.20 | 26d | 1 | 0.19mi |
| 2010 Redwood Trce Ellenwood, GA | 4.0 | 2.5 | 2036 | $2,079 | $1.02 | 24d | 1 | 0.29mi |
| 4265 Loveless Pl Ellenwood, GA | 3.0 | 2.0 | 1426 | $1,715 | $1.20 | 24d | 1 | 0.46mi |
| 2532 Brookgate Xing Ellenwood, GA | 5.0 | 2.0 | 1438 | $1,995 | $1.39 | 7d | 1 | 0.49mi |
| 2503 Brookgate Way Ellenwood, GA | 4.0 | 2.5 | 1924 | $2,215 | $1.15 | 22d | 1 | 0.51mi |
| 3912 Old Ivy Ct Ellenwood, GA | 3.0 | 1.5 | 1718 | $2,000 | $1.16 | 45d | 1 | 0.52mi |
| 2334 Brookgate Way Ellenwood, GA | 5.0 | 2.5 | 2318 | $2,245 | $0.97 | 7d | 1 | 0.64mi |
| 2340 Brookgate Way Ellenwood, GA | 4.0 | 2.0 | 1924 | $2,024 | $1.05 | 22d | 1 | 0.64mi |
| 2141 Silva Ct Conley, GA | 4.0 | 2.5 | 2097 | $2,180 | $1.04 | 26d | 1 | 0.68mi |
| 1793 Cedar Walk Ln Conley, GA | 3.0 | 2.0 | 2143 | $1,950 | $0.91 | 45d | 1 | 0.68mi |
| 4095 Gracewood Park Dr Ellenwood, GA | 4.0 | 2.0 | 2394 | $2,389 | $1.00 | 24d | 1 | 0.76mi |
| 4149 Connor Dr Ellenwood, GA | 4.0 | 3.0 | 2300 | $1,975 | $0.86 | 7d | 1 | 0.81mi |
| 3679 Bouldercrest Rd Ellenwood, GA | 3.0 | 3.5 | 1500 | $1,900 | $1.27 | 45d | 1 | 0.87mi |
| 3691 Connor Dr Ellenwood, GA | 3.0 | 3.0 | 1400 | $1,900 | $1.36 | 45d | 1 | 0.89mi |
| 4284 Cedar Lake Cv Conley, GA | 5.0 | 3.0 | 2656 | $3,000 | $1.13 | 14d | 1 | 0.89mi |
| 3981 Ivy Trace Ln Ellenwood, GA | 3.0 | 2.5 | 1608 | $2,184 | $1.36 | 26d | 1 | 0.94mi |
| 2016 Smithfield Ave Ellenwood, GA | 5.0 | 3.0 | 2880 | $2,670 | $0.93 | 1d | 1 | 0.98mi |
| 4153 Ward Lake Trl Ellenwood, GA | 3.0 | 2.0 | 1460 | $1,930 | $1.32 | 45d | 1 | 1.22mi |
| 2882 Ward Lake Way Ellenwood, GA | 3.0 | 2.5 | 1685 | $1,676 | $0.99 | 45d | 1 | 1.32mi |
| 4136 Moore Rd Ellenwood, GA | 4.0 | 2.0 | 1888 | $1,981 | $1.05 | 45d | 1 | 1.39mi |
| 2327 Tolliver Pl Ellenwood, GA | 4.0 | 2.5 | 1688 | $2,111 | $1.25 | 45d | 1 | 1.46mi |
HOA detail
- Monthly dues
- $24 · $288/yr
Listing history 7 events
-
2026-05-31days on market $299,900 Active 36 DOM
-
2026-05-07status Back On Market 1449-char remark
-
2026-05-07status Active 1461-char remark
-
2026-05-06status Under Contract 1449-char remark
-
2026-05-06status Pending 1461-char remark
-
2026-04-24$299,900 New 1449-char remark
-
2026-04-24$299,900 Active 1461-char remark
ⓘ Source: listings_history table (triggers on properties + properties_extension) + one-shot
backfill from property_details.listing_events for pre-trigger history.
Tax reassessment forecast GA · Resets to sale price
- Current annual tax
- $3,871 · $323/mo
- Projected year-2 tax
- $3,871 · $323/mo
- Expected delta
- $0/yr ($0/mo · 0.0%)
ⓘ Screening estimate from a state-policy table — verify with the county assessor before closing.
Climate risk First Street
- Flood 1/10 Low FEMA zone X (unshaded) · 0% chance over 30 yrs
- Wildfire 3/10 Moderate
- Heat 6/10 Major 7 d/yr ≥105°F today · 19 d/yr by 30 yrs out
- Wind 6/10 Major 27% chance of damaging wind over 30 yrs
- Air quality 4/10 Moderate 4 unhealthy d/yr today · 6 by 30 yrs out
Nearby sold comps map
Loading sold comps map…
Walkable amenities ~0.75 mi
Loading nearby amenities…
Taxation est. · year 1
- Rental income
- $28,453
- − Mortgage interest
- −$16,799
- − Property taxes
- −$3,871
- − Insurance
- −$1,500
- − Repairs & maintenance
- −$2,276
- − Management
- −$2,276
- − HOA
- −$288
- − Depreciation
- −$8,724
- Taxable loss
- −$7,282
- Est. tax savings @ 24.0%
- +$1,748
- After-tax cash flow
- $-306/yr
For passive investors: Depreciation is non-cash, so a rental often shows a tax loss while cash-flowing — sheltering income. Rental losses are passive: they offset passive income freely, and up to $25,000/yr can offset ordinary (W-2) income if you actively participate and your MAGI is under $100k (phasing out to $0 by $150k); unused losses carry forward. On sale, claimed depreciation is recaptured at up to 25%, and gains may owe capital-gains tax (a 1031 exchange can defer both). Figures are a year-1 estimate at your 24.0% rate — not tax advice; consult a CPA.
Schools (NCES district)
- District
- Dekalb County
- NCES district ID
- 1301740
- Math proficiency
- 19% ▼ -12.00%
- Reading proficiency
- 28% ▼ -7.00%
- Median HH income
- $51,448
- Composite
- 20.92/100
- National rank
- #8482
- State rank
- #125 of 174 in GA
Livability — Conley
- Score
- 62/100
- State rank
- #299
- US rank
- #16248
Category grades
Schools grade is shown separately in the Schools card above.
Census & demographics
- County
- Henry County · 316,359 people
- City population
- 8,116
- Metro
- Atlanta-Sandy Springs-Alpharetta, GA
- Population (ZIP)
- 41,983
- Household income
- $79,762
- Rent vs Own
- Severe rent burden
- 864.0
Population outlook (DeKalb County) Hauer SSP2
- Today (2025)
- 839,977 people
- By 2030
- 891,768 · +6.2%
- By 2040
- 988,894 · +17.7%
- By 2050
- 1,074,583 · +27.9%
- By 2075
- 1,245,026 · +48.2%
- By 2100
- 1,303,135 · +55.1%
Race, ethnicity, and origin ACS 2023
- Neighborhood character
- Predominantly Black (84%)
- Race & ethnicity
- Black 84% Hispanic / Latino 7% Two or more races 6% White 6% Asian 1%
- Hispanic origin (detail)
- Mexican 6%
- Common ancestry
- Hispanic 1%
- Foreign-born
- 7% · Canada, Vietnam
- Languages at home
- 91% English-only · Spanish 6% Vietnamese 1% French/Haitian/Cajun 1%
Political lean MEDSL · DeKalb
- 2024 margin
- Solid D (+64.8) · D 81.9% · R 17.1% · Other 1.0%
- 2008→2024 swing
- +6.1pp toward D · 2008: 58.6pp · 2024: 64.8pp
- All cycles
- 2024: D+64.8 2020: D+67.4 2016: D+64.8 2012: D+56.8 2008: D+58.6
Not yet ingested
- Civics
- —
Market trends
- HPI YoY
- ▼ -70.99%
- Current HPI
- 213.1999
- Rent YoY
- ▲ 4.56%
- Metro
- Atlanta-Sandy Springs-Alpharetta, GA
- State GDP YoY
- ▲ 2.66%
- F500 in state
- 28
Industry mix (Fortune 500 HQ in GA)
| Industry | F500 HQs | Revenue |
|---|---|---|
| Paper / Packaging | 2 | $29B |
|
||
| Retail | 1 | $160B |
|
||
| Transportation / Logistics | 1 | $91B |
|
||
| Airlines | 1 | $62B |
|
||
| Consumer Goods | 1 | $47B |
|
||
| Utilities | 1 | $25B |
|
||
Price history
+0.0% since first listed8 events — show timeline
- 2026-05-31 Listing Removed — FMLS
- 2026-05-31 Listing Removed — GAMLS
- 2026-05-07 Relisted — GAMLS
- 2026-05-07 Relisted — FMLS
- 2026-05-06 Pending — GAMLS
- 2026-05-06 Pending — FMLS
- 2026-04-24 Listed $299,900 FMLS
- 2026-04-24 Listed $299,900 GAMLS
Property tax history
+4.8%/yrLatest (2025): $3,871 · -0.9% YoY. Source: county tax records.
Cash-flow waterfall
monthlySold comps — $/sqft
last 12 mo · ≤1 miLoading sold comps…