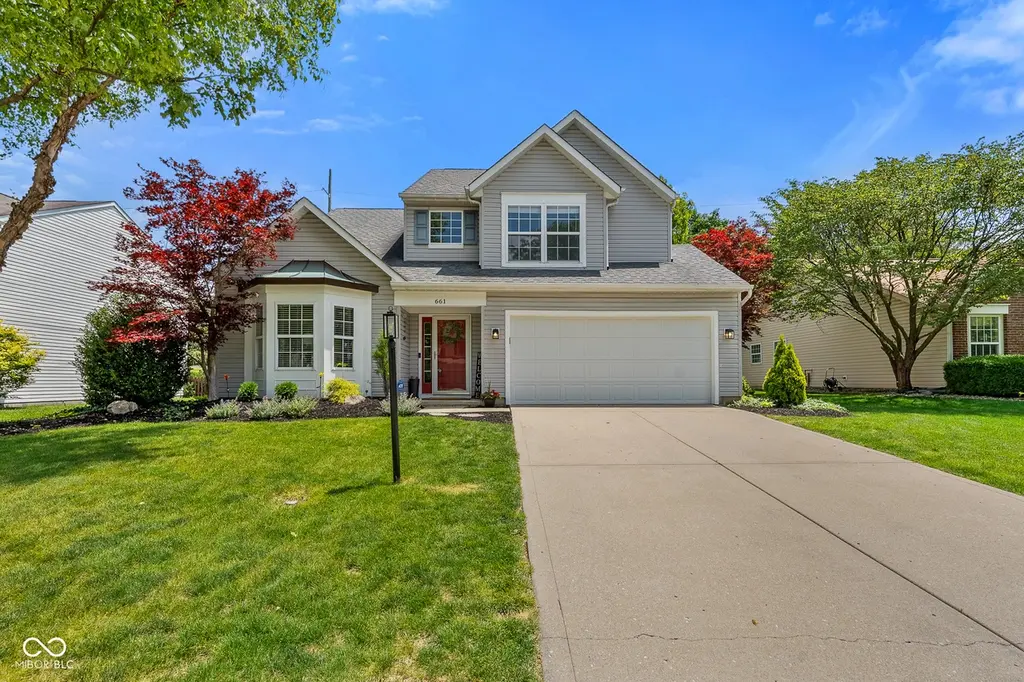
661 Country Walk Dr · Brownsburg, IN
Flood risk 1/10 · Minimal
- FEMA flood zone
- X (unshaded)
- Chance of flooding over 30 yrs
- 0.0%
- Est. flood insurance / yr
- $507 – $1,088
Fire risk 1/10 · Minimal
- Est. fire insurance / yr
- $717 – $1,331
Heat risk 3/10 · Minor
- Hot days now (above 101°F)
- 7 days/yr
- Hot days in 30 yrs
- 19 days/yr
Wind risk 2/10 · Minimal
- Chance of severe wind over 30 yrs
- 0.0%
Air-quality risk 2/10 · Minimal
- Unhealthy air days now
- 1 days/yr
- Unhealthy air days in 30 yrs
- 2 days/yr
Risk factors via First Street. Map © Google.
Why this score? — see what drove the D grade
The composite is a weighted blend of 9 inputs, each scored 0–100. Each bar is that input's sub-score; the figure is the points it added to the 100-point composite (weight × sub-score).
- Cash flow +10.9/30.0
- ARV discount +10.6/15.0
- Schools +6.3/10.0
- Rent growth +4.1/5.0
- Livability +3.8/5.0
- DSCR +3.2/10.0
- 1% rule +2.5/10.0
- Condition / age +2.5/5.0
- Appreciation +0.0/10.0
$329,900
🖨 Deal sheet (PDF) 📄 Offer letter ✓ Due diligence
Listing remarks MLS
WELL MAINTAINED 4 BR, 2.5 BA home right in the heart of Bburg close to schools & shopping. 2-STORY ENTRY leads to VAULTED LIVING RM and sep OFFICE (which can be used as a DR). Cozy FR w/ WOODBURNING FRPLC. Plenty of room to gather in the Eat-In Kitchen w/ Center Island w/ Brkfst Bar, Pantry and room for a large table. Newer counters & kit sink. Stylish inside & out w/ small backyard to maintain w/ DECK and MATURE TREES. Many UPDATES thru-out the home. Great Curb Appeal and Prof Landscaped.
Key facts
- New deck
- Fully fenced yard
- Center island
Tags
Property features AI
Finance
- Other: Property is on approximately 0.19 acre (<1/4 acre)
- HOA & community: Homeowner association with annual fee; Annual association fee applies and includes entrance/common maintenance and management; HOA provides maintenance and management; covenants and restrictions apply
Exterior
- Parking: Attached garage; Two garage spaces; Finished garage with garage door opener and keyless entry; Guest street parking; Concrete driveway
- Security: Smoke detectors; Smart lock(s)
- Utilities: Public water; Municipal sewer connected; Natural gas connected; Cable connected
- Home design: Single family residence; Two levels; Faces west
- Construction: Vinyl siding; Slab foundation
- Exterior features: Deck; Exterior lighting; Smart locks; Full yard fencing; Mature trees; Sidewalks; Storm sewer
Interior
- Kitchen: Dishwasher; Electric oven; Microwave with hood; Garbage disposal; Refrigerator; Kitchen island; Eat-in kitchen and breakfast bar; Pantry
- Bedrooms: Primary bedroom with walk-in closet; Four bedrooms on upper level
- Bathrooms: Two full bathrooms; One half bathroom; Primary bathroom with double sinks, suite layout, and tub/shower
- Heating & cooling: Forced air heating (natural gas); Central air conditioning
- Interior features: Attic access; Breakfast bar; Vaulted ceilings; Kitchen island; Eat-in kitchen; Pantry; Smart thermostat; Walk-in closet(s); Formal living room
- Laundry & utility: Washer; Dryer; Water softener (owned); Gas water heater; Laundry on main level
Neighborhood map
What this means for you Summary
Snapshot
- This is a 4-bed/2.5-bath single-family listed at $330k.
Deal economics
- At list price, monthly cash flow is $-143 ($-2k/yr) — negative.
- To cash-flow at today's rent, offer at most $305k (7.6% below list).
- To meet the 1% rule (rent ≥ 1% of price), the offer needs to be $246k (25.4% below list).
- Recommended offer: $246k (25.4% below list) — sets the bar for 1% rule.
- Cap rate 5.8% vs local median 3.8% in Brownsburg — top-decile yield for the area; either an underpriced asset or a hidden risk that comps aren't pricing in. Stress-test before assuming the spread holds.
Location & tenants
- Location reads 75/100 on livability (#61 in IN, #4,105 nationally) — a middle-class / working-renter tenant base. Strengths: crime A+, employment A+, cost of living A+; Watch: amenities F, commute F, health & safety F.
- Brownsburg Community School Corporation (suburban): math 72% / reading 72% proficiency, ranked #2 of 301 in IN (top 1%) — strong family-tenant draw, lease renewals of 3-5y typical; only 17% free/reduced lunch — higher-income household profile.
- Zoned schools: Brown Elementary School (math 79% / reading 72%, grade A, #15 of 994 statewide, top 2%, 765 students, 38% FRL); Brownsburg High School (math 61% / reading 83%, grade B+, #12 of 369 statewide, top 4%, 3,177 students, 33% FRL) — zoned schools average 35% FRL vs 17% district-wide (18 pts higher); higher-poverty schools than district average — tighter screening recommended.
- Market conditions: Rents rising fast (+6.3%/yr); 340 active listings in the ZIP; 6 comparable units currently listed for rent nearby; rentals at typical pace (median 24d on market — plan ~3-4 weeks tenant-placement turnaround); high-income renter base; 1,294 units permitted in Hendricks County in 2024 (18 in 5+ unit buildings).
Forward outlook
- Local home prices are declining (-3.0%/yr); year-one equity from $2k of loan paydown is wiped out by about $10k of value loss. Plan a longer hold.
- Hendricks County population projected at +35% by 2050 — long-run rental-demand tailwind backs the buy-and-hold thesis.
Negotiation context
- Only 2 days on market — expect competitive offers; lowballing is unlikely to land.
- 2 sale attempts since 12y ago with the ask held roughly flat each time — persistent listings suggest the price (not the market) is what's stuck; bring a comps-based counter.
- Current owner paid $168k; list at $330k implies a 96% gain — meaningful room to come down on a strong offer.
Questions for the listing agent
- What do current leases actually rent for vs. the listed asking? Can we see a recent rent roll and the last 12 months of T-12 income?
- What does the HOA fee cover, when was the last increase, and are there any pending special assessments or reserve-fund shortfalls?
- Is there a deadline driving the sale (1031 exchange, divorce, estate, relocation)? That informs how much negotiation room exists.
- Schools are A-rated — typically a magnet for longer-tenancy family renters. What's the average tenant stay here, and is there a school-zone premium baked into asking?
- The area grade is low — what's the realistic commute time and amenity access for the typical tenant pool here? Any planned neighborhood developments (good or bad) we should know about?
- What's the average days-on-market for RENTAL listings here right now (not sales)? A rising rental-DOM trend means longer vacancies and softer asking-rent achievability than the comps imply.
- What's the recent tenant-quality profile in this submarket — average credit score on applications, eviction rate, late-payment / NSF rate, and stable-employment percentage? A property-management company in the area should have these aggregated.
- How much new for-sale + rental construction is in the pipeline within 1–3 miles? Heavy new supply typically softens prices + rents 12–24 months out; constrained supply supports both.
Investment metrics
- 1% rule
- 0.75% ✗
- Cap rate
- 5.77%
- Cash-on-cash
- -1.85%
- DSCR
- 0.92
- GRM
- 11.2
CMA / ARV
- ARV (on-the-fly)
- $354,708
- Comps found
- 12
Show comp detail 12 sales within ~0.75 mi
| Address | Dist | Beds/Ba | Sqft | Sold | Price | $/sf | Match |
|---|---|---|---|---|---|---|---|
| 1045 Lakewood South Dr | 0.39mi | 4/3.0 | 2,212 (+4%) | 3mo | $375,000 | $170 | 70 |
| 321 S Odell St | 0.35mi | 3/1.5 (-1) | 2,216 (+4%) | 2mo | $250,000 | $113 | 66 |
| 609 Maple Ln | 0.25mi | 3/2.0 (-1) | 2,313 (+9%) | 4mo | $250,000 | $108 | 63 |
| 320 S Odell St | 0.37mi | 3/1.5 (-1) | 2,080 (-2%) | 9mo | $249,000 | $120 | 62 |
| 1108 Redwood Dr | 0.53mi | 3/2.5 (-1) | 1,982 (-7%) | 3mo | $330,000 | $166 | 57 |
| 27 Ashwood Cir | 0.34mi | 4/2.5 | 1,829 (-14%) | 8mo | $310,000 | $169 | 55 |
| 5 Roselawn Ave | 0.61mi | 3/2.0 (-1) | 2,059 (-3%) | 7mo | $350,000 | $170 | 54 |
| 17 Roselawn Ave | 0.50mi | 4/3.0 | 2,369 (+12%) | 3mo | $314,000 | $133 | 53 |
| 11 Daniel Cir | 0.71mi | 4/2.5 | 1,920 (-10%) | 1mo | $323,000 | $168 | 50 |
| 35 Fairwood Dr | 0.74mi | 4/2.5 | 2,262 (+6%) | 7mo | $377,000 | $167 | 48 |
| 323 N Odell St | 0.74mi | 5/3.0 (+1) | 2,253 (+6%) | 4mo | $360,000 | $160 | 45 |
| 1105 S Odell St | 0.54mi | 3/2.0 (-1) | 1,812 (-15%) | 0mo | $320,003 | $177 | 43 |
Match score weights: distance 35% · size 25% · config 20% · recency 20%. Top-matched comps best support the ARV.
Projected returns pro-forma
-3.0% appreciation · 6.31% rent growth · sell at horizon
- IRR
- -16.1%
- Equity multiple
- 0.41×
- Total profit
- $-54,160
- Equity at exit
- $49,189
- IRR
- -3.1%
- Equity multiple
- 0.76×
- Total profit
- $-21,993
- Equity at exit
- $28,524
Cash invested: $92,372 (down + closing). Projections, not guarantees.
Landlord ↔ Tenant lean methodology
- Overall (STATE)
- 90 Strongly Landlord-Friendly
- State Indiana
- 90 Strongly Landlord-Friendly · R+11
- County
- — inherits STATE
- City
- — inherits STATE
ZIP-level market 46112
- Rents YoY
- 6.3%
- Active inventory
- 340
- Price-to-rent
- 11.2×
Monthly cashflow live
- Estimated rent
- $2,462 high interval (Pro) →
- Mortgage (P&I)
- −$1,730
- Tax from tax record
- −$196 /mo · $2,350/yr
- Insurance
- −$137
- HOA
- −$24
- Vacancy / Maint / Mgmt
- −$517
- Net cashflow
- $-143
Break-even live
Sensitivity live
| Price | -10% $44 | -5% $-49 | +0% $-143 | +5% $-236 | +10% $-329 |
|---|---|---|---|---|---|
| Rent | -10% $-337 | -5% $-240 | +0% $-143 | +5% $-46 | +10% $52 |
| Rate | -1.0pp $23 | -0.5pp $-59 | base $-143 | +0.5pp $-228 | +1.0pp $-315 |
UW: 25.0% down · 7.5% · 30yr · 1.5% tax · 5.0% vac · 8.0% maint · 8.0% mgmt
Financing live
Cash to close
- Down payment
- $82,475
- Closing costs
- $9,897
- Reserves months
- —
- Total cash needed
- —
Loan-product check · same deal, 3 products live
Conventional
25% down · 7.5% · 30yr
- Down + closing
- —
- Monthly P&I
- —
- Monthly cashflow
- —
- DSCR
- —
- Eligible?
- —
Personal DTI + credit; lowest rate.
DSCR
20% down · 8.5% · 30yr
- Down + closing
- —
- Monthly P&I
- —
- Monthly cashflow
- —
- DSCR
- —
- Eligible?
- —
No personal income docs; deal must DSCR.
Hard money
10% down · 12.0% · 12mo
- Down + closing
- —
- Monthly P&I
- —
- Monthly cashflow
- —
- DSCR
- —
- Eligible?
- —
Short-term bridge; refi at stabilization.
Rent comps 6 comps
| Address | Beds | Baths | Sqft | Rent | $/sqft | DOM | Units | Dist |
|---|---|---|---|---|---|---|---|---|
| 28 Parkwood Dr Brownsburg, IN | 3.0 | 2.0 | 1422 | $1,760 | $1.24 | 19d | 1 | 0.52mi |
| 275 Lazy Hollow Dr Brownsburg, IN | 4.0 | 2.5 | 2190 | $2,571 | $1.17 | 45d | 1 | 0.71mi |
| 288 N Odell St Brownsburg, IN | 3.0 | 2.0 | 1408 | $2,000 | $1.42 | 0d | 1 | 0.72mi |
| 443 N Odell St Brownsburg, IN | 4.0 | 2.5 | 1984 | $2,391 | $1.21 | 24d | 1 | 0.82mi |
| 457 Sable Chase Brownsburg, IN | 3.0 | 2.0 | 1408 | $2,185 | $1.55 | 6d | 1 | 0.83mi |
| 460 Brookview Dr Brownsburg, IN | 4.0 | 2.5 | 2240 | $2,600 | $1.16 | 45d | 1 | 0.98mi |
HOA detail
- Monthly dues
- $24 · $288/yr
Listing history 2 events
-
2026-06-13remarks 699-char remark
-
2026-06-13$329,900 Pending 2 DOM
ⓘ Source: listings_history table (triggers on properties + properties_extension) + one-shot
backfill from property_details.listing_events for pre-trigger history.
Tax reassessment forecast IN · Partial reset (capped growth)
- Current annual tax
- $2,350 · $196/mo
- Projected year-2 tax
- $2,577 · $215/mo
- Expected delta
- +$227/yr (+$19/mo · 9.7%)
ⓘ Screening estimate from a state-policy table — verify with the county assessor before closing.
Climate risk First Street
- Flood 1/10 Low FEMA zone X (unshaded) · 0% chance over 30 yrs
- Wildfire 1/10 Low
- Heat 3/10 Moderate 7 d/yr ≥101°F today · 19 d/yr by 30 yrs out
- Wind 2/10 Low 0% chance of damaging wind over 30 yrs
- Air quality 2/10 Low 1 unhealthy d/yr today · 2 by 30 yrs out
Nearby sold comps map
Loading sold comps map…
Walkable amenities ~0.75 mi
Loading nearby amenities…
Taxation est. · year 1
- Rental income
- $29,538
- − Mortgage interest
- −$18,480
- − Property taxes
- −$2,350
- − Insurance
- −$1,650
- − Repairs & maintenance
- −$2,363
- − Management
- −$2,363
- − HOA
- −$288
- − Depreciation
- −$9,597
- Taxable loss
- −$7,552
- Est. tax savings @ 24.0%
- +$1,813
- After-tax cash flow
- $100/yr
For passive investors: Depreciation is non-cash, so a rental often shows a tax loss while cash-flowing — sheltering income. Rental losses are passive: they offset passive income freely, and up to $25,000/yr can offset ordinary (W-2) income if you actively participate and your MAGI is under $100k (phasing out to $0 by $150k); unused losses carry forward. On sale, claimed depreciation is recaptured at up to 25%, and gains may owe capital-gains tax (a 1031 exchange can defer both). Figures are a year-1 estimate at your 24.0% rate — not tax advice; consult a CPA.
Schools (NCES district)
- District
- Brownsburg Community School Corporation
- NCES district ID
- 1801020
- Math proficiency
- 72% ▼ -5.00%
- Reading proficiency
- 72% ▼ -4.00%
- Median HH income
- $75,304
- Composite
- 63.45/100
- National rank
- #616
- State rank
- #2 of 301 in IN
Livability — Brownsburg
- Score
- 75/100
- State rank
- #61
- US rank
- #4105
Category grades
Schools grade is shown separately in the Schools card above.
Census & demographics
- Census place
- Brownsburg, IN
- County
- Hendricks County · 143,373 people
- City population
- 44,220
- Metro
- Indianapolis-Carmel-Anderson, IN
- Population (ZIP)
- 44,220
- Household income
- $112,565
- Rent vs Own
- Severe rent burden
- 614.0
Population outlook (Hendricks County) Hauer SSP2
- Today (2025)
- 187,418 people
- By 2030
- 201,494 · +7.5%
- By 2040
- 228,487 · +21.9%
- By 2050
- 253,068 · +35.0%
- By 2075
- 308,920 · +64.8%
- By 2100
- 336,510 · +79.6%
Race, ethnicity, and origin ACS 2023
- Neighborhood character
- Predominantly White (83%)
- Race & ethnicity
- White 83% Black 10% Two or more races 4% Hispanic / Latino 4%
- Common ancestry
- Slovak 3% Iranian 2% Romanian 2%
- Foreign-born
- 6% · Canada, China
- Languages at home
- 93% English-only · Spanish 2% French/Haitian/Cajun 1%
Political lean MEDSL · Hendricks
- 2024 margin
- Strong R (+21.5) · D 38.4% · R 59.9% · Other 1.7%
- 2008→2024 swing
- +1.9pp toward D · 2008: -23.4pp · 2024: -21.5pp
- All cycles
- 2024: R+21.5 2020: R+23.9 2016: R+34.2 2012: R+34.9 2008: R+23.4
Not yet ingested
- Civics
- —
Market trends
- HPI YoY
- ▼ -135.99%
- Current HPI
- 217.3787
- Rent YoY
- ▲ 6.31%
- Metro
- Indianapolis-Carmel-Anderson, IN
- State GDP YoY
- ▲ 2.90%
- F500 in state
- 18
Industry mix (Fortune 500 HQ in IN)
| Industry | F500 HQs | Revenue |
|---|---|---|
| Industrial Machinery | 2 | $37B |
|
||
| Healthcare | 1 | $177B |
|
||
| Pharmaceuticals | 1 | $45B |
|
||
| Metals / Steel | 1 | $18B |
|
||
| Agriculture | 1 | $17B |
|
||
| Packaging | 1 | $12B |
|
||
Price history
+96.5% since first listed5 events — show timeline
- 2026-06-13 Pending — MIBOR as Distributed by MLS Grid
- 2026-06-10 Listed $329,900 MIBOR as Distributed by MLS Grid
- 2014-07-01 Listing Removed — MIBOR as Distributed by MLS Grid
- 2014-06-30 Sold (MLS) $167,900 MIBOR as Distributed by MLS Grid
- 2014-04-28 Listed $167,900 MIBOR as Distributed by MLS Grid
Property tax history
+4.9%/yrLatest (2025): $2,350 · +7.5% YoY. Source: county tax records.
Cash-flow waterfall
monthlySold comps — $/sqft
last 12 mo · ≤1 miLoading sold comps…