 Fourplex
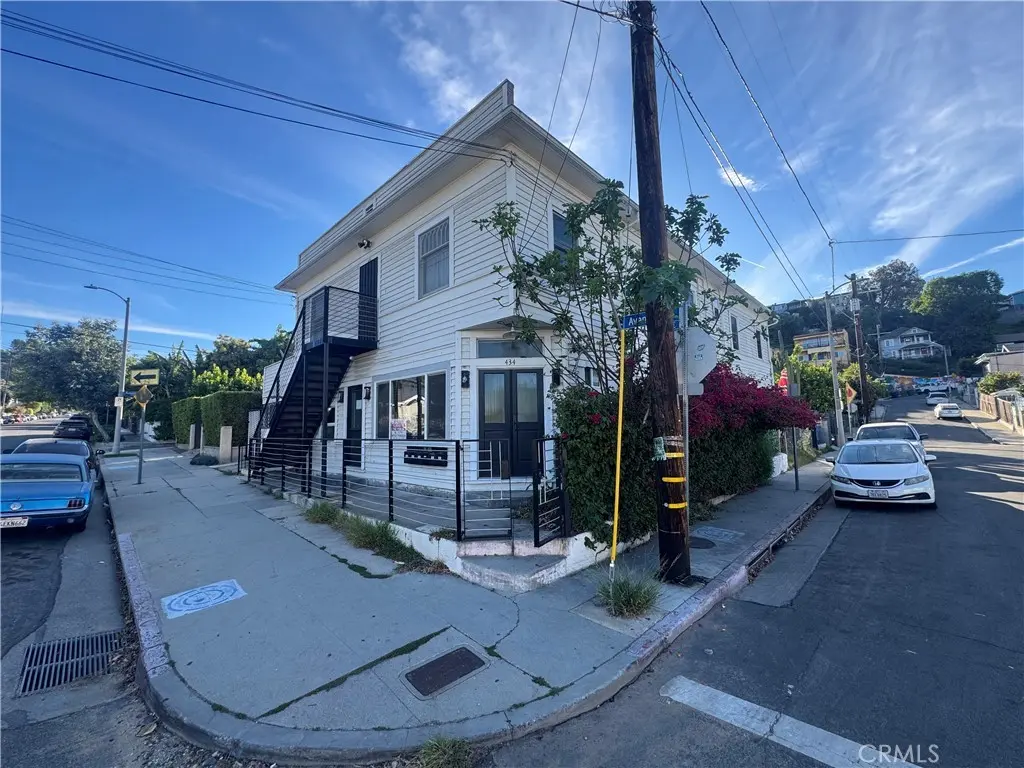
434 E Avenue 28 · Los Angeles, CA
Flood risk 4/10 · Minor
- FEMA flood zone
- X (unshaded)
- Chance of flooding over 30 yrs
- 0.22%
- Est. flood insurance / yr
- $507 – $1,088
Fire risk 1/10 · Minimal
- Est. fire insurance / yr
- $659 – $1,223
Heat risk 6/10 · Moderate
- Hot days now (above 96°F)
- 7 days/yr
- Hot days in 30 yrs
- 21 days/yr
Wind risk 1/10 · Minimal
- Chance of severe wind over 30 yrs
- —
Air-quality risk 6/10 · Moderate
- Unhealthy air days now
- 11 days/yr
- Unhealthy air days in 30 yrs
- 12 days/yr
Risk factors via First Street. Map © Google.
Why this score? — see what drove the C+ grade
The composite is a weighted blend of 9 inputs, each scored 0–100. Each bar is that input's sub-score; the figure is the points it added to the 100-point composite (weight × sub-score).
- Cash flow +29.8/30.0
- DSCR +10.0/10.0
- 1% rule +7.9/10.0
- Rent growth +3.8/5.0
- Schools +3.6/10.0
- Livability +3.4/5.0
- Condition / age +2.5/5.0
- ARV discount +0.0/15.0
- Appreciation +0.0/10.0
$1,125,000
🖨 Deal sheet (PDF) 📄 Offer letter ✓ Due diligence
Multi-family units
County records classify this as Multi-Family (2-4 Unit). Listing-text estimate: 4 units. confirmed
Listing remarks MLS
Multi-family investment opportunity in the heart of Lincoln Heights. This 2-story, 4-unit building sits on a 3,770 SF corner lot zoned LARD3 and offers strong value-add potential for experienced investors. Originally constructed in 1911, the property features approximately 4,307 SF of building area with 5 bedrooms and 4 bathrooms across four assessor-recognized units. Centrally located with excellent freeway access via the 110 and I-5, the property is minutes from Downtown Los Angeles, Lincoln Park, and the rapidly revitalizing Lincoln Heights commercial corridor along North Broadway. The neighborhood continues to attract investment as Northeast LA experiences sustained demand for multi-family housing. Property is sold strictly as-is. Subject to existing tenancies. Buyer to independently verify all unit configurations, permits, zoning compliance, and code status. Will likely will require a cash sale, as financing may not be possible.
Key facts
- Zoned lard3
- Centrally located
- Corner lot
Tags
Neighborhood map
What this means for you Summary
Snapshot
- This is a 4 × 5-bed/4-bath units multifamily listed at $1.12M.
Deal economics
- At list price, monthly cash flow is $4k ($50k/yr) — positive. Per door: $1k/mo.
- The deal already cash-flows at list — no discount required.
- Meets the 1% rule at list price ($15k rent vs $1.12M).
- Recommended offer: $1.02M (9.0% below list) — sets the bar for market timing.
- Cap rate 10.7% vs local median 2.1% in Los Angeles — top-decile yield for the area; either an underpriced asset or a hidden risk that comps aren't pricing in. Stress-test before assuming the spread holds.
Location & tenants
- Location reads 68/100 on livability (#273 in CA) — a middle-class / working-renter tenant base. Strengths: amenities A+, commute A+, employment B; Watch: health & safety C-, crime F, cost of living F.
- Los Angeles Unified (urban): math 29% / reading 54% proficiency, ranked #223 of 517 in CA (top 43%) — families likely to look elsewhere, expect single-tenant / working-renter base with shorter leases; 67% free/reduced lunch — lower-income household profile, screen leases tightly.
- Zoned schools: Hillside Elementary (105 students, 95% FRL); Florence Nightingale Middle (790 students, 93% FRL); Woodrow Wilson Senior High (math 23% / reading 59%, grade F, #502 of 1,170 statewide, top 43%, 1,406 students, 93% FRL) — zoned schools average 94% FRL vs 67% district-wide (26 pts higher); higher-poverty schools than district average — tighter screening recommended.
- Market conditions: Rents rising fast (+5.1%/yr); 126 active listings in the ZIP; 1 comparable units currently listed for rent nearby; 19,697 units permitted in Los Angeles County in 2024 (9,426 in 5+ unit buildings).
Forward outlook
- Local home prices are declining (-3.0%/yr); year-one equity from $8k of loan paydown is wiped out by about $34k of value loss. Plan a longer hold.
- Los Angeles County population projected at +9% by 2050 — modest demand growth; plan on rents tracking national, not racing it.
- At projected returns (-3.0% appreciation + 5.1% rent growth), your $315k cash investment doubles in ~7 years — after that, you're playing with house money.
Negotiation context
- It's been on market 94 days — a 9% lower offer ($1.02M) is reasonable based on typical stale-listing flexibility.
- 2 sale attempts since 8y ago with the ask held roughly flat each time — persistent listings suggest the price (not the market) is what's stuck; bring a comps-based counter.
- Current owner paid $855k; 32% above their basis — modest negotiation headroom, anchor on the comps not their cost.
Risks & watch-outs
- Watch-outs: built in 1911 — expect roof / HVAC / electrical / plumbing capex.
- Climate carrying-cost: extreme-heat days projected 7→21/yr by 2055 (HVAC capex compounding) — expect insurance premiums to compound above CPI over the hold.
Questions for the listing agent
- It's been on market 94 days. Have you received any prior offers? Is the seller open to a 9% concession, seller financing, or rate buy-down credit?
- Can we see the unit-by-unit rent roll, current vacancy, and any below-market leases? What's the average tenancy length?
- What capital expenditures (roof, boiler, parking lot, exteriors) have been made in the last 5 years, and what's planned in the next 2?
- Built in 1911 — when were the roof, HVAC, electrical panel, plumbing, and water heater last replaced?
- Why hasn't it sold? Are there any deal-killer items the seller is aware of (foundation, flood, title, zoning, code violations)?
- Is there a deadline driving the sale (1031 exchange, divorce, estate, relocation)? That informs how much negotiation room exists.
- Schools are D-rated, which usually means shorter tenancies and higher turnover. Who's the typical renter profile here, and what's been the actual vacancy rate?
- Crime grade is F in this area — have there been break-ins, vandalism, or insurance claims at this property in the last 3 years? What carrier currently insures it and at what premium?
- What's the average days-on-market for RENTAL listings here right now (not sales)? A rising rental-DOM trend means longer vacancies and softer asking-rent achievability than the comps imply.
- What's the recent tenant-quality profile in this submarket — average credit score on applications, eviction rate, late-payment / NSF rate, and stable-employment percentage? A property-management company in the area should have these aggregated.
- How much new apartment / multifamily construction is in the pipeline within 1–3 miles? Heavy new supply (>2% of stock underway) typically softens rents 12–24 months out; light construction supports rent growth.
Investment metrics
- 1% rule
- 1.29% ✓
- Cap rate
- 10.71%
- Cash-on-cash
- 15.77%
- DSCR
- 1.70
- GRM
- 6.4
CMA / ARV
- ARV (median comp)
- $939,627
- List price
- $1,125,000
- Delta
- 19.73%
- Verdict
- OVERPRICED
- Comps
- 11 within 1.0 mi
Projected returns pro-forma
-3.0% appreciation · 5.11% rent growth · sell at horizon
- IRR
- 8.9%
- Equity multiple
- 1.36×
- Total profit
- $112,880
- Equity at exit
- $167,741
- IRR
- 19.8%
- Equity multiple
- 2.82×
- Total profit
- $572,884
- Equity at exit
- $97,269
Cash invested: $315,000 (down + closing). Projections, not guarantees.
Landlord ↔ Tenant lean methodology
- Overall (CITY)
- 0 Strongly Tenant-Friendly
- State California
- 18 Strongly Tenant-Friendly · D+13
- County
- — inherits STATE
- City Los Angeles
- 0 Strongly Tenant-Friendly · D+22
ZIP-level market 90031
- Rents YoY
- 5.1%
- Active inventory
- 126
- Price-to-rent
- 25.8×
Monthly cashflow live
- Estimated rent
- $14,561 medium interval (Pro) →
- Mortgage (P&I)
- −$5,900
- Tax from tax record
- −$995 /mo · $11,943/yr
- Insurance
- −$469
- HOA
- −$0
- Vacancy / Maint / Mgmt
- −$3,058
- Net cashflow
- $4,140
Break-even live
Sensitivity live
| Price | -10% $4,776 | -5% $4,458 | +0% $4,140 | +5% $3,821 | +10% $3,503 |
|---|---|---|---|---|---|
| Rent | -10% $2,989 | -5% $3,564 | +0% $4,140 | +5% $4,715 | +10% $5,290 |
| Rate | -1.0pp $4,706 | -0.5pp $4,426 | base $4,140 | +0.5pp $3,848 | +1.0pp $3,551 |
4-unit breakdown (identical units grouped — click to expand)
| Units | Beds | Baths | Est. rent |
|---|---|---|---|
| 4× units | 5 | 4 | $14,560 |
| #1 | 5 | 4 | $3,640 |
| #2 | 5 | 4 | $3,640 |
| #3 | 5 | 4 | $3,640 |
| #4 | 5 | 4 | $3,640 |
| Total (4 units) | $14,561 | ||
UW: 25.0% down · 7.5% · 30yr · 1.5% tax · 5.0% vac · 8.0% maint · 8.0% mgmt
Financing live
Cash to close
- Down payment
- $281,250
- Closing costs
- $33,750
- Reserves months
- —
- Total cash needed
- —
Loan-product check · same deal, 3 products live
Conventional
25% down · 7.5% · 30yr
- Down + closing
- —
- Monthly P&I
- —
- Monthly cashflow
- —
- DSCR
- —
- Eligible?
- —
Personal DTI + credit; lowest rate.
DSCR
20% down · 8.5% · 30yr
- Down + closing
- —
- Monthly P&I
- —
- Monthly cashflow
- —
- DSCR
- —
- Eligible?
- —
No personal income docs; deal must DSCR.
Hard money
10% down · 12.0% · 12mo
- Down + closing
- —
- Monthly P&I
- —
- Monthly cashflow
- —
- DSCR
- —
- Eligible?
- —
Short-term bridge; refi at stabilization.
Rent comps 1 comps
| Address | Beds | Baths | Sqft | Rent | $/sqft | DOM | Units | Dist |
|---|---|---|---|---|---|---|---|---|
| 2015 N Mission Rd Los Angeles, CA | 4.0 | 1.0 | 5000 | $2,560 | $0.51 | 46d | 1 | 0.94mi |
Listing history 19 events
-
2026-06-21days on market $1,125,000 Active 94 DOM
-
2026-06-18days on market $1,125,000 Active 91 DOM
-
2026-06-17days on market $1,125,000 Active 90 DOM
-
2026-06-16days on market $1,125,000 Active 89 DOM
-
2026-06-15days on market $1,125,000 Active 88 DOM
-
2026-06-13days on market $1,125,000 Active 86 DOM
-
2026-06-09days on market $1,125,000 Active 82 DOM
-
2026-06-08days on market $1,125,000 Active 81 DOM
-
2026-06-07days on market $1,125,000 Active 80 DOM
-
2026-06-04days on market $1,125,000 Active 77 DOM
-
2026-06-03days on market $1,125,000 Active 76 DOM
-
2026-06-02days on market $1,125,000 Active 75 DOM
-
2026-06-01days on market $1,125,000 Active 74 DOM
-
2026-05-31days on market $1,125,000 Active 73 DOM
-
2026-03-19$1,125,000 Active 947-char remark
Show marketing remark (947 chars)
Multi-family investment opportunity in the heart of Lincoln Heights. This 2-story, 4-unit building sits on a 3,770 SF corner lot zoned LARD3 and offers strong value-add potential for experienced investors. Originally constructed in 1911, the property features approximately 4,307 SF of building area with 5 bedrooms and 4 bathrooms across four assessor-recognized units. Centrally located with excellent freeway access via the 110 and I-5, the property is minutes from Downtown Los Angeles, Lincoln Park, and the rapidly revitalizing Lincoln Heights commercial corridor along North Broadway. The neighborhood continues to attract investment as Northeast LA experiences sustained demand for multi-family housing. Property is sold strictly as-is. Subject to existing tenancies. Buyer to independently verify all unit configurations, permits, zoning compliance, and code status. Will likely will require a cash sale, as financing may not be possible.
-
2018-10-30soldstatus $855,000 402-char remark
Show marketing remark (402 chars)
Residential income property. 5 units in building. Each has own meter for gas and electric. Two 2-BR/1Bath units, Two 1-BR/1Bath units. 5th unit currently being used for storage (use to be store originally), but is large unit and has 1 bath, kitchen area and two additional rooms (need to check with city if the unit can be used as legal residential rental). Now storage so no rent control on this unit.
-
2018-10-30soldstatus $855,000
Show marketing remark (402 chars)
Residential income property. 5 units in building. Each has own meter for gas and electric. Two 2-BR/1Bath units, Two 1-BR/1Bath units. 5th unit currently being used for storage (use to be store originally), but is large unit and has 1 bath, kitchen area and two additional rooms (need to check with city if the unit can be used as legal residential rental). Now storage so no rent control on this unit.
-
2018-06-13$799,000
ⓘ Source: listings_history table (triggers on properties + properties_extension) + one-shot
backfill from property_details.listing_events for pre-trigger history.
Tax reassessment forecast CA · Resets to sale price
- Current annual tax
- $11,943 · $995/mo
- Projected year-2 tax
- $11,943 · $995/mo
- Expected delta
- $0/yr ($0/mo · 0.0%)
ⓘ Screening estimate from a state-policy table — verify with the county assessor before closing.
Climate risk First Street
- Flood 4/10 Moderate FEMA zone X (unshaded) · 22% chance over 30 yrs
- Wildfire 1/10 Low
- Heat 6/10 Major 7 d/yr ≥96°F today · 21 d/yr by 30 yrs out
- Wind 1/10 Low
- Air quality 6/10 Major 11 unhealthy d/yr today · 12 by 30 yrs out
Nearby sold comps map
Loading sold comps map…
Walkable amenities ~0.75 mi
Loading nearby amenities…
Taxation est. · year 1
- Rental income
- $174,732
- − Mortgage interest
- −$63,017
- − Property taxes
- −$11,943
- − Insurance
- −$5,625
- − Repairs & maintenance
- −$13,979
- − Management
- −$13,979
- − Depreciation
- −$32,727
- Taxable income
- $33,462
- Est. tax owed @ 24.0%
- −$8,031
- After-tax cash flow
- $41,644/yr
For passive investors: Depreciation is non-cash, so a rental often shows a tax loss while cash-flowing — sheltering income. Rental losses are passive: they offset passive income freely, and up to $25,000/yr can offset ordinary (W-2) income if you actively participate and your MAGI is under $100k (phasing out to $0 by $150k); unused losses carry forward. On sale, claimed depreciation is recaptured at up to 25%, and gains may owe capital-gains tax (a 1031 exchange can defer both). Figures are a year-1 estimate at your 24.0% rate — not tax advice; consult a CPA.
Schools (NCES district)
- District
- Los Angeles Unified
- NCES district ID
- 0622710
- Math proficiency
- 29% ▼ -4.00%
- Reading proficiency
- 54% ▲ 10.00%
- Median HH income
- $50,403
- Composite
- 35.67/100
- National rank
- #4875
- State rank
- #223 of 517 in CA
Livability — Los Angeles
- Score
- 68/100
- State rank
- #273
- US rank
- #9237
Category grades
Schools grade is shown separately in the Schools card above.
Census & demographics
- Census place
- Los Angeles, CA
- County
- Los Angeles County · 9,444,647 people
- City population
- 3,838,149
- Metro
- Los Angeles-Long Beach-Anaheim, CA
- Population (ZIP)
- 36,127
- Household income
- $63,090
- Rent vs Own
- Severe rent burden
- 2683.0
Population outlook (Los Angeles County) Hauer SSP2
- Today (2025)
- 10,940,515 people
- By 2030
- 11,256,481 · +2.9%
- By 2040
- 11,729,929 · +7.2%
- By 2050
- 11,948,407 · +9.2%
- By 2075
- 11,818,114 · +8.0%
- By 2100
- 10,842,928 · -0.9%
Race, ethnicity, and origin ACS 2023
- Neighborhood character
- Diverse neighborhood (Simpson 0.57)
- Race & ethnicity
- Hispanic / Latino 57% Asian 29% Two or more races 11% White 9% Native American 2% Black 2%
- Hispanic origin (detail)
- Mexican 40%
- Common ancestry
- Italian 1% Slovak 1%
- Foreign-born
- 46% · Canada, China, Vietnam
- Languages at home
- 26% English-only · Spanish 48% Chinese 14% Other Asian/Pacific 3%
Political lean MEDSL · Los Angeles
- 2024 margin
- Solid D (+32.9) · D 64.8% · R 31.9% · Other 3.3%
- 2008→2024 swing
- -7.4pp toward R · 2008: 40.4pp · 2024: 32.9pp
- All cycles
- 2024: D+32.9 2020: D+44.2 2016: D+48.0 2012: D+40.0 2008: D+40.4
Not yet ingested
- Civics
- —
Market trends
- HPI YoY
- ▼ -762.68%
- Current HPI
- 523.6412
- Rent YoY
- ▲ 5.11%
- Metro
- Los Angeles-Long Beach-Anaheim, CA
- State GDP YoY
- ▲ 3.21%
- F500 in state
- 116
Industry mix (Fortune 500 HQ in CA)
| Industry | F500 HQs | Revenue |
|---|---|---|
| Technology | 27 | $1,492B |
|
||
| Financial Services | 3 | $174B |
|
||
| Retail | 3 | $44B |
|
||
| Insurance | 3 | $26B |
|
||
| Media / Entertainment | 2 | $115B |
|
||
| Pharmaceuticals / Biotech | 2 | $62B |
|
||
Price history
+40.8% since first listed5 events — show timeline
- 2026-03-19 Listed $1,125,000 CRMLS
- 2018-10-30 Sold (Public Records) $855,000 Public Records
- 2018-10-30 Sold (MLS) $855,000 SDMLS
- 2018-10-30 Sold (MLS) $855,000 CRMLS
- 2018-06-13 Listed $799,000 SDMLS
Property tax history
+14.6%/yrLatest (2025): $11,943 · +1.6% YoY. Source: county tax records.
Cash-flow waterfall
monthlySold comps — $/sqft
last 12 mo · ≤1 miLoading sold comps…