6306 Election Ln · Sacramento, CA
Flood risk 1/10 · Minimal
- FEMA flood zone
- X (shaded)
- Chance of flooding over 30 yrs
- 0.0%
- Est. flood insurance / yr
- $507 – $1,088
Fire risk 1/10 · Minimal
- Est. fire insurance / yr
- $659 – $1,223
Heat risk 7/10 · Major
- Hot days now (above 102°F)
- 7 days/yr
- Hot days in 30 yrs
- 15 days/yr
Wind risk 1/10 · Minimal
- Chance of severe wind over 30 yrs
- —
Air-quality risk 10/10 · Severe
- Unhealthy air days now
- 28 days/yr
- Unhealthy air days in 30 yrs
- 33 days/yr
Risk factors via First Street. Map © Google.
Why this score? — see what drove the B grade
The composite is a weighted blend of 9 inputs, each scored 0–100. Each bar is that input's sub-score; the figure is the points it added to the 100-point composite (weight × sub-score).
- Cash flow +30.0/30.0
- ARV discount +10.8/15.0
- 1% rule +10.0/10.0
- DSCR +10.0/10.0
- Livability +3.6/5.0
- Schools +3.5/10.0
- Condition / age +2.5/5.0
- Rent growth +2.4/5.0
- Appreciation +1.3/10.0
$119,990
🖨 Deal sheet 📄 Offer letter ✓ Due diligence
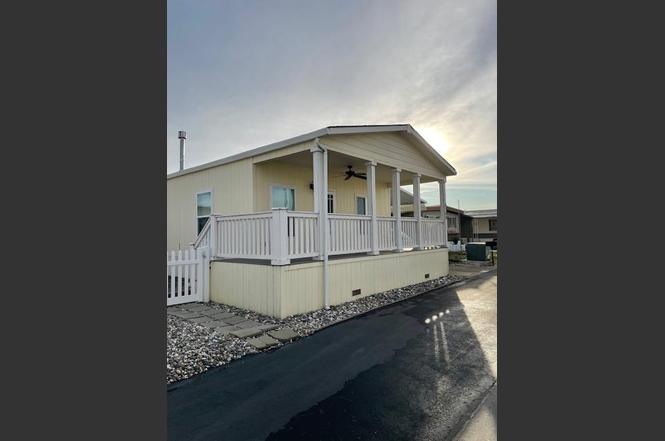
Listing remarks
Welcome to family friendly Capital Estates. This 3-bedroom, 2-bath home offers 1,296 sq ft with an open great room floor plan, 9' ceilings, recessed lighting, and a cozy gas fireplace. Kitchen features quartz countertops, tile backsplash, deep sink, and upgraded appliances. Vinyl plank flooring throughout, dual-pane windows, central HVAC, and separate laundry area. Exterior includes a tandem driveway with covered awning, redwood deck, covered front porch, Tuff Shed with shelving, and private garden area. The community offers beautiful landscaping and amenities including clubhouse (with kitchen), swimming pool, billiards, basketball court and dog park.
Key facts
- Cozy gas fireplace
- Quartz countertops
- Dual-pane windows
Tags
Property features AI
Finance
- Other: Located in Capital Estates Park (gated community access directions available)
- HOA & community: No homeowners association; Not a senior community; Land lease: No (land lease amount listed separately)
Exterior
- Parking: Attached covered parking
- Utilities: Natural gas connected; Public water; Public sewer; 220 volts in laundry
- Home design: Manufactured in park, double wide; Original condition; Built in 2016
- Construction: Wood skirting; Other roof type; Karston make
- Exterior features: Carport awning; Shed(s)
Interior
- Kitchen: Free standing gas range; Free standing refrigerator; Dishwasher; Microwave; Disposal; Breakfast area; Kitchen island
- Bedrooms: 3 bedrooms (including master bedroom)
- Flooring: Laminate flooring
- Bathrooms: 2 full bathrooms with double sinks, tub and shower stall(s)
- Heating & cooling: Central heating; Fireplace(s); Central air conditioning; Ceiling fans
- Interior features: Covered deck and porch; Skylights in kitchen and family room; Stone countertops; Deck attached to living room and family room; Window coverings, dual-pane windows; Pets allowed (size limits)
- Laundry & utility: Washer and dryer included; 220V outlet in laundry
Neighborhood map
What this means for you Summary
Snapshot
- This is a 3-bed/2.0-bath manufactured listed at $120k.
Deal economics
- At list price, monthly cash flow is $1k ($13k/yr) — positive.
- The deal already cash-flows at list — no discount required.
- Meets the 1% rule at list price ($2k rent vs $120k).
- Cap rate 17.1% vs local median 3.0% in Sacramento — top-decile yield for the area; either an underpriced asset or a hidden risk that comps aren't pricing in. Stress-test before assuming the spread holds.
Location & tenants
- Location reads 71/100 on livability (#218 in CA) — a middle-class / working-renter tenant base. Strengths: amenities A+, commute A+, housing A; Watch: schools D+, crime F, cost of living F.
- Sacramento City Unified (urban): math 32% / reading 43% proficiency, ranked #804 of 1,400 in CA (top 57%) — families likely to look elsewhere, expect single-tenant / working-renter base with shorter leases; 63% free/reduced lunch — lower-income household profile, screen leases tightly.
- Market conditions: Rents soft (-0.2%/yr); 212 active listings in the ZIP; 28 comparable units currently listed for rent nearby; rentals at typical pace (median 24d on market — plan ~3-4 weeks tenant-placement turnaround); solid renter incomes; 6,825 units permitted in Sacramento County in 2024 (1,752 in 5+ unit buildings).
- This rent runs 35% of the median local income ($82k/yr) — at the standard rent-burdened threshold; future hikes will face affordability resistance.
Forward outlook
- Local home prices are declining (-3.0%/yr); year-one equity from $830 of loan paydown is wiped out by about $4k of value loss. Plan a longer hold.
- Sacramento County population projected at +17% by 2050 — long-run rental-demand tailwind backs the buy-and-hold thesis.
- At projected returns (-3.0% appreciation + 0.0% rent growth), your $34k cash investment doubles in ~4 years — after that, you're playing with house money.
Negotiation context
- Only 8 days on market — expect competitive offers; lowballing is unlikely to land.
Risks & watch-outs
- Climate carrying-cost: extreme-heat days projected 7→15/yr by 2055 (HVAC capex compounding) — expect insurance premiums to compound above CPI over the hold.
Questions for the listing agent
- Is there a deadline driving the sale (1031 exchange, divorce, estate, relocation)? That informs how much negotiation room exists.
- Schools are D-rated, which usually means shorter tenancies and higher turnover. Who's the typical renter profile here, and what's been the actual vacancy rate?
- Crime grade is F in this area — have there been break-ins, vandalism, or insurance claims at this property in the last 3 years? What carrier currently insures it and at what premium?
- What's the average days-on-market for RENTAL listings here right now (not sales)? A rising rental-DOM trend means longer vacancies and softer asking-rent achievability than the comps imply.
- What's the recent tenant-quality profile in this submarket — average credit score on applications, eviction rate, late-payment / NSF rate, and stable-employment percentage? A property-management company in the area should have these aggregated.
- How much new for-sale + rental construction is in the pipeline within 1–3 miles? Heavy new supply typically softens prices + rents 12–24 months out; constrained supply supports both.
Investment metrics
- 1% rule
- 1.98% ✓
- Cap rate
- 17.12%
- Cash-on-cash
- 38.68%
- DSCR
- 2.72
- GRM
- 4.2
CMA / ARV
- ARV (on-the-fly)
- $129,600
- Comps found
- 10
Show comp detail 10 sales within ~0.75 mi
| Address | Dist | Beds/Ba | Sqft | Sold | Price | $/sf | Match |
|---|---|---|---|---|---|---|---|
| 6311 Election Ln | 0.03mi | 2/2.0 (-1) | 1,344 (+4%) | 12mo | $135,000 | $100 | 78 |
| 6307 State Ln #90 | 0.08mi | 2/2.0 (-1) | 1,248 (-4%) | 12mo | $170,000 | $136 | 75 |
| 6205 Presidential Ln #135 | 0.11mi | 2/2.0 (-1) | 1,254 (-3%) | 16mo | $75,000 | $60 | 72 |
| 6800 Capital Cir | 0.16mi | 2/2.0 (-1) | 1,152 (-11%) | 0mo | $120,000 | $104 | 69 |
| 6719 Representative Way #166 | 0.11mi | 2/2.0 (-1) | 1,440 (+11%) | 6mo | $140,000 | $97 | 66 |
| 6827 Capital Cir #203 | 0.16mi | 2/2.0 (-1) | 1,440 (+11%) | 4mo | $81,000 | $56 | 65 |
| 6713 Representative Way #169 | 0.09mi | 2/2.0 (-1) | 1,440 (+11%) | 8mo | $109,000 | $76 | 65 |
| 6309 Senator #44 | 0.20mi | 4/2.0 (+1) | 1,344 (+4%) | 22mo | $140,000 | $104 | 62 |
| 6201 Presidential Ln #137 | 0.13mi | 3/2.0 | 1,120 (-14%) | 12mo | $128,000 | $114 | 61 |
| 6815 Capital Cir #209 | 0.18mi | 2/2.0 (-1) | 1,440 (+11%) | 18mo | $118,900 | $83 | 53 |
Match score weights: distance 35% · size 25% · config 20% · recency 20%. Top-matched comps best support the ARV.
Projected returns pro-forma
-3.0% appreciation · 0.0% rent growth · sell at horizon
- IRR
- 31.5%
- Equity multiple
- 2.27×
- Total profit
- $42,584
- Equity at exit
- $17,891
- IRR
- 36.9%
- Equity multiple
- 3.95×
- Total profit
- $99,050
- Equity at exit
- $10,375
Cash invested: $33,597 (down + closing). Projections, not guarantees.
Landlord ↔ Tenant lean methodology
- Overall (STATE)
- 18 Strongly Tenant-Friendly
- State California
- 18 Strongly Tenant-Friendly · D+13
- County
- — inherits STATE
- City
- — inherits STATE
ZIP-level market 95828
- Home prices YoY
- -0.8%
- Rents YoY
- -0.2%
- Active inventory
- 212
- Price-to-rent
- 4.2×
Monthly cashflow live
- Estimated rent
- $2,376 high interval (Pro) →
- Mortgage (P&I)
- −$629
- Tax from tax record
- −$115 /mo · $1,375/yr
- Insurance
- −$50
- HOA
- −$0
- Vacancy / Maint / Mgmt
- −$499
- Net cashflow
- $1,083
Break-even live
UW: 25.0% down · 7.5% · 30yr · 1.5% tax · 5.0% vac · 8.0% maint · 8.0% mgmt
Financing live
Cash to close
- Down payment
- $29,998
- Closing costs
- $3,600
- Reserves months
- —
- Total cash needed
- —
Loan-product check · same deal, 3 products live
Conventional
25% down · 7.5% · 30yr
- Down + closing
- —
- Monthly P&I
- —
- Monthly cashflow
- —
- DSCR
- —
- Eligible?
- —
Personal DTI + credit; lowest rate.
DSCR
20% down · 8.5% · 30yr
- Down + closing
- —
- Monthly P&I
- —
- Monthly cashflow
- —
- DSCR
- —
- Eligible?
- —
No personal income docs; deal must DSCR.
Hard money
10% down · 12.0% · 12mo
- Down + closing
- —
- Monthly P&I
- —
- Monthly cashflow
- —
- DSCR
- —
- Eligible?
- —
Short-term bridge; refi at stabilization.
Rent comps 28 comps
| Address | Beds | Baths | Sqft | Rent | $/sqft | DOM | Units | Dist |
|---|---|---|---|---|---|---|---|---|
| 6824 Mangosteen Ln Sacramento, CA | 3.0 | 2.5 | 1404 | $2,245 | $1.60 | 7d | 1 | 0.24mi |
| 6782 Jujube Ln Sacramento, CA | 4.0 | 2.5 | 1668 | $2,395 | $1.44 | 7d | 1 | 0.25mi |
| 6475 Stockton Blvd Sacramento, CA | 2.0 | 2.0 | 988 | $2,600 | $2.63 | 19d | 1 | 0.38mi |
| 6470 Stockton Blvd Sacramento, CA | 1.0–2.0 | 1.0–2.0 | 856 | $1,845 | $2.16 | 43d | 2 | 0.46mi |
| 6519 Prentiss Dr Sacramento, CA | 3.0 | 2.0 | 1029 | $2,300 | $2.24 | 12d | 1 | 0.69mi |
| 5934 69th St Sacramento, CA | 3.0 | 1.0 | 1091 | $1,995 | $1.83 | 3d | 1 | 0.84mi |
| 5400 53rd Ave Sacramento, CA | 4.0 | 2.5 | 1274 | $2,450 | $1.92 | 23d | 1 | 0.85mi |
| 7140 Chris Ave Sacramento, CA | 2.0 | 1.0 | 1248 | $2,300 | $1.84 | 43d | 1 | 0.96mi |
| 7252 Florin Mall Dr Unit 7252 Sacramento, CA | 2.0 | 2.0 | 900 | $1,725 | $1.92 | 43d | 1 | 0.96mi |
| 7283 Florin Mall Dr #14 Sacramento, CA | 2.0 | 2.0 | 902 | $1,675 | $1.86 | 43d | 1 | 1.01mi |
| 7421 Conrad Dr Sacramento, CA | 4.0 | 2.0 | 1442 | $2,595 | $1.80 | 7d | 1 | 1.02mi |
| 4911 50th Ave Unit 11 Sacramento, CA | 2.0 | 2.0 | 875 | $1,660 | $1.90 | 23d | 1 | 1.03mi |
| 5500 38th Ave Sacramento, CA | 3.0 | 1.0 | 1100 | $2,100 | $1.91 | 43d | 1 | 1.04mi |
| 6053 36th Ave Sacramento, CA | 3.0 | 1.0 | 1166 | $2,600 | $2.23 | 43d | 1 | 1.08mi |
| 5834 55th St Sacramento, CA | 3.0 | 1.0 | 1027 | $2,100 | $2.04 | 16d | 1 | 1.11mi |
| 5885 Wilkinson St Sacramento, CA | 3.0 | 2.0 | 1368 | $2,399 | $1.75 | 43d | 1 | 1.17mi |
| 4913 Sky Pkwy Sacramento, CA | 3.0 | 2.0 | 1456 | $2,200 | $1.51 | 43d | 1 | 1.20mi |
| 5936 Clover Manor Way Sacramento, CA | 3.0 | 2.0 | 1345 | $2,400 | $1.78 | 43d | 1 | 1.28mi |
| 5905 Clover Manor Way Unit 5907 CLOVER Sacramento, CA | 3.0 | 1.0 | 1000 | $2,000 | $2.00 | 2d | 1 | 1.31mi |
| 5544 33rd Ave Unit NA Sacramento, CA | 2.0 | 1.0 | 1200 | $2,250 | $1.88 | 7d | 1 | 1.31mi |
| 5316 Nelson St Sacramento, CA | 3.0 | 2.0 | 1018 | $2,245 | $2.21 | 12d | 1 | 1.36mi |
| 5988 Sampson Blvd Sacramento, CA | 2.0 | 1.0 | 1025 | $2,125 | $2.07 | 23d | 1 | 1.38mi |
| 5701 Fruitridge Rd Sacramento, CA | 2.0 | 1.0 | 875 | $1,495 | $1.71 | 43d | 1 | 1.39mi |
| 5321 57th St Sacramento, CA | 4.0 | 2.0 | 1248 | $2,399 | $1.92 | 43d | 1 | 1.46mi |
| 4812 D Pkwy Sacramento, CA | 3.0 | 1.5 | 1505 | $2,295 | $1.52 | 23d | 1 | 1.47mi |
| 7238 East Pkwy Apt B5 Sacramento, CA | 2.0 | 1.5 | 1020 | $1,645 | $1.61 | 7d | 1 | 1.49mi |
| 7236 East Pkwy Sacramento, CA | 2.0 | 1.0–1.5 | 776 | $1,645 | $2.12 | 2d | 1 | 1.49mi |
| 7351 Gigi Pl Unit 7353 Sacramento, CA | 2.0 | 1.0 | 1000 | $1,775 | $1.77 | 23d | 1 | 1.49mi |
Listing history 12 events
-
2026-06-18days on market $119,990 Active 8 DOM
-
2026-06-17price $119,990 Active 7 DOM
-
2026-06-17days on market $160,000 Active 7 DOM
-
2026-06-16days on market $160,000 Active 6 DOM
-
2026-06-15days on market $160,000 Active 5 DOM
-
2026-06-13days on market $160,000 Active 3 DOM
-
2026-06-13statusdays on market $160,000 Active 2 DOM
-
2026-06-05days on market $160,000 Contingent (Show) 73 DOM
-
2026-06-03days on market $160,000 Contingent (Show) 72 DOM
-
2026-06-02days on market $160,000 Contingent (Show) 71 DOM
-
2026-06-01days on market $160,000 Contingent (Show) 70 DOM
-
2026-05-31days on market $160,000 Contingent (Show) 69 DOM
ⓘ Source: listings_history table (triggers on properties + properties_extension) + one-shot
backfill from property_details.listing_events for pre-trigger history.
Tax reassessment forecast CA · Resets to sale price
- Current annual tax
- $1,375 · $115/mo
- Projected year-2 tax
- $1,375 · $115/mo
- Expected delta
- $0/yr ($0/mo · 0.0%)
ⓘ Screening estimate from a state-policy table — verify with the county assessor before closing.
Climate risk First Street
- Flood 1/10 Low FEMA zone X (shaded) · 0% chance over 30 yrs
- Wildfire 1/10 Low
- Heat 7/10 Severe 7 d/yr ≥102°F today · 15 d/yr by 30 yrs out
- Wind 1/10 Low
- Air quality 10/10 Extreme 28 unhealthy d/yr today · 33 by 30 yrs out
Nearby sold comps map
Loading sold comps map…
Walkable amenities ~0.75 mi
Loading nearby amenities…
Taxation est. · year 1
- Rental income
- $28,509
- − Mortgage interest
- −$6,721
- − Property taxes
- −$1,375
- − Insurance
- −$600
- − Repairs & maintenance
- −$2,281
- − Management
- −$2,281
- − Depreciation
- −$3,491
- Taxable income
- $11,760
- Est. tax owed @ 24.0%
- −$2,822
- After-tax cash flow
- $10,173/yr
For passive investors: Depreciation is non-cash, so a rental often shows a tax loss while cash-flowing — sheltering income. Rental losses are passive: they offset passive income freely, and up to $25,000/yr can offset ordinary (W-2) income if you actively participate and your MAGI is under $100k (phasing out to $0 by $150k); unused losses carry forward. On sale, claimed depreciation is recaptured at up to 25%, and gains may owe capital-gains tax (a 1031 exchange can defer both). Figures are a year-1 estimate at your 24.0% rate — not tax advice; consult a CPA.
Schools (NCES district)
- District
- Sacramento City Unified
- NCES district ID
- 0633840
- Math proficiency
- 32% ▬ 0.00%
- Reading proficiency
- 43% ▲ 3.00%
- Median HH income
- $49,280
- Composite
- 34.86/100
- National rank
- #10000
- State rank
- #804 of 1400 in CA
Livability — Sacramento
- Score
- 71/100
- State rank
- #218
- US rank
- #6957
Category grades
Schools grade is shown separately in the Schools card above.
Census & demographics
- Census place
- Sacramento, CA
- County
- Sacramento County · 1,539,646 people
- City population
- 761,410
- Metro
- Sacramento-Roseville-Folsom, CA
- Population (ZIP)
- 61,686
- Household income
- $81,778
- Rent vs Own
- Severe rent burden
- 1765.0
Population outlook (Sacramento County) Hauer SSP2
- Today (2025)
- 1,660,763 people
- By 2030
- 1,732,990 · +4.3%
- By 2040
- 1,855,755 · +11.7%
- By 2050
- 1,941,335 · +16.9%
- By 2075
- 2,046,162 · +23.2%
- By 2100
- 1,961,444 · +18.1%
Race, ethnicity, and origin ACS 2023
- Neighborhood character
- Highly diverse neighborhood (Simpson 0.75)
- Race & ethnicity
- Asian 37% Hispanic / Latino 26% White 16% Two or more races 12% Black 10% Pacific Islander 4%
- Hispanic origin (detail)
- Mexican 22%
- Common ancestry
- Italian 1% Russian 1% Portuguese 1%
- Foreign-born
- 35% · Vietnam, Canada, China
- Languages at home
- 47% English-only · Spanish 17% Other Asian/Pacific 13% Vietnamese 8%
Political lean MEDSL · Sacramento
- 2024 margin
- D (+19.7) · D 58.1% · R 38.4% · Other 3.5%
- 2008→2024 swing
- +0.7pp no change · 2008: 19.0pp · 2024: 19.7pp
- All cycles
- 2024: D+19.7 2020: D+25.3 2016: D+23.7 2012: D+16.3 2008: D+19.0
Not yet ingested
- Civics
- —
Market trends
- HPI YoY
- ▼ -7.49%
- Current HPI
- 962.47
- Rent YoY
- ▼ -0.24%
- Metro
- Sacramento-Roseville-Folsom, CA
- State GDP YoY
- ▲ 3.21%
- F500 in state
- 116
Industry mix (Fortune 500 HQ in CA)
| Industry | F500 HQs | Revenue |
|---|---|---|
| Technology | 27 | $1,492B |
|
||
| Financial Services | 3 | $174B |
|
||
| Retail | 3 | $44B |
|
||
| Insurance | 3 | $26B |
|
||
| Media / Entertainment | 2 | $115B |
|
||
| Pharmaceuticals / Biotech | 2 | $62B |
|
||
Property tax history
-0.2%/yrLatest (2025): $1,375 · -3.2% YoY. Source: county tax records.
Cash-flow waterfall
monthlySold comps — $/sqft
last 12 mo · ≤1 miLoading sold comps…