655 S Dolson Ln · Eagle, ID
Flood risk 3/10 · Minor
- FEMA flood zone
- X (shaded)
- Chance of flooding over 30 yrs
- 0.17%
- Est. flood insurance / yr
- $507 – $1,088
Fire risk 3/10 · Minor
- Est. fire insurance / yr
- $584 – $1,086
Heat risk 4/10 · Minor
- Hot days now (above 97°F)
- 7 days/yr
- Hot days in 30 yrs
- 18 days/yr
Wind risk 1/10 · Minimal
- Chance of severe wind over 30 yrs
- —
Air-quality risk 9/10 · Severe
- Unhealthy air days now
- 19 days/yr
- Unhealthy air days in 30 yrs
- 20 days/yr
Risk factors via First Street. Map © Google.
Why this score? — see what drove the B- grade
The composite is a weighted blend of 9 inputs, each scored 0–100. Each bar is that input's sub-score; the figure is the points it added to the 100-point composite (weight × sub-score).
- Cash flow +30.0/30.0
- 1% rule +10.0/10.0
- DSCR +10.0/10.0
- Schools +5.2/10.0
- Livability +3.9/5.0
- Rent growth +3.6/5.0
- Condition / age +2.5/5.0
- ARV discount +0.0/15.0
- Appreciation +0.0/10.0
$118,000
🖨 Deal sheet 📄 Offer letter ✓ Due diligence
Listing remarks
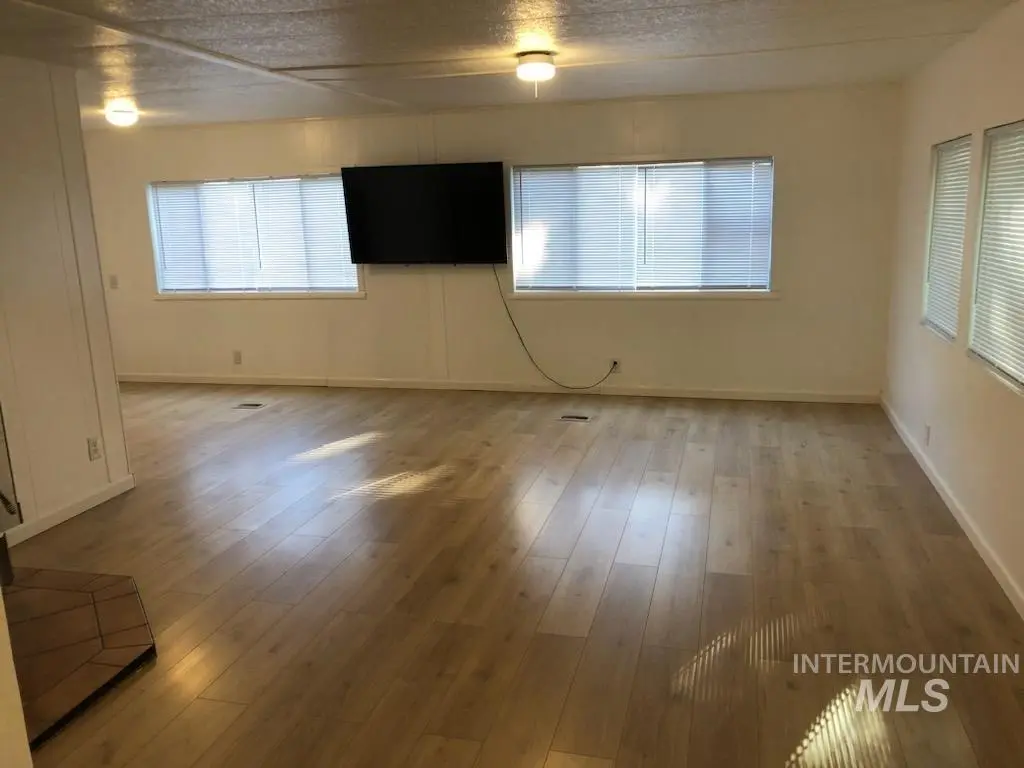
Step into this charming 1980 manufactured home offering 3 bedrooms, 2 bathrooms, and 1,344 sqft. of comfortable living space, all tucked away on a quiet, tree-lined street in the desirable Island Village subdivision of Eagle, Idaho. This property sits on a generous lot, nearly 1/2 an acre, surrounded by mature shade trees, giving you space to relax, garden, entertain, or simply enjoy the peaceful setting. Fenced yard and RV parking. Newer HVAC 2024 & AC 2025 All appliances included — a huge bonus. Lot rent is just $825/month, and that includes water, sewer, and trash — an incredible value for Eagle.
Key facts
- Generous lot
- Rv parking
- Fenced yard
Tags
Property features AI
Exterior
- Parking: RV access/parking
- Utilities: Septic tank; Shared well; Paved road access
- Home design: Mobile/manufactured home on a rented lot; Built in 1980
- Construction: Metal roof
- Exterior features: Metal fencing; Storage shed; Manual sprinkler system; Located in a flood plain; Mobile home park setting
Interior
- Kitchen: Dishwasher; Microwave; Oven/Range (freestanding); Refrigerator; Electric water heater
- Bedrooms: 3 bedrooms (all on the main level) — Master approx. 14 x 11; Bedroom 2 approx. 11 x 11; Bedroom 3 approx. 11 x 9
- Flooring: Laminate flooring
- Bathrooms: 2 bathrooms
- Heating & cooling: Forced air heating; Hot water heating; Wood heating option; Central air conditioning
- Interior features: Bath in master bedroom; Walk-in closet(s); Wood burning stove
- Laundry & utility: Washer; Dryer
Neighborhood map
What this means for you Summary
Snapshot
- This is a 3-bed/2.0-bath manufactured listed at $118k.
Deal economics
- At list price, monthly cash flow is $872 ($10k/yr) — positive.
- The deal already cash-flows at list — no discount required.
- Meets the 1% rule at list price ($2k rent vs $118k).
- Cap rate 15.2% vs local median 1.1% in Eagle — top-decile yield for the area; either an underpriced asset or a hidden risk that comps aren't pricing in. Stress-test before assuming the spread holds.
Location & tenants
- Location reads 78/100 on livability (#18 in ID, #2,702 nationally) — a middle-class / working-renter tenant base. Strengths: crime A+, employment A+, housing A+; Watch: amenities D+, commute F, cost of living F.
- Joint School District No. 2 (suburban): math 53% / reading 67% proficiency, ranked #11 of 92 in ID (top 12%) — acceptable for families but not a draw, mixed tenant base, ~2y average lease.
- Zoned schools: Eagle Hills Elementary School (math 70% / reading 75%, grade A, #15 of 357 statewide, top 4%, 409 students, 10% FRL); Eagle Academy (math 5% / reading 24%, grade F, #154 of 169 statewide, top 93%, 185 students, 29% FRL) — zoned schools at 19% FRL track the district average.
- Zoned-school proficiency averages 44% at this address vs 60% district-wide (-16 pts) — the specific schools serving this property underperform the Joint School District No. 2 average; the district grade overstates school quality for this exact location.
- Market conditions: Rents rising fast (+4.3%/yr); 939 active listings in the ZIP; 5 comparable units currently listed for rent nearby; rentals at typical pace (median 15d on market — plan ~3-4 weeks tenant-placement turnaround); high-income renter base; 5,129 units permitted in Ada County in 2024 (414 in 5+ unit buildings).
Forward outlook
- Local home prices are declining (-3.0%/yr); year-one equity from $816 of loan paydown is wiped out by about $4k of value loss. Plan a longer hold.
- Ada County population projected at +45% by 2050 — long-run rental-demand tailwind backs the buy-and-hold thesis.
- At projected returns (-3.0% appreciation + 4.3% rent growth), your $33k cash investment doubles in ~4 years — after that, you're playing with house money.
Negotiation context
- Only 11 days on market — expect competitive offers; lowballing is unlikely to land.
- 4 sale attempts since 20y ago; this cycle's ask has dropped $7k (6%) from the opening price — seller is motivated, your offer sets the floor, not the list.
Questions for the listing agent
- Is there a deadline driving the sale (1031 exchange, divorce, estate, relocation)? That informs how much negotiation room exists.
- Schools are A-rated — typically a magnet for longer-tenancy family renters. What's the average tenant stay here, and is there a school-zone premium baked into asking?
- What's the average days-on-market for RENTAL listings here right now (not sales)? A rising rental-DOM trend means longer vacancies and softer asking-rent achievability than the comps imply.
- What's the recent tenant-quality profile in this submarket — average credit score on applications, eviction rate, late-payment / NSF rate, and stable-employment percentage? A property-management company in the area should have these aggregated.
- How much new for-sale + rental construction is in the pipeline within 1–3 miles? Heavy new supply typically softens prices + rents 12–24 months out; constrained supply supports both.
Investment metrics
- 1% rule
- 1.81% ✓
- Cap rate
- 15.16%
- Cash-on-cash
- 31.67%
- DSCR
- 2.41
- GRM
- 4.6
CMA / ARV
- ARV (on-the-fly)
- $88,704
- Comps found
- 1
Show comp detail 1 sale within ~0.75 mi
| Address | Dist | Beds/Ba | Sqft | Sold | Price | $/sf | Match |
|---|---|---|---|---|---|---|---|
| 1200 Artesian Rd Trlr 10 Rd | 0.17mi | 2/2.0 (-1) | 1,440 (+7%) | 2mo | $94,900 | $66 | 74 |
Match score weights: distance 35% · size 25% · config 20% · recency 20%. Top-matched comps best support the ARV.
Projected returns pro-forma
-3.0% appreciation · 4.3% rent growth · sell at horizon
- IRR
- 28.1%
- Equity multiple
- 2.19×
- Total profit
- $39,282
- Equity at exit
- $17,594
- IRR
- 36.3%
- Equity multiple
- 4.56×
- Total profit
- $117,780
- Equity at exit
- $10,202
Cash invested: $33,040 (down + closing). Projections, not guarantees.
Landlord ↔ Tenant lean methodology
- Overall (STATE)
- 91 Strongly Landlord-Friendly
- State Idaho
- 91 Strongly Landlord-Friendly · R+18
- County
- — inherits STATE
- City
- — inherits STATE
ZIP-level market 83616
- Rents YoY
- 4.3%
- Active inventory
- 939
- Price-to-rent
- 4.6×
Monthly cashflow live
- Estimated rent
- $2,136 high interval (Pro) →
- Mortgage (P&I)
- −$619
- Tax est. 1.5%
- −$148 /mo · $1,770/yr
- Insurance
- −$49
- HOA
- −$0
- Vacancy / Maint / Mgmt
- −$449
- Net cashflow
- $872
Break-even live
UW: 25.0% down · 7.5% · 30yr · 1.5% tax · 5.0% vac · 8.0% maint · 8.0% mgmt
Financing live
Cash to close
- Down payment
- $29,500
- Closing costs
- $3,540
- Reserves months
- —
- Total cash needed
- —
Loan-product check · same deal, 3 products live
Conventional
25% down · 7.5% · 30yr
- Down + closing
- —
- Monthly P&I
- —
- Monthly cashflow
- —
- DSCR
- —
- Eligible?
- —
Personal DTI + credit; lowest rate.
DSCR
20% down · 8.5% · 30yr
- Down + closing
- —
- Monthly P&I
- —
- Monthly cashflow
- —
- DSCR
- —
- Eligible?
- —
No personal income docs; deal must DSCR.
Hard money
10% down · 12.0% · 12mo
- Down + closing
- —
- Monthly P&I
- —
- Monthly cashflow
- —
- DSCR
- —
- Eligible?
- —
Short-term bridge; refi at stabilization.
Rent comps 5 comps
| Address | Beds | Baths | Sqft | Rent | $/sqft | DOM | Units | Dist |
|---|---|---|---|---|---|---|---|---|
| 225 S Linder Rd Eagle, ID | 1.0–3.0 | 1.0–2.0 | 1004 | $2,283 | $2.27 | 2d | 26 | 0.57mi |
| 4193 W Perspective St Eagle, ID | 3.0 | 2.5 | 1689 | $2,400 | $1.42 | 14d | 1 | 0.70mi |
| 4915 W Escalante Dr Unit F101 Eagle, ID | 2.0 | 2.5 | 1180 | $1,600 | $1.36 | 14d | 1 | 0.76mi |
| 4915 W Escalante Dr Unit G102 Eagle, ID | 3.0 | 3.0 | 1246 | $1,700 | $1.36 | 11d | 1 | 0.76mi |
| 4915 W Escalante Dr Unit H104 Eagle, ID | 3.0 | 3.0 | 1246 | $1,700 | $1.36 | 19d | 1 | 0.76mi |
Listing history 18 events
-
2026-06-10status $118,000 Pending 11 DOM
-
2026-06-09days on market $118,000 Active 11 DOM
-
2026-06-08days on market $118,000 Active 10 DOM
-
2026-06-07days on market $118,000 Active 9 DOM
-
2026-06-03days on market $118,000 Active 5 DOM
-
2026-06-03remarks 608-char remark
-
2026-06-03days on market $118,000 Active 4 DOM
-
2026-06-01days on market $118,000 Active 3 DOM
-
2026-05-31days on market $118,000 Active 2 DOM
-
2026-05-17price $118,000
-
2026-04-29price $124,000
-
2026-03-16$125,000 Active
-
2025-06-27historical
-
2025-05-06price $129,000
-
2024-12-27$140,000 Active
-
2010-09-27$14,000
-
2006-08-28soldstatus
-
2006-04-11$24,900
ⓘ Source: listings_history table (triggers on properties + properties_extension) + one-shot
backfill from property_details.listing_events for pre-trigger history.
Climate risk First Street
- Flood 3/10 Moderate FEMA zone X (shaded) · 17% chance over 30 yrs
- Wildfire 3/10 Moderate
- Heat 4/10 Moderate 7 d/yr ≥97°F today · 18 d/yr by 30 yrs out
- Wind 1/10 Low
- Air quality 9/10 Extreme 19 unhealthy d/yr today · 20 by 30 yrs out
Nearby sold comps map
Loading sold comps map…
Walkable amenities ~0.75 mi
Loading nearby amenities…
Taxation est. · year 1
- Rental income
- $25,633
- − Mortgage interest
- −$6,610
- − Property taxes
- −$1,770
- − Insurance
- −$590
- − Repairs & maintenance
- −$2,051
- − Management
- −$2,051
- − Depreciation
- −$3,433
- Taxable income
- $9,129
- Est. tax owed @ 24.0%
- −$2,191
- After-tax cash flow
- $8,273/yr
For passive investors: Depreciation is non-cash, so a rental often shows a tax loss while cash-flowing — sheltering income. Rental losses are passive: they offset passive income freely, and up to $25,000/yr can offset ordinary (W-2) income if you actively participate and your MAGI is under $100k (phasing out to $0 by $150k); unused losses carry forward. On sale, claimed depreciation is recaptured at up to 25%, and gains may owe capital-gains tax (a 1031 exchange can defer both). Figures are a year-1 estimate at your 24.0% rate — not tax advice; consult a CPA.
Schools (NCES district)
- District
- Joint School District No. 2
- NCES district ID
- 1602100
- Math proficiency
- 53% ▼ -6.00%
- Reading proficiency
- 67% ▼ -1.00%
- Median HH income
- $64,573
- Composite
- 52.42/100
- National rank
- #1576
- State rank
- #11 of 92 in ID
Livability — Eagle
- Score
- 78/100
- State rank
- #18
- US rank
- #2702
Category grades
Schools grade is shown separately in the Schools card above.
Census & demographics
- County
- Ada County · 522,161 people
- City population
- 35,413
- Metro
- Boise City, ID
- Population (ZIP)
- 35,413
- Household income
- $125,203
- Rent vs Own
- Severe rent burden
- 585.0
Population outlook (Ada County) Hauer SSP2
- Today (2025)
- 535,818 people
- By 2030
- 585,751 · +9.3%
- By 2040
- 682,435 · +27.4%
- By 2050
- 775,818 · +44.8%
- By 2075
- 994,458 · +85.6%
- By 2100
- 1,148,884 · +114.4%
Race, ethnicity, and origin ACS 2023
- Neighborhood character
- Predominantly White (86%)
- Race & ethnicity
- White 86% Hispanic / Latino 9% Two or more races 7% Asian 2% Native American 1%
- Hispanic origin (detail)
- Mexican 7%
- Common ancestry
- Italian 5% Slovak 4% Lithuanian 3%
- Foreign-born
- 6% · Canada
- Languages at home
- 93% English-only · Spanish 3% Russian/Polish/Slavic 1% Other Asian/Pacific 1%
Political lean MEDSL · Ada
- 2024 margin
- R (+10.3) · D 43.4% · R 53.8% · Other 2.8%
- 2008→2024 swing
- -4.2pp toward R · 2008: -6.2pp · 2024: -10.3pp
- All cycles
- 2024: R+10.3 2020: R+3.9 2016: R+9.2 2012: R+11.3 2008: R+6.2
Not yet ingested
- Civics
- —
Market trends
- HPI YoY
- ▼ -194.48%
- Current HPI
- 314.6194
- Rent YoY
- ▲ 4.30%
- Metro
- Boise City, ID
- State GDP YoY
- ▲ 4.51%
- F500 in state
- 6
Industry mix (Fortune 500 HQ in ID)
| Industry | F500 HQs | Revenue |
|---|---|---|
| Retail | 1 | $79B |
|
||
| Technology | 1 | $25B |
|
||
| Food / Agriculture | 1 | $6B |
|
||
Price history
+373.9% since first listed9 events — show timeline
- 2026-05-17 Price Changed $118,000 IMLS
- 2026-04-29 Price Changed $124,000 IMLS
- 2026-03-16 Listed $125,000 IMLS
- 2025-06-27 Listing Removed — IMLS
- 2025-05-06 Price Changed $129,000 IMLS
- 2024-12-27 Listed $140,000 IMLS
- 2010-09-27 Listed $14,000 IMLS
- 2006-08-28 Sold (MLS) — IMLS
- 2006-04-11 Listed $24,900 IMLS
Cash-flow waterfall
monthlySold comps — $/sqft
last 12 mo · ≤1 miLoading sold comps…