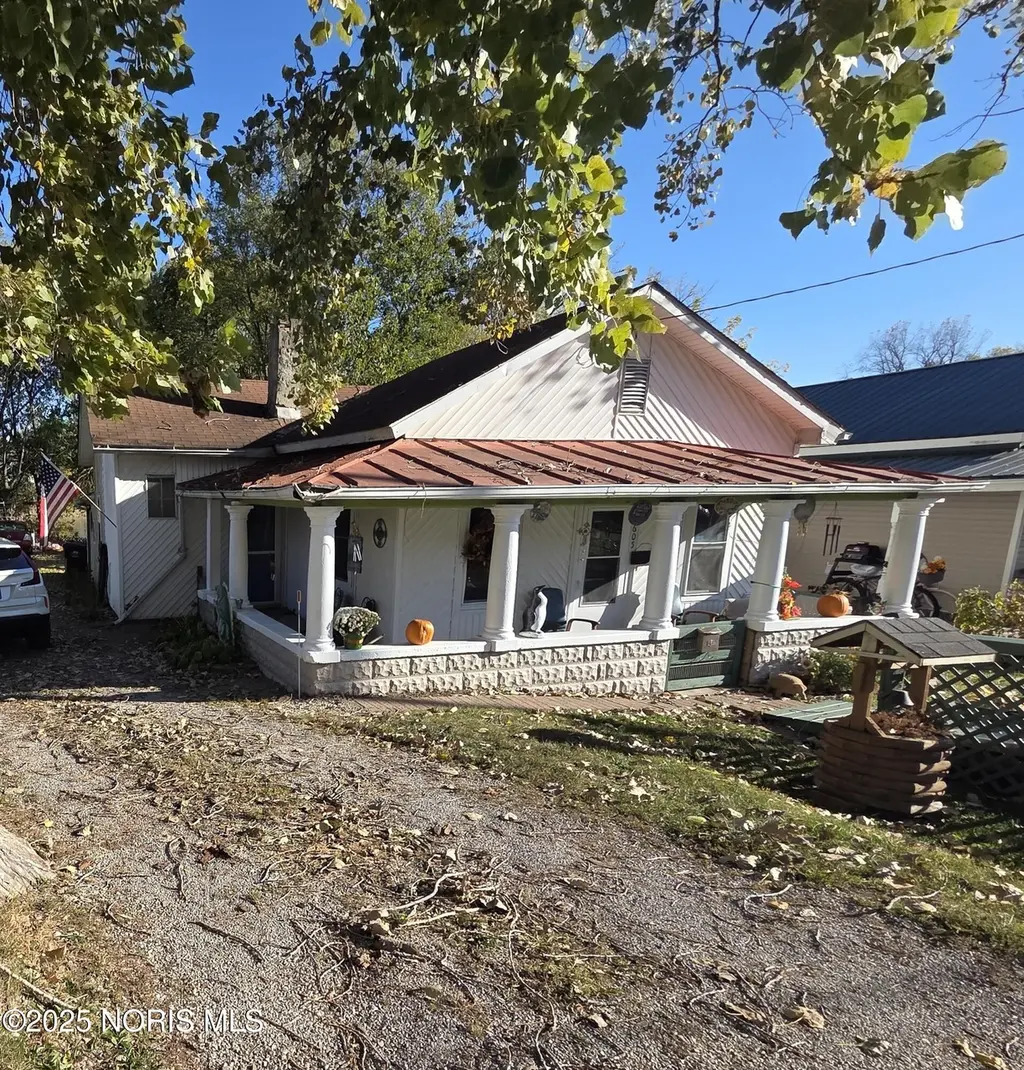
605 Riverside Ave · Defiance, OH
Flood risk No data
- FEMA flood zone
- —
- Chance of flooding over 30 yrs
- —
- Est. flood insurance / yr
- —
Fire risk No data
- Est. fire insurance / yr
- —
Heat risk No data
- Hot days now (above threshold)
- —
- Hot days in 30 yrs
- —
Wind risk No data
- Chance of severe wind over 30 yrs
- —
Air-quality risk No data
- Unhealthy air days now
- —
- Unhealthy air days in 30 yrs
- —
Risk factors via First Street. Map © Google.
Why this score? — see what drove the B- grade
The composite is a weighted blend of 9 inputs, each scored 0–100. Each bar is that input's sub-score; the figure is the points it added to the 100-point composite (weight × sub-score).
- Cash flow +23.9/30.0
- ARV discount +15.0/15.0
- DSCR +7.7/10.0
- Schools +5.6/10.0
- 1% rule +5.0/10.0
- Livability +3.6/5.0
- Rent growth +2.5/5.0
- Condition / age +2.5/5.0
- Appreciation +0.0/10.0
$99,900
🖨 Deal sheet 📄 Offer letter ✓ Due diligence
Listing remarks MLS
Private riverfront community with high overlooks of the Maumee & Tiffin Rivers offers spectacular views as well as waterfront access. This secluded neighborhood has been designed with the very finest in homesite features and construction in mind.
Key facts
- River access
- Corner lot
- River views
Tags
Property features AI
Finance
- Other: Additional parcel(s) included (2 small lots)
- HOA & community: Playground nearby; Sidewalks in community
Exterior
- Parking: 2 parking spaces; Gravel parking; Off-street parking; On-street parking
- Utilities: Electricity connected (200+ amp service); Natural gas available; Public water; Public sewer
- Home design: Single-family residence (house); One level / Ranch style; No shared/common walls; Living area reported from public records
- Construction: Frame construction with vinyl siding; Aluminum and shingle roof; Combination foundation; Year built per public records
- Exterior features: Front porch; Covered porch; Rear porch; Wrap-around deck/porch; River frontage; Corner lot; Wooded lot; City street frontage; Paved road
Interior
- Kitchen: Dishwasher
- Bedrooms: Bedroom 2 on the main level; Total rooms: 6
- Flooring: Laminate flooring
- Bathrooms: 1 full bathroom; 1 half bathroom (1.5 total)
- Heating & cooling: Electric heating; Mini-split heating; Ceiling fans for cooling; Electric cooling; Mini-split cooling
- Interior features: Ceiling fans; Primary bathroom; Door screens; Sump pump
- Laundry & utility: Laundry on main level; Electric dryer hookup
Neighborhood map
What this means for you Summary
Snapshot
- This is a 3-bed/2.0-bath single-family listed at $100k.
Deal economics
- At list price, monthly cash flow is $194 ($2k/yr) — positive.
- The deal already cash-flows at list — no discount required.
- To meet the 1% rule (rent ≥ 1% of price), the offer needs to be $100k (0.2% below list).
- Recommended offer: $100k (0.2% below list) — sets the bar for 1% rule.
- Cap rate 8.6% vs local median 2.5% in Defiance — top-decile yield for the area; either an underpriced asset or a hidden risk that comps aren't pricing in. Stress-test before assuming the spread holds.
Location & tenants
- Location reads 71/100 on livability (#448 in OH) — a middle-class / working-renter tenant base. Strengths: cost of living A+, housing A+, schools B+; Watch: employment D, amenities F, commute F.
- Northeastern Local (rural): math 62% / reading 67% proficiency, ranked #200 of 656 in OH (top 30%) — acceptable for families but not a draw, mixed tenant base, ~2y average lease.
- Market conditions: 135 active listings in the ZIP; 41 units permitted in Defiance County in 2024 (0 in 5+ unit buildings).
- This rent is only 17% of the median local income ($72k/yr) — well below the 30% rent-burden line; pricing power to push rent on renewal without tenant pushback.
Forward outlook
- Local home prices are declining (-3.0%/yr); year-one equity from $691 of loan paydown is wiped out by about $3k of value loss. Plan a longer hold.
- Defiance County population projected at -16% by 2050 — secular population decline; favor cash flow + early exit over multi-decade hold.
Negotiation context
- Only 4 days on market — expect competitive offers; lowballing is unlikely to land.
- 4 sale attempts since 22y ago with the ask held roughly flat each time — persistent listings suggest the price (not the market) is what's stuck; bring a comps-based counter.
- Current owner paid $67k; 49% above their basis — modest negotiation headroom, anchor on the comps not their cost.
Questions for the listing agent
- Is there a deadline driving the sale (1031 exchange, divorce, estate, relocation)? That informs how much negotiation room exists.
- Schools are B-rated — typically a magnet for longer-tenancy family renters. What's the average tenant stay here, and is there a school-zone premium baked into asking?
- What's the average days-on-market for RENTAL listings here right now (not sales)? A rising rental-DOM trend means longer vacancies and softer asking-rent achievability than the comps imply.
- What's the recent tenant-quality profile in this submarket — average credit score on applications, eviction rate, late-payment / NSF rate, and stable-employment percentage? A property-management company in the area should have these aggregated.
- How much new for-sale + rental construction is in the pipeline within 1–3 miles? Heavy new supply typically softens prices + rents 12–24 months out; constrained supply supports both.
Investment metrics
- 1% rule
- 1.00% ✗
- Cap rate
- 8.62%
- Cash-on-cash
- 8.31%
- DSCR
- 1.37
- GRM
- 8.4
CMA / ARV
- ARV (on-the-fly)
- $130,500
- Comps found
- 4
Show comp detail 4 sales within ~0.75 mi
| Address | Dist | Beds/Ba | Sqft | Sold | Price | $/sf | Match |
|---|---|---|---|---|---|---|---|
| 714 Westwood Dr | 0.67mi | 3/1.5 | 1,560 (+8%) | 11mo | $141,000 | $90 | 45 |
| 731 Westwood Dr | 0.68mi | 3/1.0 | 1,412 (-3%) | 18mo | $164,900 | $117 | 45 |
| 720 Westwood Dr | 0.70mi | 3/1.0 | 1,317 (-9%) | 18mo | $62,000 | $47 | 33 |
| 918 Deatrick St | 0.65mi | 4/2.0 (+1) | 1,240 (-14%) | 20mo | $69,900 | $56 | 24 |
Match score weights: distance 35% · size 25% · config 20% · recency 20%. Top-matched comps best support the ARV.
Projected returns pro-forma
-3.0% appreciation · 3.0% rent growth · sell at horizon
- IRR
- -3.7%
- Equity multiple
- 0.86×
- Total profit
- $-3,890
- Equity at exit
- $14,895
- IRR
- 5.9%
- Equity multiple
- 1.44×
- Total profit
- $12,326
- Equity at exit
- $8,638
Cash invested: $27,972 (down + closing). Projections, not guarantees.
Landlord ↔ Tenant lean methodology
- Overall (STATE)
- 73 Landlord-Friendly
- State Ohio
- 73 Landlord-Friendly · R+6
- County
- — inherits STATE
- City
- — inherits STATE
ZIP-level market 43512
- Home prices YoY
- -24.3%
- Active inventory
- 135
- Price-to-rent
- 8.4×
Monthly cashflow live
- Estimated rent
- $997 medium interval (Pro) →
- Mortgage (P&I)
- −$524
- Tax from tax record
- −$28 /mo · $338/yr
- Insurance
- −$42
- HOA
- −$0
- Vacancy / Maint / Mgmt
- −$209
- Net cashflow
- $194
Break-even live
UW: 25.0% down · 7.5% · 30yr · 1.5% tax · 5.0% vac · 8.0% maint · 8.0% mgmt
Financing live
Cash to close
- Down payment
- $24,975
- Closing costs
- $2,997
- Reserves months
- —
- Total cash needed
- —
Loan-product check · same deal, 3 products live
Conventional
25% down · 7.5% · 30yr
- Down + closing
- —
- Monthly P&I
- —
- Monthly cashflow
- —
- DSCR
- —
- Eligible?
- —
Personal DTI + credit; lowest rate.
DSCR
20% down · 8.5% · 30yr
- Down + closing
- —
- Monthly P&I
- —
- Monthly cashflow
- —
- DSCR
- —
- Eligible?
- —
No personal income docs; deal must DSCR.
Hard money
10% down · 12.0% · 12mo
- Down + closing
- —
- Monthly P&I
- —
- Monthly cashflow
- —
- DSCR
- —
- Eligible?
- —
Short-term bridge; refi at stabilization.
Listing history 14 events
-
2026-05-15status Pending
-
2026-05-13historical Contingent
-
2026-05-11$99,900 Active
-
2026-05-10historical
-
2026-05-06price $99,900
-
2025-11-09$109,900 Active
-
2025-10-29historical
-
2025-10-14price $67,000 250-char remark
Show marketing remark (250 chars)
Private riverfront community with high overlooks of the Maumee & Tiffin Rivers offers spectacular views as well as waterfront access. This secluded neighborhood has been designed with the very finest in homesite features and construction in mind.
-
2020-10-06soldstatus $67,000 250-char remark
Show marketing remark (250 chars)
Private riverfront community with high overlooks of the Maumee & Tiffin Rivers offers spectacular views as well as waterfront access. This secluded neighborhood has been designed with the very finest in homesite features and construction in mind.
-
2014-02-07$67,500 250-char remark
Show marketing remark (250 chars)
Private riverfront community with high overlooks of the Maumee & Tiffin Rivers offers spectacular views as well as waterfront access. This secluded neighborhood has been designed with the very finest in homesite features and construction in mind.
-
2005-02-17soldstatus $27,000
-
2004-12-10historical
-
2004-07-22soldstatus $28,000
-
2004-06-16$29,900
ⓘ Source: listings_history table (triggers on properties + properties_extension) + one-shot
backfill from property_details.listing_events for pre-trigger history.
Tax reassessment forecast OH · Partial reset (capped growth)
- Current annual tax
- $338 · $28/mo
- Projected year-2 tax
- $948 · $79/mo
- Expected delta
- +$610/yr (+$51/mo · 180.8%)
ⓘ Screening estimate from a state-policy table — verify with the county assessor before closing.
Nearby sold comps map
Loading sold comps map…
Walkable amenities ~0.75 mi
Loading nearby amenities…
Taxation est. · year 1
- Rental income
- $11,961
- − Mortgage interest
- −$5,596
- − Property taxes
- −$338
- − Insurance
- −$500
- − Repairs & maintenance
- −$957
- − Management
- −$957
- − Depreciation
- −$2,906
- Taxable income
- $708
- Est. tax owed @ 24.0%
- −$170
- After-tax cash flow
- $2,156/yr
For passive investors: Depreciation is non-cash, so a rental often shows a tax loss while cash-flowing — sheltering income. Rental losses are passive: they offset passive income freely, and up to $25,000/yr can offset ordinary (W-2) income if you actively participate and your MAGI is under $100k (phasing out to $0 by $150k); unused losses carry forward. On sale, claimed depreciation is recaptured at up to 25%, and gains may owe capital-gains tax (a 1031 exchange can defer both). Figures are a year-1 estimate at your 24.0% rate — not tax advice; consult a CPA.
Schools (NCES district)
- District
- Northeastern Local
- NCES district ID
- 3904672
- Math proficiency
- 62% ▼ -16.00%
- Reading proficiency
- 67% ▼ -6.00%
- Median HH income
- $60,761
- Composite
- 55.82/100
- National rank
- #1207
- State rank
- #200 of 656 in OH
Livability — Defiance
- Score
- 71/100
- State rank
- #448
- US rank
- #7316
Category grades
Schools grade is shown separately in the Schools card above.
Census & demographics
- Census place
- Defiance, OH
- County
- Defiance · 37,898 people
- City population
- 27,894
- Population (ZIP)
- 27,894
- Household income
- $72,082
- Rent vs Own
- Severe rent burden
- 7.6
Population outlook (Defiance County) Hauer SSP2
- Today (2025)
- 37,051 people
- By 2030
- 36,013 · -2.8%
- By 2040
- 33,583 · -9.4%
- By 2050
- 31,309 · -15.5%
- By 2075
- 26,980 · -27.2%
- By 2100
- 23,416 · -36.8%
Race, ethnicity, and origin ACS 2023
- Neighborhood character
- Predominantly White (83%)
- Race & ethnicity
- White 83% Hispanic / Latino 12% Two or more races 7% Black 2%
- Hispanic origin (detail)
- Mexican 10% Puerto Rican 1%
- Common ancestry
- Lithuanian 2% Slovak 2% Italian 1%
- Foreign-born
- 1% · Canada
- Languages at home
- 95% English-only · Spanish 4%
Political lean MEDSL · Defiance
- 2024 margin
- Solid R (+39.9) · D 29.6% · R 69.5%
- 2008→2024 swing
- -29.4pp toward R · 2008: -10.5pp · 2024: -39.9pp
- All cycles
- 2024: R+39.9 2020: R+36.4 2016: R+34.8 2012: R+14.1 2008: R+10.5
Not yet ingested
- Civics
- —
Market trends
- HPI YoY
- ▼ -67.33%
- Current HPI
- 210.2352
- Rent YoY
- —
- Metro
- —
- State GDP YoY
- ▲ 1.98%
- F500 in state
- 48
Industry mix (Fortune 500 HQ in OH)
| Industry | F500 HQs | Revenue |
|---|---|---|
| Insurance | 3 | $145B |
|
||
| Industrial Machinery | 3 | $49B |
|
||
| Financial Services | 3 | $24B |
|
||
| Consumer Goods | 2 | $93B |
|
||
| Aerospace / Defense | 2 | $47B |
|
||
| Utilities | 2 | $33B |
|
||
Price history
+234.1% since first listed14 events — show timeline
- 2026-05-15 Pending — NORIS
- 2026-05-13 Contingent — NORIS
- 2026-05-11 Listed $99,900 NORIS
- 2026-05-10 Listing Removed — NORIS
- 2026-05-06 Price Changed $99,900 NORIS
- 2025-11-09 Listed $109,900 NORIS
- 2025-10-29 Coming Soon — NORIS
- 2025-10-14 Price Changed $67,000 NORIS
- 2020-10-06 Sold (MLS) $67,000 NORIS
- 2014-02-07 Listed $67,500 NORIS
- 2005-02-17 Sold (Public Records) $27,000 Public Records
- 2004-12-10 Listing Removed — NORIS
- 2004-07-22 Sold (Public Records) $28,000 Public Records
- 2004-06-16 Listed $29,900 NORIS
Property tax history
-6.3%/yrLatest (2025): $338 · -2.4% YoY. Source: county tax records.
Cash-flow waterfall
monthlySold comps — $/sqft
last 12 mo · ≤1 miLoading sold comps…