 🏷️ Likely Rental
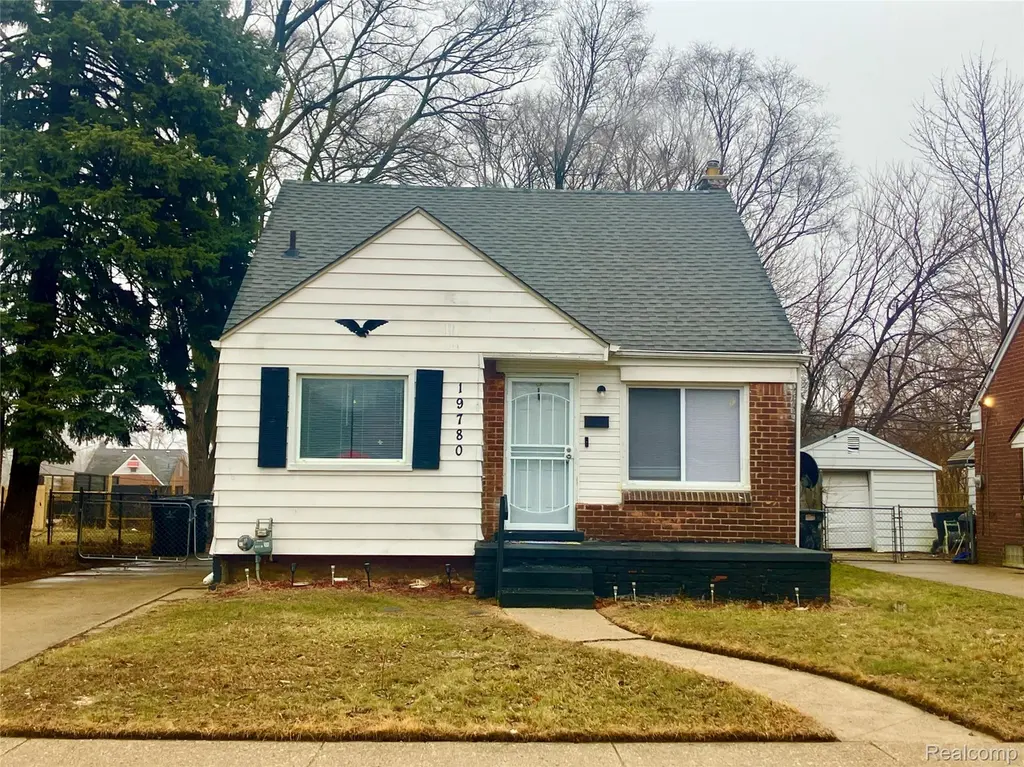
19780 Barlow St · Detroit, MI
Flood risk 1/10 · Minimal
- FEMA flood zone
- X (unshaded)
- Chance of flooding over 30 yrs
- 0.0%
- Est. flood insurance / yr
- $473 – $860
Fire risk 1/10 · Minimal
- Est. fire insurance / yr
- $784 – $1,456
Heat risk 3/10 · Minor
- Hot days now (above 96°F)
- 7 days/yr
- Hot days in 30 yrs
- 15 days/yr
Wind risk 2/10 · Minimal
- Chance of severe wind over 30 yrs
- —
Air-quality risk 3/10 · Minor
- Unhealthy air days now
- 2 days/yr
- Unhealthy air days in 30 yrs
- 5 days/yr
Risk factors via First Street. Map © Google.
Why this score? — see what drove the B+ grade
The composite is a weighted blend of 9 inputs, each scored 0–100. Each bar is that input's sub-score; the figure is the points it added to the 100-point composite (weight × sub-score).
- Cash flow +30.0/30.0
- ARV discount +15.0/15.0
- 1% rule +10.0/10.0
- DSCR +10.0/10.0
- Livability +3.7/5.0
- Rent growth +2.8/5.0
- Condition / age +2.5/5.0
- Schools +1.3/10.0
- Appreciation +0.0/10.0
$62,900
🖨 Deal sheet (PDF) 📄 Offer letter ✓ Due diligence
Listing remarks
INVESTORS - HERE ARE THE PERFECT TENANTS IN A WELL MAINTAINED HOME ON A GREAT BLOCK! Solid three bedroom with an updated kitchen, amazing condition in and out, recently updated and serviced sewer line, stack and mechanicals, windows, roof, driveway and fence all have good life left. Clean dry basement and a nice backyard and garage. Continue to maintain this property and it will offer returns for years to come without investment in big ticket items. Long term tenants on a yearly lease and paid to date at $1,000. per month. Tenant pays utilities AND MAINTAINS YARD! No showings without scheduled appointment and proof of funds. NO SELLER FINANCING BATVAI
Key facts
- Good life left roof
- Nice backyard
- Updated kitchen
Tags
Property features AI
Exterior
- Parking: Detached 1-car garage
- Utilities: Water available; Public sewer
- Home design: Single-family residence; Two levels; Ground-level entry with steps
- Construction: Aluminum and vinyl siding; Block foundation
- Exterior features: Paved road; Lot approx. 0.11 acres (45 x 110)
Interior
- Bathrooms: One full bathroom
- Heating & cooling: Forced air heating (natural gas); No cooling
- Interior features: Unfinished basement; Three total rooms
Neighborhood map
What this means for you Summary
Snapshot
- This is a 3-bed/1.0-bath single-family listed at $63k.
Deal economics
- At list price, monthly cash flow is $550 ($7k/yr) — positive.
- The deal already cash-flows at list — no discount required.
- Meets the 1% rule at list price ($1k rent vs $63k).
- Recommended offer: $62k (1.5% below list) — sets the bar for market timing.
- Cap rate 16.8% vs local median 10.0% in Detroit — top-decile yield for the area; either an underpriced asset or a hidden risk that comps aren't pricing in. Stress-test before assuming the spread holds.
Location & tenants
- Location reads 73/100 on livability (#218 in MI) — a middle-class / working-renter tenant base. Strengths: amenities A+, commute A+, cost of living A+; Watch: schools F, crime F, employment F.
- Detroit Public Schools Community District (urban): math 10% / reading 24% proficiency, ranked #499 of 540 in MI (top 92%) — low school quality limits family demand, transient renter base, plan for 1-2y turnover; 90% free/reduced lunch — lower-income household profile, screen leases tightly.
- Market conditions: Rents rising (+1.3%/yr); 376 active listings in the ZIP; 40 comparable units currently listed for rent nearby; rentals at typical pace (median 20d on market — plan ~3-4 weeks tenant-placement turnaround); lower-income renter base — watch delinquency; 2,639 units permitted in Wayne County in 2024 (1,216 in 5+ unit buildings).
- This rent runs 43% of the median local income ($39k/yr) — at the standard rent-burdened threshold; future hikes will face affordability resistance.
Forward outlook
- Local home prices are declining (-3.0%/yr); year-one equity from $435 of loan paydown is wiped out by about $2k of value loss. Plan a longer hold.
- Wayne County population projected at -17% by 2050 — secular population decline; favor cash flow + early exit over multi-decade hold.
- At projected returns (-3.0% appreciation + 1.3% rent growth), your $18k cash investment doubles in ~4 years — after that, you're playing with house money.
Negotiation context
- It's been on market 28 days — a 2% lower offer ($62k) is reasonable based on typical stale-listing flexibility.
- 13 sale attempts since 19y ago; this cycle's ask has dropped $7k (10%) from the opening price — seller is motivated, your offer sets the floor, not the list.
Risks & watch-outs
- Watch-outs: property tax is 3.7% of price; built in 1947 — expect roof / HVAC / electrical / plumbing capex.
Questions for the listing agent
- Built in 1947 — when were the roof, HVAC, electrical panel, plumbing, and water heater last replaced?
- Property tax is high relative to price — has the assessment been appealed recently, and will the sale trigger a re-assessment?
- Is there a deadline driving the sale (1031 exchange, divorce, estate, relocation)? That informs how much negotiation room exists.
- Schools are F-rated, which usually means shorter tenancies and higher turnover. Who's the typical renter profile here, and what's been the actual vacancy rate?
- Crime grade is F in this area — have there been break-ins, vandalism, or insurance claims at this property in the last 3 years? What carrier currently insures it and at what premium?
- What's the average days-on-market for RENTAL listings here right now (not sales)? A rising rental-DOM trend means longer vacancies and softer asking-rent achievability than the comps imply.
- What's the recent tenant-quality profile in this submarket — average credit score on applications, eviction rate, late-payment / NSF rate, and stable-employment percentage? A property-management company in the area should have these aggregated.
- How much new for-sale + rental construction is in the pipeline within 1–3 miles? Heavy new supply typically softens prices + rents 12–24 months out; constrained supply supports both.
Investment metrics
- 1% rule
- 2.22% ✓
- Cap rate
- 16.79%
- Cash-on-cash
- 37.51%
- DSCR
- 2.67
- GRM
- 3.8
CMA / ARV
- ARV (median comp)
- $81,582
- List price
- $62,900
- Delta
- -3.16%
- Verdict
- FAIR
- Comps
- 20 within 1.0 mi
Show comp detail 12 sales within ~0.75 mi
| Address | Dist | Beds/Ba | Sqft | Sold | Price | $/sf | Match |
|---|---|---|---|---|---|---|---|
| 19940 Westphalia St | 0.21mi | 3/1.0 | 1,114 (-1%) | 0mo | $30,000 | $27 | 88 |
| 20264 Waltham St | 0.35mi | 3/1.5 | 1,192 (+6%) | 1mo | $50,000 | $42 | 72 |
| 19730 Goulburn St | 0.14mi | 3/1.5 | 977 (-13%) | 1mo | $114,000 | $117 | 68 |
| 20577 Fairport St | 0.53mi | 3/1.0 | 1,078 (-4%) | 1mo | $65,000 | $60 | 67 |
| 21022 Helle Ave | 0.72mi | 3/1.0 | 1,120 (-1%) | 2mo | $135,000 | $121 | 64 |
| 20218 Goulburn St | 0.32mi | 3/1.0 | 965 (-14%) | 1mo | $12,000 | $12 | 60 |
| 20020 Pelkey St | 0.53mi | 3/1.0 | 1,020 (-10%) | 2mo | $75,000 | $74 | 58 |
| 19161 Hamburg St | 0.41mi | 3/1.0 | 960 (-15%) | 2mo | $116,000 | $121 | 55 |
| 18652 Goulburn St | 0.68mi | 4/1.0 (+1) | 1,200 (+6%) | 2mo | $23,000 | $19 | 51 |
| 20541 Barlow St | 0.45mi | 2/1.0 (-1) | 980 (-13%) | 2mo | $60,000 | $61 | 51 |
| 18680 Westphalia St | 0.67mi | 4/1.0 (+1) | 1,247 (+10%) | 1mo | $75,000 | $60 | 46 |
| 13693 Edmore Dr | 0.74mi | 3/1.5 | 1,269 (+12%) | 0mo | $100,000 | $79 | 42 |
Match score weights: distance 35% · size 25% · config 20% · recency 20%. Top-matched comps best support the ARV.
Projected returns pro-forma
-3.0% appreciation · 1.33% rent growth · sell at horizon
- IRR
- 31.4%
- Equity multiple
- 2.29×
- Total profit
- $22,655
- Equity at exit
- $9,379
- IRR
- 37.5%
- Equity multiple
- 4.19×
- Total profit
- $56,107
- Equity at exit
- $5,438
Cash invested: $17,612 (down + closing). Projections, not guarantees.
Landlord ↔ Tenant lean methodology
- Overall (STATE)
- 62 Landlord-Friendly
- State Michigan
- 62 Landlord-Friendly · EVEN
- County
- — inherits STATE
- City
- — inherits STATE
ZIP-level market 48205
- Home prices YoY
- -28.1%
- Rents YoY
- 1.3%
- Active inventory
- 376
- Price-to-rent
- 3.8×
Monthly cashflow live
- Estimated rent
- $1,393 high interval (Pro) →
- Mortgage (P&I)
- −$330
- Tax from tax record
- −$194 /mo · $2,331/yr
- Insurance
- −$26
- HOA
- −$0
- Vacancy / Maint / Mgmt
- −$293
- Net cashflow
- $550
Break-even live
Sensitivity live
| Price | -10% $586 | -5% $568 | +0% $550 | +5% $533 | +10% $515 |
|---|---|---|---|---|---|
| Rent | -10% $440 | -5% $495 | +0% $550 | +5% $605 | +10% $661 |
| Rate | -1.0pp $582 | -0.5pp $566 | base $550 | +0.5pp $534 | +1.0pp $518 |
UW: 25.0% down · 7.5% · 30yr · 1.5% tax · 5.0% vac · 8.0% maint · 8.0% mgmt
Financing live
Cash to close
- Down payment
- $15,725
- Closing costs
- $1,887
- Reserves months
- —
- Total cash needed
- —
Loan-product check · same deal, 3 products live
Conventional
25% down · 7.5% · 30yr
- Down + closing
- —
- Monthly P&I
- —
- Monthly cashflow
- —
- DSCR
- —
- Eligible?
- —
Personal DTI + credit; lowest rate.
DSCR
20% down · 8.5% · 30yr
- Down + closing
- —
- Monthly P&I
- —
- Monthly cashflow
- —
- DSCR
- —
- Eligible?
- —
No personal income docs; deal must DSCR.
Hard money
10% down · 12.0% · 12mo
- Down + closing
- —
- Monthly P&I
- —
- Monthly cashflow
- —
- DSCR
- —
- Eligible?
- —
Short-term bridge; refi at stabilization.
Rent comps 40 comps
| Address | Beds | Baths | Sqft | Rent | $/sqft | DOM | Units | Dist |
|---|---|---|---|---|---|---|---|---|
| 20091 Barlow St Detroit, MI | 3.0 | 1.0 | 930 | $1,300 | $1.40 | 19d | 1 | 0.21mi |
| 19610 Westphalia St Detroit, MI | 3.0 | 1.0 | 1200 | $1,595 | $1.33 | 19d | 1 | 0.23mi |
| 19419 Westphalia St Detroit, MI | 3.0 | 1.0 | 1293 | $1,325 | $1.02 | 19d | 1 | 0.31mi |
| 20296 Waltham St Detroit, MI | 3.0 | 1.5 | 986 | $1,300 | $1.32 | 19d | 1 | 0.34mi |
| 20027 Alcoy St Detroit, MI | 3.0 | 1.0 | 1000 | $1,349 | $1.35 | 19d | 1 | 0.38mi |
| 19207 Westphalia St Detroit, MI | 4.0 | 1.0 | 1179 | $1,800 | $1.53 | 19d | 1 | 0.42mi |
| 20553 Hamburg St Detroit, MI | 3.0 | 1.0 | 1074 | $1,300 | $1.21 | 5d | 1 | 0.44mi |
| 20290 Annott St Detroit, MI | 3.0 | 1.0 | 1300 | $1,200 | $0.92 | 0d | 1 | 0.46mi |
| 19143 Fairport St Detroit, MI | 3.0 | 1.0 | 1070 | $1,225 | $1.14 | 19d | 1 | 0.51mi |
| 20242 Hickory St Detroit, MI | 3.0 | 1.0 | 747 | $1,300 | $1.74 | 13d | 1 | 0.52mi |
| 19170 Joann St Detroit, MI | 4.0 | 1.0 | 1020 | $1,400 | $1.37 | 45d | 1 | 0.53mi |
| 19220 Alcoy St Detroit, MI | 3.0 | 1.0 | 1023 | $1,350 | $1.32 | 19d | 1 | 0.53mi |
| 20227 Pelkey St Detroit, MI | 3.0 | 1.0 | 968 | $1,350 | $1.39 | 19d | 1 | 0.54mi |
| 12807 Coleen Ave Warren, MI | 3.0 | 1.0 | 1080 | $1,250 | $1.16 | 26d | 1 | 0.58mi |
| 20215 Schoenherr St Unit 1 Detroit, MI | 2.0 | 1.0 | 1000 | $1,200 | $1.20 | 19d | 1 | 0.59mi |
| 12846 Georgiana Ave Warren, MI | 3.0 | 1.0 | 912 | $1,300 | $1.43 | 26d | 1 | 0.62mi |
| 18703 Waltham St Detroit, MI | 2.0 | 1.0 | 1000 | $1,100 | $1.10 | 45d | 1 | 0.65mi |
| 18681 Barlow St Detroit, MI | 3.0 | 1.0 | 1041 | $1,400 | $1.34 | 26d | 1 | 0.67mi |
| 13669 Pfent St Detroit, MI | 3.0 | 2.0 | 1031 | $1,374 | $1.33 | 19d | 1 | 0.68mi |
| 13693 Edmore Dr Detroit, MI | 3.0 | 1.5 | 1269 | $1,550 | $1.22 | 13d | 1 | 0.72mi |
| 18624 Fairport St Unit NA Detroit, MI | 3.0 | 1.0 | 924 | $1,450 | $1.57 | 26d | 1 | 0.77mi |
| 18624 Fairport St Detroit, MI | 3.0 | 1.0 | 874 | $1,450 | $1.66 | 23d | 1 | 0.77mi |
| 21311 Waltham Rd Warren, MI | 3.0 | 1.0 | 1000 | $1,350 | $1.35 | 0d | 1 | 0.78mi |
| 13501 Vernon Ave Warren, MI | 2.0 | 1.0 | 850 | $1,300 | $1.53 | 26d | 1 | 0.84mi |
| 18119 Joann St Detroit, MI | 2.0 | 1.0 | 800 | $1,100 | $1.38 | 26d | 1 | 0.93mi |
| 13050 Couwlier Ave Warren, MI | 3.0 | 1.0 | 850 | $1,320 | $1.55 | 0d | 1 | 0.96mi |
| 14068 Carlisle St Detroit, MI | 3.0 | 1.0 | 1020 | $1,300 | $1.27 | 26d | 1 | 0.99mi |
| 11377 Sherman Ave Warren, MI | 3.0 | 1.0 | 1200 | $1,400 | $1.17 | 26d | 1 | 0.99mi |
| 14134 Collingham Dr Detroit, MI | 3.0 | 1.5 | 1300 | $1,350 | $1.04 | 45d | 1 | 1.02mi |
| 11228 Sherman Ave Warren, MI | 2.0 | 1.0 | 1000 | $1,200 | $1.20 | 14d | 1 | 1.07mi |
| 18431 Teppert St Detroit, MI | 4.0 | 1.0 | 1200 | $1,400 | $1.17 | 3d | 1 | 1.08mi |
| 13218 Greiner St Detroit, MI | 3.0 | 1.0 | 1162 | $1,195 | $1.03 | 19d | 1 | 1.08mi |
| 17851 Strasburg St Detroit, MI | 3.0 | 1.0 | 1079 | $1,100 | $1.02 | 19d | 1 | 1.09mi |
| 11513 Greiner St Unit 11521 Greiner Detroit, MI | 2.0 | 1.0 | 942 | $1,050 | $1.11 | 45d | 1 | 1.11mi |
| 14461 Lappin St Detroit, MI | 3.0 | 1.5 | 989 | $1,150 | $1.16 | 19d | 1 | 1.17mi |
| 14504 Coram St Detroit, MI | 3.0 | 1.0 | 1203 | $1,175 | $0.98 | 26d | 1 | 1.20mi |
| 14481 Maddelein St Detroit, MI | 3.0 | 1.0 | 1200 | $1,100 | $0.92 | 45d | 1 | 1.21mi |
| 11319 Chalmers Ave Warren, MI | 3.0 | 1.0 | 975 | $1,500 | $1.54 | 26d | 1 | 1.28mi |
| 8285 Rivard Ave Warren, MI | 3.0 | 1.0 | 902 | $1,549 | $1.72 | 26d | 1 | 1.37mi |
| 17241 Rowe St Detroit, MI | 3.0 | 1.5 | 1316 | $1,450 | $1.10 | 19d | 1 | 1.40mi |
Listing history 48 events
-
2026-06-18days on market $62,900 Active 28 DOM
-
2026-06-17days on market $62,900 Active 27 DOM
-
2026-06-15days on market $62,900 Active 25 DOM
-
2026-06-13days on market $62,900 Active 23 DOM
-
2026-06-13pricedays on market $62,900 Active 22 DOM
-
2026-06-09days on market $64,900 Active 19 DOM
-
2026-06-08days on market $64,900 Active 18 DOM
-
2026-06-07pricedays on market $64,900 Active 17 DOM
-
2026-06-04days on market $69,900 Active 14 DOM
-
2026-06-03days on market $69,900 Active 13 DOM
-
2026-06-02days on market $69,900 Active 12 DOM
-
2026-06-01days on market $69,900 Active 11 DOM
-
2026-05-31days on market $69,900 Active 10 DOM
-
2026-05-19historical
-
2026-04-22status Active
-
2026-04-22status Active
-
2026-04-17status Pending
-
2026-04-17status Pending
-
2026-04-17historical
-
2026-04-10historical Accepting Backup Offers
-
2026-04-10historical Active Under Contract
-
2026-03-13price $79,000
-
2026-03-12price $79,000
-
2026-02-19$85,000 Active
-
2026-02-19$85,000 Active
-
2024-09-03soldstatus $75,000
-
2024-08-23status Pending
-
2024-08-23status Pending
-
2024-08-23soldstatus $75,000 Sold
-
2024-08-23soldstatus $75,000 Closed
-
2024-06-01$75,000 Active
-
2024-06-01$75,000 Active
-
2024-05-29historical $75,000
-
2024-05-29historical $75,000
-
2024-05-28historical
-
2024-05-28historical
-
2024-03-21price $75,000
-
2024-03-21price $75,000
-
2023-12-12$78,000 Active
-
2023-12-12$78,000 Active
-
2022-03-21soldstatus $63,250
-
2008-01-25soldstatus $8,500
-
2007-10-07$12,000
-
2007-10-05historical
-
2007-10-05historical
-
2007-06-08$37,905
-
2007-06-08$37,905
-
2002-08-14soldstatus $46,000
ⓘ Source: listings_history table (triggers on properties + properties_extension) + one-shot
backfill from property_details.listing_events for pre-trigger history.
Tax reassessment forecast MI · Partial reset (capped growth)
- Current annual tax
- $2,331 · $194/mo
- Projected year-2 tax
- $2,331 · $194/mo
- Expected delta
- $0/yr ($0/mo · 0.0%)
ⓘ Screening estimate from a state-policy table — verify with the county assessor before closing.
Climate risk First Street
- Flood 1/10 Low FEMA zone X (unshaded) · 0% chance over 30 yrs
- Wildfire 1/10 Low
- Heat 3/10 Moderate 7 d/yr ≥96°F today · 15 d/yr by 30 yrs out
- Wind 2/10 Low
- Air quality 3/10 Moderate 2 unhealthy d/yr today · 5 by 30 yrs out
Nearby sold comps map
Loading sold comps map…
Walkable amenities ~0.75 mi
Loading nearby amenities…
Taxation est. · year 1
- Rental income
- $16,721
- − Mortgage interest
- −$3,523
- − Property taxes
- −$2,331
- − Insurance
- −$314
- − Repairs & maintenance
- −$1,338
- − Management
- −$1,338
- − Depreciation
- −$1,830
- Taxable income
- $6,047
- Est. tax owed @ 24.0%
- −$1,451
- After-tax cash flow
- $5,154/yr
For passive investors: Depreciation is non-cash, so a rental often shows a tax loss while cash-flowing — sheltering income. Rental losses are passive: they offset passive income freely, and up to $25,000/yr can offset ordinary (W-2) income if you actively participate and your MAGI is under $100k (phasing out to $0 by $150k); unused losses carry forward. On sale, claimed depreciation is recaptured at up to 25%, and gains may owe capital-gains tax (a 1031 exchange can defer both). Figures are a year-1 estimate at your 24.0% rate — not tax advice; consult a CPA.
Schools (NCES district)
- District
- Detroit Public Schools Community District
- NCES district ID
- 2601103
- Math proficiency
- 10% ▼ -2.00%
- Reading proficiency
- 24% ▲ 6.00%
- Median HH income
- $25,815
- Composite
- 13.06/100
- National rank
- #9564
- State rank
- #499 of 540 in MI
Livability — Detroit
- Score
- 73/100
- State rank
- #218
- US rank
- #5427
Category grades
Schools grade is shown separately in the Schools card above.
Census & demographics
- Census place
- Detroit, MI
- County
- Wayne County · 1,562,939 people
- City population
- 572,865
- Metro
- Detroit-Warren-Dearborn, MI
- Population (ZIP)
- 34,187
- Household income
- $38,966
- Rent vs Own
- Severe rent burden
- 2121.0
Population outlook (Wayne County) Hauer SSP2
- Today (2025)
- 1,675,273 people
- By 2030
- 1,620,300 · -3.3%
- By 2040
- 1,502,341 · -10.3%
- By 2050
- 1,384,039 · -17.4%
- By 2075
- 1,124,592 · -32.9%
- By 2100
- 881,193 · -47.4%
Race, ethnicity, and origin ACS 2023
- Neighborhood character
- Predominantly Black (93%)
- Race & ethnicity
- Black 93% White 3% Two or more races 2%
- Foreign-born
- 1% · Canada
- Languages at home
- 98% English-only · Spanish 1%
Political lean MEDSL · Wayne
- 2024 margin
- Strong D (+29.0) · D 62.7% · R 33.7% · Other 3.6%
- 2008→2024 swing
- -20.5pp toward R · 2008: 49.5pp · 2024: 29.0pp
- All cycles
- 2024: D+29.0 2020: D+38.1 2016: D+37.3 2012: D+46.9 2008: D+49.5
Not yet ingested
- Civics
- —
Market trends
- HPI YoY
- ▼ -91.80%
- Current HPI
- 235.0926
- Rent YoY
- ▲ 1.33%
- Metro
- Detroit-Warren-Dearborn, MI
- State GDP YoY
- ▲ 1.37%
- F500 in state
- 28
Industry mix (Fortune 500 HQ in MI)
| Industry | F500 HQs | Revenue |
|---|---|---|
| Automotive Parts | 3 | $48B |
|
||
| Automotive | 2 | $372B |
|
||
| Chemicals | 1 | $45B |
|
||
| Automotive Retail | 1 | $29B |
|
||
| Healthcare / Medical Devices | 1 | $23B |
|
||
| Automotive Technology | 1 | $20B |
|
||
Price history
+36.7% since first listed43 events — show timeline
- 2026-06-19 Listing Removed — MiRealSource-MiMLS
- 2026-06-19 Listing Removed — REALCOMP
- 2026-06-11 Price Changed $62,900 MiRealSource-MiMLS
- 2026-06-11 Price Changed $62,900 REALCOMP
- 2026-06-05 Price Changed $64,900 MiRealSource-MiMLS
- 2026-06-04 Price Changed $64,900 REALCOMP
- 2026-05-21 Listed $69,900 MiRealSource-MiMLS
- 2026-05-21 Listed $69,900 REALCOMP
- 2026-05-19 Listing Removed — MiRealSource-MiMLS
- 2026-04-22 Relisted — MiRealSource-MiMLS
- 2026-04-22 Relisted — REALCOMP
- 2026-04-17 Pending — MiRealSource-MiMLS
- 2026-04-17 Pending — REALCOMP
- 2026-04-17 Listing Removed — REALCOMP
- 2026-04-10 Contingent — MiRealSource-MiMLS
- 2026-04-10 Contingent — REALCOMP
- 2026-03-13 Price Changed $79,000 MiRealSource-MiMLS
- 2026-03-12 Price Changed $79,000 REALCOMP
- 2026-02-19 Listed $85,000 REALCOMP
- 2026-02-19 Listed $85,000 MiRealSource-MiMLS
- 2024-09-03 Sold (Public Records) $75,000 Public Records
- 2024-08-23 Pending — MiRealSource-MiMLS
- 2024-08-23 Pending — REALCOMP
- 2024-08-23 Sold (MLS) $75,000 MiRealSource-MiMLS
- 2024-08-23 Sold (MLS) $75,000 REALCOMP
- 2024-06-01 Listed $75,000 MiRealSource-MiMLS
- 2024-06-01 Listed $75,000 REALCOMP
- 2024-05-29 Coming Soon $75,000 MiRealSource-MiMLS
- 2024-05-29 Coming Soon $75,000 REALCOMP
- 2024-05-28 Listing Removed — MiRealSource-MiMLS
- 2024-05-28 Listing Removed — REALCOMP
- 2024-03-21 Price Changed $75,000 MiRealSource-MiMLS
- 2024-03-21 Price Changed $75,000 REALCOMP
- 2023-12-12 Listed $78,000 MiRealSource-MiMLS
- 2023-12-12 Listed $78,000 REALCOMP
- 2022-03-21 Sold (Public Records) $63,250 Public Records
- 2008-01-25 Sold (MLS) $8,500 REALCOMP
- 2007-10-07 Listed $12,000 REALCOMP
- 2007-10-05 Listing Removed — REALCOMP
- 2007-10-05 Listing Removed — MiRealSource-MiMLS
- 2007-06-08 Listed $37,905 REALCOMP
- 2007-06-08 Listed $37,905 MiRealSource-MiMLS
- 2002-08-14 Sold (Public Records) $46,000 Public Records
Property tax history
+2.2%/yrLatest (2025): $2,331 · +91.0% YoY. Source: county tax records.
Cash-flow waterfall
monthlySold comps — $/sqft
last 12 mo · ≤1 miLoading sold comps…