 Fourplex
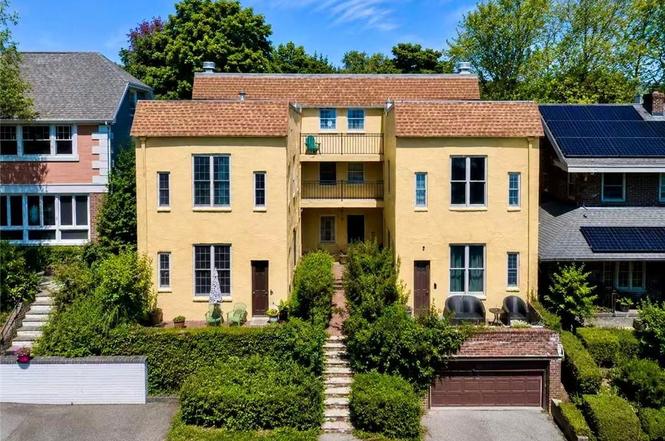
48 Tompkins Cir · New York, NY
Flood risk 1/10 · Minimal
- FEMA flood zone
- X (unshaded)
- Chance of flooding over 30 yrs
- 0.0%
- Est. flood insurance / yr
- $507 – $1,088
Fire risk 1/10 · Minimal
- Est. fire insurance / yr
- $691 – $1,283
Heat risk 7/10 · Major
- Hot days now (above 98°F)
- 7 days/yr
- Hot days in 30 yrs
- 16 days/yr
Wind risk 6/10 · Moderate
- Chance of severe wind over 30 yrs
- 52.0%
Air-quality risk 4/10 · Minor
- Unhealthy air days now
- 5 days/yr
- Unhealthy air days in 30 yrs
- 7 days/yr
Risk factors via First Street. Map © Google.
Why this score? — see what drove the C- grade
The composite is a weighted blend of 9 inputs, each scored 0–100. Each bar is that input's sub-score; the figure is the points it added to the 100-point composite (weight × sub-score).
- Cash flow +19.9/30.0
- ARV discount +7.5/15.0
- DSCR +6.3/10.0
- 1% rule +5.4/10.0
- Schools +5.0/10.0
- Rent growth +4.0/5.0
- Livability +3.8/5.0
- Condition / age +2.5/5.0
- Appreciation +0.0/10.0
$1,595,000
🖨 Deal sheet (PDF) 📄 Offer letter ✓ Due diligence
Multi-family units
County records classify this as Multi-Family (2-4 Unit). Listing-text estimate: 4 units. confirmed
Listing remarks MLS
Welcome to 48 Tompkins Circle, a truly one-of-a-kind income-producing property perched on one of Staten Island's most desirable hilltop locations. This newly renovated, move-in-ready FOUR family residence offers spectacular panoramic views of the Manhattan skyline, New York Harbor, and the iconic Verrazzano-Narrows Bridge from multiple vantage points throughout the property. Featuring soaring ceilings exceeding 11 feet, the home is filled with natural light and showcases a rare combination of historic character and modern upgrades. Every detail has been thoughtfully updated, creating an exceptional living experience for both owners and tenants. An outstanding investment opportunity, this high-income-producing property offers strong cash flow potential while benefiting from its prime location near the Staten Island Ferry, Empire Outlets, waterfront attractions, shopping, dining, and public transportation. Whether you're an investor seeking a turnkey asset or an owner-occupant looking to offset expenses with rental income, this property delivers unmatched views, impressive scale, and exceptional value. Rarely does a property combine breathtaking views, premium renovations, oversized living spaces, and strong income potential in one extraordinary offering. Don't miss this opportunity to own a landmark investment on Staten Island's North Shore.
Key facts
- Modern upgrades
- Panoramic views
- Historic character
Tags
Property features AI
Finance
- Other: Listing broker: Ashford Homes LLC
- Financial info: Monthly rent: Unit 1 listed at $2,000; Monthly rent: Unit 4 listed at $2,370; Total of 4 rental units
Exterior
- Parking: Attached 1-car garage; Off-street and on-street parking available
- Utilities: 110V electric; Public water and sewer (standard utilities implied)
- Home design: Multifamily property with 4 units; 3 stories
- Construction: Stucco construction; Building area about 5,000; Year built listed as approximate
- Exterior features: Balcony; Lot approximately 0.14 acres (50 x 60); Zoned R3-1
Interior
- Bedrooms: Unit 1: 1 bedroom (level 1); Unit 2: 1 bedroom (level 1); Unit 3: 2 bedrooms (level 2); Unit 4: 2 bedrooms (level 2)
- Bathrooms: 4 full bathrooms; 2 half bathrooms (6 total bathrooms)
- Heating & cooling: Natural gas heating; Hot water heating; Cooling provided by units
- Interior features: Window air conditioning units; Good property condition
Neighborhood map
What this means for you Summary
Snapshot
- This is a 4 × 6-bed/5.0-bath units multifamily listed at $1.59M.
Deal economics
- At list price, monthly cash flow is $2k ($23k/yr) — positive. Per door: $483/mo.
- The deal already cash-flows at list — no discount required.
- Meets the 1% rule at list price ($17k rent vs $1.59M).
- Cap rate 7.7% vs local median 2.6% in New York — top-decile yield for the area; either an underpriced asset or a hidden risk that comps aren't pricing in. Stress-test before assuming the spread holds.
Location & tenants
- Location reads 75/100 on livability (#268 in NY, #4,188 nationally) — a middle-class / working-renter tenant base. Strengths: amenities A+, commute A+, health & safety A; Watch: crime F, cost of living F.
- Zoned schools: Elm Tree Elementary School (math 27% / reading 52%, grade F, #1,444 of 2,108 statewide, top 71%, 806 students, 94% FRL); Is 61 William A Morris (math 22% / reading 57%, grade F, #418 of 729 statewide, top 59%, 932 students, 84% FRL); Midwood High School (math 94% / reading 96%, grade A+, #83 of 1,100 statewide, top 8%, 4,062 students, 73% FRL).
- Market conditions: Rents rising fast (+6.1%/yr); 265 active listings in the ZIP; solid renter incomes; 480 units permitted in Richmond County in 2024 (22 in 5+ unit buildings).
- At $16,603/mo this rent would consume 233% of the median local household income ($86k/yr) (locally 2008% of renters already pay >50% of income on rent) — very limited rent-growth headroom before tenants either downsize or default.
Forward outlook
- Local home prices are declining (-3.0%/yr); year-one equity from $11k of loan paydown is wiped out by about $48k of value loss. Plan a longer hold.
- Richmond County population projected to shrink 5% by 2050 — rents likely to lag national; underwrite the cash flow, not the appreciation.
Negotiation context
- Only 11 days on market — expect competitive offers; lowballing is unlikely to land.
- 2 sale attempts with the ask held roughly flat each time — persistent listings suggest the price (not the market) is what's stuck; bring a comps-based counter.
- Current owner paid $250k; list at $1.59M implies a 538% gain — meaningful room to come down on a strong offer.
Risks & watch-outs
- Watch-outs: built in 1933 — expect roof / HVAC / electrical / plumbing capex.
- Climate carrying-cost: major wind risk, 52% chance of damaging wind over 30y; extreme-heat days projected 7→16/yr by 2055 (HVAC capex compounding) — expect insurance premiums to compound above CPI over the hold.
Questions for the listing agent
- Can we see the unit-by-unit rent roll, current vacancy, and any below-market leases? What's the average tenancy length?
- What capital expenditures (roof, boiler, parking lot, exteriors) have been made in the last 5 years, and what's planned in the next 2?
- Built in 1933 — when were the roof, HVAC, electrical panel, plumbing, and water heater last replaced?
- Is there a deadline driving the sale (1031 exchange, divorce, estate, relocation)? That informs how much negotiation room exists.
- Schools are B-rated — typically a magnet for longer-tenancy family renters. What's the average tenant stay here, and is there a school-zone premium baked into asking?
- Crime grade is F in this area — have there been break-ins, vandalism, or insurance claims at this property in the last 3 years? What carrier currently insures it and at what premium?
- What's the average days-on-market for RENTAL listings here right now (not sales)? A rising rental-DOM trend means longer vacancies and softer asking-rent achievability than the comps imply.
- What's the recent tenant-quality profile in this submarket — average credit score on applications, eviction rate, late-payment / NSF rate, and stable-employment percentage? A property-management company in the area should have these aggregated.
- How much new apartment / multifamily construction is in the pipeline within 1–3 miles? Heavy new supply (>2% of stock underway) typically softens rents 12–24 months out; light construction supports rent growth.
Investment metrics
- 1% rule
- 1.04% ✓
- Cap rate
- 7.75%
- Cash-on-cash
- 5.19%
- DSCR
- 1.23
- GRM
- 8.0
CMA / ARV
No comps found within radius.
Projected returns pro-forma
-3.0% appreciation · 6.07% rent growth · sell at horizon
- IRR
- -4.8%
- Equity multiple
- 0.82×
- Total profit
- $-82,252
- Equity at exit
- $237,820
- IRR
- 8.2%
- Equity multiple
- 1.71×
- Total profit
- $319,216
- Equity at exit
- $137,906
Cash invested: $446,600 (down + closing). Projections, not guarantees.
Landlord ↔ Tenant lean methodology
- Overall (CITY)
- 0 Strongly Tenant-Friendly
- State New York
- 15 Strongly Tenant-Friendly · D+10
- County
- — inherits STATE
- City New York
- 0 Strongly Tenant-Friendly · D+34
ZIP-level market 10301
- Rents YoY
- 6.1%
- Active inventory
- 265
- Price-to-rent
- 32.0×
Monthly cashflow live
- Estimated rent
- $16,603 medium interval (Pro) →
- Mortgage (P&I)
- −$8,364
- Tax from tax record
- −$2,156 /mo · $25,875/yr
- Insurance
- −$665
- HOA
- −$0
- Vacancy / Maint / Mgmt
- −$3,487
- Net cashflow
- $1,931
Break-even live
Sensitivity live
| Price | -10% $2,834 | -5% $2,383 | +0% $1,931 | +5% $1,480 | +10% $1,028 |
|---|---|---|---|---|---|
| Rent | -10% $620 | -5% $1,275 | +0% $1,931 | +5% $2,587 | +10% $3,243 |
| Rate | -1.0pp $2,734 | -0.5pp $2,337 | base $1,931 | +0.5pp $1,518 | +1.0pp $1,097 |
4-unit breakdown (identical units grouped — click to expand)
| Units | Beds | Baths | Est. rent |
|---|---|---|---|
| 4× units | 6 | 5 | $16,604 |
| #1 | 6 | 5 | $4,151 |
| #2 | 6 | 5 | $4,151 |
| #3 | 6 | 5 | $4,151 |
| #4 | 6 | 5 | $4,151 |
| Total (4 units) | $16,603 | ||
UW: 25.0% down · 7.5% · 30yr · 1.5% tax · 5.0% vac · 8.0% maint · 8.0% mgmt
Financing live
Cash to close
- Down payment
- $398,750
- Closing costs
- $47,850
- Reserves months
- —
- Total cash needed
- —
Loan-product check · same deal, 3 products live
Conventional
25% down · 7.5% · 30yr
- Down + closing
- —
- Monthly P&I
- —
- Monthly cashflow
- —
- DSCR
- —
- Eligible?
- —
Personal DTI + credit; lowest rate.
DSCR
20% down · 8.5% · 30yr
- Down + closing
- —
- Monthly P&I
- —
- Monthly cashflow
- —
- DSCR
- —
- Eligible?
- —
No personal income docs; deal must DSCR.
Hard money
10% down · 12.0% · 12mo
- Down + closing
- —
- Monthly P&I
- —
- Monthly cashflow
- —
- DSCR
- —
- Eligible?
- —
Short-term bridge; refi at stabilization.
Listing history 7 events
-
2026-06-21days on market $1,595,000 Active 11 DOM
-
2026-06-18days on market $1,595,000 Active 8 DOM
-
2026-06-17days on market $1,595,000 Active 7 DOM
-
2026-06-16days on market $1,595,000 Active 6 DOM
-
2026-06-15days on market $1,595,000 Active 5 DOM
-
2026-06-13remarks 699-char remark
-
2026-06-13$1,595,000 Active 3 DOM
ⓘ Source: listings_history table (triggers on properties + properties_extension) + one-shot
backfill from property_details.listing_events for pre-trigger history.
Tax reassessment forecast NY · Partial reset (capped growth)
- Current annual tax
- $25,875 · $2,156/mo
- Projected year-2 tax
- $26,415 · $2,201/mo
- Expected delta
- +$540/yr (+$45/mo · 2.1%)
ⓘ Screening estimate from a state-policy table — verify with the county assessor before closing.
Climate risk First Street
- Flood 1/10 Low FEMA zone X (unshaded) · 0% chance over 30 yrs
- Wildfire 1/10 Low
- Heat 7/10 Severe 7 d/yr ≥98°F today · 16 d/yr by 30 yrs out
- Wind 6/10 Major 52% chance of damaging wind over 30 yrs
- Air quality 4/10 Moderate 5 unhealthy d/yr today · 7 by 30 yrs out
Nearby sold comps map
Loading sold comps map…
Walkable amenities ~0.75 mi
Loading nearby amenities…
Taxation est. · year 1
- Rental income
- $199,236
- − Mortgage interest
- −$89,345
- − Property taxes
- −$25,875
- − Insurance
- −$7,975
- − Repairs & maintenance
- −$15,939
- − Management
- −$15,939
- − Depreciation
- −$46,400
- Taxable loss
- −$2,237
- Est. tax savings @ 24.0%
- +$537
- After-tax cash flow
- $23,711/yr
For passive investors: Depreciation is non-cash, so a rental often shows a tax loss while cash-flowing — sheltering income. Rental losses are passive: they offset passive income freely, and up to $25,000/yr can offset ordinary (W-2) income if you actively participate and your MAGI is under $100k (phasing out to $0 by $150k); unused losses carry forward. On sale, claimed depreciation is recaptured at up to 25%, and gains may owe capital-gains tax (a 1031 exchange can defer both). Figures are a year-1 estimate at your 24.0% rate — not tax advice; consult a CPA.
Schools (NCES district)
No district data.
Livability — New York
- Score
- 75/100
- State rank
- #268
- US rank
- #4188
Category grades
Schools grade is shown separately in the Schools card above.
Census & demographics
- Census place
- New York, NY
- County
- Richmond County · 404,174 people
- City population
- 7,731,280
- Metro
- New York-Newark-Jersey City, NY-NJ-PA
- Population (ZIP)
- 41,052
- Household income
- $85,609
- Rent vs Own
- Severe rent burden
- 2008.0
Population outlook (Richmond County) Hauer SSP2
- Today (2025)
- 482,784 people
- By 2030
- 481,831 · -0.2%
- By 2040
- 473,159 · -2.0%
- By 2050
- 457,242 · -5.3%
- By 2075
- 408,029 · -15.5%
- By 2100
- 341,459 · -29.3%
Race, ethnicity, and origin ACS 2023
- Neighborhood character
- Highly diverse neighborhood (Simpson 0.72)
- Race & ethnicity
- White 37% Hispanic / Latino 29% Black 23% Two or more races 16% Asian 7%
- Hispanic origin (detail)
- Mexican 5% Puerto Rican 10% Cuban 2% Dominican 6%
- Common ancestry
- Romanian 3% Scotch-Irish 2% Italian 1%
- Foreign-born
- 22% · Canada, China, Jamaica
- Languages at home
- 68% English-only · Spanish 16% Other Indo-European 5% Russian/Polish/Slavic 3%
Political lean MEDSL · Richmond
- 2024 margin
- Strong R (+29.8) · D 35.1% · R 64.9%
- 2008→2024 swing
- -25.7pp toward R · 2008: -4.0pp · 2024: -29.8pp
- All cycles
- 2024: R+29.8 2020: R+14.9 2016: R+16.8 2012: D+0.8 2008: R+4.0
Not yet ingested
- Civics
- —
Market trends
- HPI YoY
- ▼ -407.37%
- Current HPI
- 319.0616
- Rent YoY
- ▲ 6.07%
- Metro
- New York-Newark-Jersey City, NY-NJ-PA
- State GDP YoY
- ▲ 2.60%
- F500 in state
- 92
Industry mix (Fortune 500 HQ in NY)
| Industry | F500 HQs | Revenue |
|---|---|---|
| Financial Services | 10 | $950B |
|
||
| Consumer Goods | 9 | $162B |
|
||
| Insurance | 4 | $225B |
|
||
| Telecommunications | 2 | $144B |
|
||
| Pharmaceuticals | 2 | $112B |
|
||
| Media / Entertainment | 2 | $69B |
|
||
Price history
+538.0% since first listed3 events — show timeline
- 2026-06-10 Listed $1,595,000 BNYMLS
- 2026-06-10 Listed $1,595,000 SIBORMLS
- 1995-09-06 Sold (Public Records) $250,000 Public Records
Property tax history
+5.9%/yrLatest (2025): $25,875 · +8.0% YoY. Source: county tax records.
Cash-flow waterfall
monthlySold comps — $/sqft
last 12 mo · ≤1 miLoading sold comps…