 Duplex
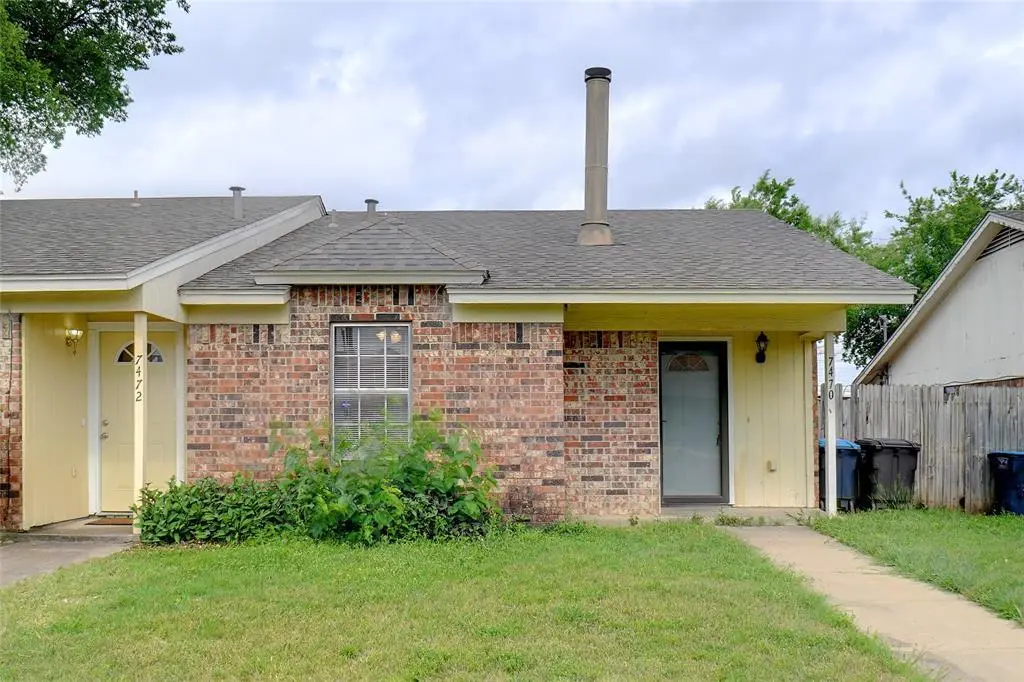
7470 Tiffany Meadows Ln · Fort Worth, TX
Flood risk 1/10 · Minimal
- FEMA flood zone
- X (unshaded)
- Chance of flooding over 30 yrs
- 0.0%
- Est. flood insurance / yr
- $507 – $1,088
Fire risk 5/10 · Moderate
- Est. fire insurance / yr
- $1,222 – $2,270
Heat risk 7/10 · Major
- Hot days now (above 110°F)
- 7 days/yr
- Hot days in 30 yrs
- 25 days/yr
Wind risk 4/10 · Minor
- Chance of severe wind over 30 yrs
- 24.0%
Air-quality risk 3/10 · Minor
- Unhealthy air days now
- 2 days/yr
- Unhealthy air days in 30 yrs
- 3 days/yr
Risk factors via First Street. Map © Google.
Why this score? — see what drove the C grade
The composite is a weighted blend of 9 inputs, each scored 0–100. Each bar is that input's sub-score; the figure is the points it added to the 100-point composite (weight × sub-score).
- Cash flow +22.7/30.0
- ARV discount +11.8/15.0
- DSCR +7.3/10.0
- 1% rule +6.2/10.0
- Livability +4.0/5.0
- Rent growth +2.5/5.0
- Condition / age +2.5/5.0
- Schools +2.3/10.0
- Appreciation +0.0/10.0
$289,900
🖨 Deal sheet (PDF) 📄 Offer letter ✓ Due diligence
Multi-family units
County records classify this as Multi-Family (2-4 Unit). Listing-text estimate: 2 units. confirmed
Listing remarks MLS
Amazing investment opportunity! Full duplex; Each side has 2 bedrooms, 1 bath with long term tenants. Updates complete to 7472 prior to leasing to current tenants. Great location! MULTIPLE OFFERS;
Key facts
- Income potential
- Stable tenancy
- Turnkey addition
Tags
Property features AI
Finance
- Other: No smoking tenancy restriction; Listing accepts cash and conventional financing
- Financial info: Property listed as residential income (duplex); 2 total units; 1 building; Gross annual income reported; Operating expenses include insurance and professional management; No net operating income or insurance expense reported
- HOA & community: No association
Exterior
- Parking: 4 parking spaces; Parking pad with alley access; Side-by-side parking
- Security: Smoke detectors
- Utilities: City water; City sewer; Electricity connected; Not in a municipal utility district
- Home design: Duplex (residential income); One story; Built in 1984
- Construction: Brick and siding exterior; Composition roof; Slab foundation
- Exterior features: Private yard; Covered patio/porch; Storage; Chain link fencing; Interior lot
Interior
- Kitchen: Dishwasher; Disposal; Electric range
- Bedrooms: 4 bedrooms (single-story home)
- Flooring: Ceramic tile; Laminate
- Bathrooms: 3 full bathrooms
- Heating & cooling: Central heating (electric); Central air conditioning (electric); Ceiling fans
- Interior features: High-speed internet available; Pantry; Vented exhaust fan
Neighborhood map
What this means for you Summary
Snapshot
- This is a 2 × 2-bed/1.5-bath units multifamily listed at $290k.
Deal economics
- At list price, monthly cash flow is $497 ($6k/yr) — positive. Per door: $248/mo.
- The deal already cash-flows at list — no discount required.
- Meets the 1% rule at list price ($3k rent vs $290k).
- Recommended offer: $281k (3.0% below list) — sets the bar for market timing.
- Cap rate 8.3% vs local median 3.9% in Fort Worth — top-decile yield for the area; either an underpriced asset or a hidden risk that comps aren't pricing in. Stress-test before assuming the spread holds.
Location & tenants
- Location reads 80/100 on livability (#49 in TX, #1,954 nationally) — a professional / high-income tenant draw. Strengths: amenities A+, cost of living A+, housing A+; Watch: crime F.
- Everman ISD (suburban): math 21% / reading 32% proficiency, ranked #691 of 826 in TX (top 84%) — low school quality limits family demand, transient renter base, plan for 1-2y turnover; 77% free/reduced lunch — lower-income household profile, screen leases tightly.
- Zoned schools: Bishop El (math 30% / reading 33%, grade F, #2,396 of 4,322 statewide, top 56%, 391 students, 93% FRL); Charles Baxter J H (math 19% / reading 34%, grade F, #1,200 of 1,662 statewide, top 73%, 769 students, 94% FRL); Everman H S (math 15% / reading 35%, grade F, #1,250 of 1,632 statewide, top 77%, 1,740 students, 92% FRL) — zoned schools average 93% FRL vs 77% district-wide (16 pts higher); higher-poverty schools than district average — tighter screening recommended.
- Market conditions: Rents flat; 390 active listings in the ZIP; 15 comparable units currently listed for rent nearby; rentals at typical pace (median 24d on market — plan ~3-4 weeks tenant-placement turnaround); 40% of comp listings sitting > 30 days — soft ceiling on asking rent; solid renter incomes; 18,938 units permitted in Tarrant County in 2024 (8,336 in 5+ unit buildings).
- At $3,241/mo this rent would consume 51% of the median local household income ($76k/yr) (locally 1264% of renters already pay >50% of income on rent) — very limited rent-growth headroom before tenants either downsize or default.
Forward outlook
- Local home prices are declining (-3.0%/yr); year-one equity from $2k of loan paydown is wiped out by about $9k of value loss. Plan a longer hold.
- Tarrant County population projected at +41% by 2050 — long-run rental-demand tailwind backs the buy-and-hold thesis.
Negotiation context
- It's been on market 43 days — a 3% lower offer ($281k) is reasonable based on typical stale-listing flexibility.
- 7 sale attempts since 14y ago with the ask held roughly flat each time — persistent listings suggest the price (not the market) is what's stuck; bring a comps-based counter.
Risks & watch-outs
- Climate carrying-cost: moderate wildfire risk; extreme-heat days projected 7→25/yr by 2055 (HVAC capex compounding) — expect insurance premiums to compound above CPI over the hold.
Questions for the listing agent
- It's been on market 43 days. Have you received any prior offers? Is the seller open to a 3% concession, seller financing, or rate buy-down credit?
- Can we see the unit-by-unit rent roll, current vacancy, and any below-market leases? What's the average tenancy length?
- What capital expenditures (roof, boiler, parking lot, exteriors) have been made in the last 5 years, and what's planned in the next 2?
- Is there a deadline driving the sale (1031 exchange, divorce, estate, relocation)? That informs how much negotiation room exists.
- Schools are D-rated, which usually means shorter tenancies and higher turnover. Who's the typical renter profile here, and what's been the actual vacancy rate?
- Crime grade is F in this area — have there been break-ins, vandalism, or insurance claims at this property in the last 3 years? What carrier currently insures it and at what premium?
- What's the average days-on-market for RENTAL listings here right now (not sales)? A rising rental-DOM trend means longer vacancies and softer asking-rent achievability than the comps imply.
- What's the recent tenant-quality profile in this submarket — average credit score on applications, eviction rate, late-payment / NSF rate, and stable-employment percentage? A property-management company in the area should have these aggregated.
- How much new apartment / multifamily construction is in the pipeline within 1–3 miles? Heavy new supply (>2% of stock underway) typically softens rents 12–24 months out; light construction supports rent growth.
Investment metrics
- 1% rule
- 1.12% ✓
- Cap rate
- 8.35%
- Cash-on-cash
- 7.34%
- DSCR
- 1.33
- GRM
- 7.5
CMA / ARV
- ARV (median comp)
- $320,910
- List price
- $289,900
- Delta
- -9.66%
- Verdict
- FAIR
- Comps
- 8 within 1.0 mi
Show comp detail 1 sale within ~0.75 mi
| Address | Dist | Beds/Ba | Sqft | Sold | Price | $/sf | Match |
|---|---|---|---|---|---|---|---|
| 7479 Tiffany Meadows Ln | 0.04mi | 4/3.0 | 2,185 (+0%) | 14mo | $275,000 | $126 | 82 |
Match score weights: distance 35% · size 25% · config 20% · recency 20%. Top-matched comps best support the ARV.
Projected returns pro-forma
-3.0% appreciation · 0.11% rent growth · sell at horizon
- IRR
- -8.4%
- Equity multiple
- 0.70×
- Total profit
- $-24,412
- Equity at exit
- $43,225
- IRR
- -3.3%
- Equity multiple
- 0.81×
- Total profit
- $-15,646
- Equity at exit
- $25,065
Cash invested: $81,172 (down + closing). Projections, not guarantees.
Landlord ↔ Tenant lean methodology
- Overall (STATE)
- 87 Strongly Landlord-Friendly
- State Texas
- 87 Strongly Landlord-Friendly · R+5
- County
- — inherits STATE
- City
- — inherits STATE
ZIP-level market 76140
- Home prices YoY
- -21.8%
- Rents YoY
- 0.1%
- Active inventory
- 390
- Price-to-rent
- 14.9×
Monthly cashflow live
- Estimated rent
- $3,241 high interval (Pro) →
- Mortgage (P&I)
- −$1,520
- Tax from tax record
- −$423 /mo · $5,071/yr
- Insurance
- −$121
- HOA
- −$0
- Vacancy / Maint / Mgmt
- −$681
- Net cashflow
- $497
Break-even live
Sensitivity live
| Price | -10% $661 | -5% $579 | +0% $497 | +5% $415 | +10% $333 |
|---|---|---|---|---|---|
| Rent | -10% $241 | -5% $369 | +0% $497 | +5% $625 | +10% $753 |
| Rate | -1.0pp $643 | -0.5pp $570 | base $497 | +0.5pp $422 | +1.0pp $345 |
2-unit breakdown (identical units grouped — click to expand)
| Units | Beds | Baths | Est. rent |
|---|---|---|---|
| 2× units | 2 | 1.5 | $3,240 |
| #1 | 2 | 1.5 | $1,620 |
| #2 | 2 | 1.5 | $1,620 |
| Total (2 units) | $3,241 | ||
UW: 25.0% down · 7.5% · 30yr · 1.5% tax · 5.0% vac · 8.0% maint · 8.0% mgmt
Financing live
Cash to close
- Down payment
- $72,475
- Closing costs
- $8,697
- Reserves months
- —
- Total cash needed
- —
Loan-product check · same deal, 3 products live
Conventional
25% down · 7.5% · 30yr
- Down + closing
- —
- Monthly P&I
- —
- Monthly cashflow
- —
- DSCR
- —
- Eligible?
- —
Personal DTI + credit; lowest rate.
DSCR
20% down · 8.5% · 30yr
- Down + closing
- —
- Monthly P&I
- —
- Monthly cashflow
- —
- DSCR
- —
- Eligible?
- —
No personal income docs; deal must DSCR.
Hard money
10% down · 12.0% · 12mo
- Down + closing
- —
- Monthly P&I
- —
- Monthly cashflow
- —
- DSCR
- —
- Eligible?
- —
Short-term bridge; refi at stabilization.
Rent comps 15 comps
| Address | Beds | Baths | Sqft | Rent | $/sqft | DOM | Units | Dist |
|---|---|---|---|---|---|---|---|---|
| 3022 Autumn Run Dr Forest Hill, TX | 4.0 | 2.0 | 1690 | $1,979 | $1.17 | 24d | 1 | 0.39mi |
| 111 Arango Way Fort Worth, TX | 4.0 | 2.5 | 2039 | $2,445 | $1.20 | 9d | 1 | 0.55mi |
| 514 Thompson Pl Fort Worth, TX | 4.0 | 2.5 | 1687 | $2,155 | $1.28 | 45d | 1 | 0.61mi |
| 3401 Heritage Ln Forest Hill, TX | 3.0 | 2.5 | 1400 | $1,799 | $1.28 | 14d | 1 | 0.77mi |
| 3311 Brambleton Hill Pl Forest Hill, TX | 3.0 | 2.5 | 1400 | $1,799 | $1.28 | 19d | 1 | 0.79mi |
| 3137 Evangeline Rd Fort Worth, TX | 3.0 | 2.0 | 1637 | $1,995 | $1.22 | 45d | 1 | 0.79mi |
| 108 Rosings Pl Fort Worth, TX | 4.0 | 2.5 | 1753 | $2,100 | $1.20 | 45d | 1 | 0.80mi |
| 3319 Brambleton Hill Pl Forest Hill, TX | 3.0 | 2.5 | 1400 | $1,799 | $1.28 | 45d | 1 | 0.81mi |
| 3331 Brambleton Hill Pl Forest Hill, TX | 3.0 | 2.5 | 1400 | $1,850 | $1.32 | 9d | 1 | 0.83mi |
| 3148 Evangeline Rd Fort Worth, TX | 3.0 | 2.0 | 1703 | $1,974 | $1.16 | 22d | 1 | 0.83mi |
| 7299 Forest Hill Dr Forest Hill, TX | 3.0 | 2.0 | 1402 | $1,850 | $1.32 | 26d | 1 | 0.85mi |
| 7299 Forest Hill Dr Forest Hill, TX | 3.0 | 2.0 | 1400 | $1,799 | $1.28 | 45d | 1 | 0.85mi |
| 7012 Candlewick Ct Forest Hill, TX | 3.0 | 2.0 | 1615 | $1,850 | $1.15 | 0d | 1 | 1.12mi |
| 3733 Cecelia Ln Forest Hill, TX | 3.0 | 2.0 | 1951 | $2,460 | $1.26 | 20d | 1 | 1.26mi |
| 1100 Marlene Dr Fort Worth, TX | 3.0 | 2.0 | 1468 | $1,950 | $1.33 | 45d | 1 | 1.50mi |
Listing history 25 events
-
2026-06-04status $289,900 Pending 43 DOM
-
2026-06-03days on market $289,900 Active Option Contract 43 DOM
-
2026-06-02days on market $289,900 Active Option Contract 42 DOM
-
2026-06-01days on market $289,900 Active Option Contract 41 DOM
-
2026-05-31days on market $289,900 Active Option Contract 40 DOM
-
2026-04-21$299,900 Active 443-char remark
-
2025-04-15historical $1,495
-
2025-03-15$1,495
-
2022-06-28soldstatus
-
2022-06-27soldstatus Closed 197-char remark
Show marketing remark (197 chars)
Amazing investment opportunity! Full duplex; Each side has 2 bedrooms, 1 bath with long term tenants. Updates complete to 7472 prior to leasing to current tenants. Great location! MULTIPLE OFFERS;
-
2022-06-01status Pending 197-char remark
Show marketing remark (197 chars)
Amazing investment opportunity! Full duplex; Each side has 2 bedrooms, 1 bath with long term tenants. Updates complete to 7472 prior to leasing to current tenants. Great location! MULTIPLE OFFERS;
-
2022-05-13$225,000 Active 197-char remark
Show marketing remark (197 chars)
Amazing investment opportunity! Full duplex; Each side has 2 bedrooms, 1 bath with long term tenants. Updates complete to 7472 prior to leasing to current tenants. Great location! MULTIPLE OFFERS;
-
2017-05-10soldstatus
-
2017-05-08soldstatus Sold
Show marketing remark (268 chars)
Great Investment Property! Full duplex two units 7470 and 7472 long term tenants who want to stay forever, 7470 over 5 years and 7472 over 32 years. The rents are below market, but both leases are month to month current market rents are approximately $845.00 to 875.00
-
2017-04-21status Pending
Show marketing remark (268 chars)
Great Investment Property! Full duplex two units 7470 and 7472 long term tenants who want to stay forever, 7470 over 5 years and 7472 over 32 years. The rents are below market, but both leases are month to month current market rents are approximately $845.00 to 875.00
-
2017-03-28status Active
Show marketing remark (268 chars)
Great Investment Property! Full duplex two units 7470 and 7472 long term tenants who want to stay forever, 7470 over 5 years and 7472 over 32 years. The rents are below market, but both leases are month to month current market rents are approximately $845.00 to 875.00
-
2017-03-21historical Active Option Contract
Show marketing remark (268 chars)
Great Investment Property! Full duplex two units 7470 and 7472 long term tenants who want to stay forever, 7470 over 5 years and 7472 over 32 years. The rents are below market, but both leases are month to month current market rents are approximately $845.00 to 875.00
-
2017-02-06status Active
Show marketing remark (268 chars)
Great Investment Property! Full duplex two units 7470 and 7472 long term tenants who want to stay forever, 7470 over 5 years and 7472 over 32 years. The rents are below market, but both leases are month to month current market rents are approximately $845.00 to 875.00
-
2017-02-03historical Active Option Contract
Show marketing remark (268 chars)
Great Investment Property! Full duplex two units 7470 and 7472 long term tenants who want to stay forever, 7470 over 5 years and 7472 over 32 years. The rents are below market, but both leases are month to month current market rents are approximately $845.00 to 875.00
-
2017-01-11$155,000 Active
Show marketing remark (268 chars)
Great Investment Property! Full duplex two units 7470 and 7472 long term tenants who want to stay forever, 7470 over 5 years and 7472 over 32 years. The rents are below market, but both leases are month to month current market rents are approximately $845.00 to 875.00
-
2013-05-31historical
-
2012-10-21$89,500 Active
-
2004-03-08soldstatus
-
2000-12-27soldstatus
-
1995-11-22soldstatus
ⓘ Source: listings_history table (triggers on properties + properties_extension) + one-shot
backfill from property_details.listing_events for pre-trigger history.
Tax reassessment forecast TX · Resets to sale price
- Current annual tax
- $5,071 · $423/mo
- Projected year-2 tax
- $5,305 · $442/mo
- Expected delta
- +$234/yr (+$20/mo · 4.6%)
ⓘ Screening estimate from a state-policy table — verify with the county assessor before closing.
Climate risk First Street
- Flood 1/10 Low FEMA zone X (unshaded) · 0% chance over 30 yrs
- Wildfire 5/10 Major
- Heat 7/10 Severe 7 d/yr ≥110°F today · 25 d/yr by 30 yrs out
- Wind 4/10 Moderate 24% chance of damaging wind over 30 yrs
- Air quality 3/10 Moderate 2 unhealthy d/yr today · 3 by 30 yrs out
Nearby sold comps map
Loading sold comps map…
Walkable amenities ~0.75 mi
Loading nearby amenities…
Taxation est. · year 1
- Rental income
- $38,892
- − Mortgage interest
- −$16,239
- − Property taxes
- −$5,071
- − Insurance
- −$1,450
- − Repairs & maintenance
- −$3,111
- − Management
- −$3,111
- − Depreciation
- −$8,433
- Taxable income
- $1,476
- Est. tax owed @ 24.0%
- −$354
- After-tax cash flow
- $5,607/yr
For passive investors: Depreciation is non-cash, so a rental often shows a tax loss while cash-flowing — sheltering income. Rental losses are passive: they offset passive income freely, and up to $25,000/yr can offset ordinary (W-2) income if you actively participate and your MAGI is under $100k (phasing out to $0 by $150k); unused losses carry forward. On sale, claimed depreciation is recaptured at up to 25%, and gains may owe capital-gains tax (a 1031 exchange can defer both). Figures are a year-1 estimate at your 24.0% rate — not tax advice; consult a CPA.
Schools (NCES district)
- District
- Everman ISD
- NCES district ID
- 4818810
- Math proficiency
- 21% ▼ -18.00%
- Reading proficiency
- 32% ▼ -4.00%
- Median HH income
- $44,803
- Composite
- 22.77/100
- National rank
- #8027
- State rank
- #691 of 826 in TX
Livability — Fort Worth
- Score
- 80/100
- State rank
- #49
- US rank
- #1954
Category grades
Schools grade is shown separately in the Schools card above.
Census & demographics
- Census place
- Fort Worth, TX
- County
- Tarrant County · 2,033,669 people
- Metro
- Dallas-Fort Worth-Arlington, TX
- Population (ZIP)
- 33,321
- Household income
- $75,955
- Rent vs Own
- Severe rent burden
- 1264.0
Population outlook (Tarrant County) Hauer SSP2
- Today (2025)
- 2,380,417 people
- By 2030
- 2,578,900 · +8.3%
- By 2040
- 2,974,995 · +25.0%
- By 2050
- 3,350,489 · +40.8%
- By 2075
- 4,216,909 · +77.2%
- By 2100
- 4,741,527 · +99.2%
Race, ethnicity, and origin ACS 2023
- Neighborhood character
- Diverse neighborhood (Simpson 0.68)
- Race & ethnicity
- Hispanic / Latino 39% Black 35% White 20% Two or more races 14% Asian 3%
- Hispanic origin (detail)
- Mexican 36%
- Common ancestry
- Scotch-Irish 2% Lithuanian 1% Slovak 1%
- Foreign-born
- 18% · Canada, Vietnam, China
- Languages at home
- 64% English-only · Spanish 32% Vietnamese 2% Chinese 1%
Political lean MEDSL · Tarrant
- 2024 margin
- Lean R (+5.1) · D 46.7% · R 51.9% · Other 1.4%
- 2008→2024 swing
- +6.6pp toward D · 2008: -11.7pp · 2024: -5.1pp
- All cycles
- 2024: R+5.1 2020: D+0.2 2016: R+8.7 2012: R+15.7 2008: R+11.7
Not yet ingested
- Civics
- —
Market trends
- HPI YoY
- ▼ -79.54%
- Current HPI
- 285.9894
- Rent YoY
- ▲ 0.11%
- Metro
- Dallas-Fort Worth-Arlington, TX
- State GDP YoY
- ▲ 3.95%
- F500 in state
- 110
Industry mix (Fortune 500 HQ in TX)
| Industry | F500 HQs | Revenue |
|---|---|---|
| Energy | 16 | $1,198B |
|
||
| Technology | 5 | $198B |
|
||
| Engineering / Construction | 4 | $72B |
|
||
| Energy Services | 3 | $60B |
|
||
| Utilities | 3 | $41B |
|
||
| Healthcare | 2 | $330B |
|
||
Price history
+223.9% since first listed23 events — show timeline
- 2026-06-04 Pending — NTREIS
- 2026-05-27 Contingent — NTREIS
- 2026-05-19 Price Changed $289,900 NTREIS
- 2026-04-21 Listed $299,900 NTREIS
- 2025-04-15 Rental Removed $1,495 RENT.
- 2025-03-15 Listed for Rent $1,495 RENT.
- 2022-06-28 Sold (Public Records) — Public Records
- 2022-06-27 Sold (MLS) — NTREIS
- 2022-06-01 Pending — NTREIS
- 2022-05-13 Listed $225,000 NTREIS
- 2017-05-10 Sold (Public Records) — Public Records
- 2017-05-08 Sold (MLS) — NTREIS
- 2017-04-21 Pending — NTREIS
- 2017-03-28 Relisted — NTREIS
- 2017-03-21 Contingent — NTREIS
- 2017-02-06 Relisted — NTREIS
- 2017-02-03 Contingent — NTREIS
- 2017-01-11 Listed $155,000 NTREIS
- 2013-05-31 Listing Removed — NTREIS
- 2012-10-21 Listed $89,500 NTREIS
- 2004-03-08 Sold (Public Records) — Public Records
- 2000-12-27 Sold (Public Records) — Public Records
- 1995-11-22 Sold (Public Records) — Public Records
Property tax history
+7.1%/yrLatest (2025): $5,071 · -19.2% YoY. Source: county tax records.
Cash-flow waterfall
monthlySold comps — $/sqft
last 12 mo · ≤1 miLoading sold comps…