1110 North Henness Rd 2317 Plan · Casa Grande, AZ
Flood risk No data
- FEMA flood zone
- —
- Chance of flooding over 30 yrs
- —
- Est. flood insurance / yr
- —
Fire risk No data
- Est. fire insurance / yr
- —
Heat risk No data
- Hot days now (above threshold)
- —
- Hot days in 30 yrs
- —
Wind risk No data
- Chance of severe wind over 30 yrs
- —
Air-quality risk No data
- Unhealthy air days now
- —
- Unhealthy air days in 30 yrs
- —
Risk factors via First Street. Map © Google.
Why this score? — see what drove the B- grade
The composite is a weighted blend of 9 inputs, each scored 0–100. Each bar is that input's sub-score; the figure is the points it added to the 100-point composite (weight × sub-score).
- Cash flow +25.7/30.0
- ARV discount +15.0/15.0
- DSCR +8.6/10.0
- 1% rule +6.8/10.0
- Rent growth +3.7/5.0
- Livability +2.9/5.0
- Condition / age +2.5/5.0
- Schools +1.5/10.0
- Appreciation +0.0/10.0
$154,995
🖨 Deal sheet 📄 Offer letter ✓ Due diligence
Listing remarks
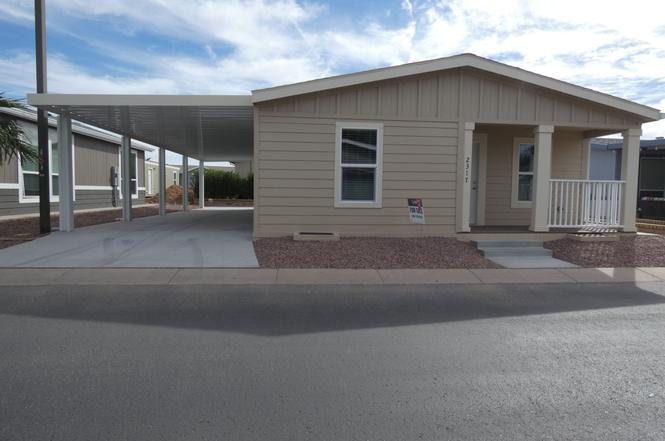
Welcome to your new oasis! Located at 2317 Granite Drive in the vibrant 55+ active adult community of Palm Creek Resort and Residences this charming 2 bedroom/2 bathroom 1170 sq ft home is the perfect blend of comfort and style. The kitchen is has stainless steel appliances, plenty of counter space and storage. The large utility room adds convenience, while the primary bedroom boasts a generous ensuite bathroom with a step-in shower and enormous walk in closet. Enjoy the outdoors with a lovely patio area, perfect for relaxation and entertaining. All of this located in a welcoming community where you'll enjoy fantastic amenities including golf, pickleball, lawn bowling, pottery, stained glas
Key facts
- Patio area
- Walk in closet
- Ensuite bathroom
Tags
Property features AI
Finance
- Financial info: List price $189,995
Exterior
- Home design: Plan inventory type; Single-level plan (Plan name: 1110 North Henness Rd 2317)
Interior
- Bedrooms: 2 bedrooms
- Bathrooms: 2 full bathrooms
- Interior features: Living area approximately 1,179
Neighborhood map
What this means for you Summary
Snapshot
- This is a 2-bed/2.0-bath manufactured listed at $155k.
Deal economics
- At list price, monthly cash flow is $373 ($4k/yr) — positive.
- The deal already cash-flows at list — no discount required.
- Meets the 1% rule at list price ($2k rent vs $155k).
- Recommended offer: $141k (9.0% below list) — sets the bar for market timing.
- Cap rate 9.2% vs local median 4.1% in Casa Grande — top-decile yield for the area; either an underpriced asset or a hidden risk that comps aren't pricing in. Stress-test before assuming the spread holds.
Location & tenants
- Location reads 58/100 on livability (#220 in AZ) — a working-class tenant base; expect higher turnover. Strengths: cost of living A+, housing A+; Watch: crime D+, employment D+, schools F.
- Casa Grande Union High School District (4453) (suburban): math 14% / reading 21% proficiency, ranked #193 of 249 in AZ (top 78%) — low school quality limits family demand, transient renter base, plan for 1-2y turnover.
- Market conditions: Rents rising fast (+4.6%/yr); 628 active listings in the ZIP; 13 comparable units currently listed for rent nearby; rentals leasing fast (median 2d on market — plan ~1-2 weeks tenant-placement turnaround); 9,504 units permitted in Pinal County in 2024 (776 in 5+ unit buildings).
- This rent runs 32% of the median local income ($68k/yr) — at the standard rent-burdened threshold; future hikes will face affordability resistance.
Forward outlook
- Local home prices are declining (-3.0%/yr); year-one equity from $1k of loan paydown is wiped out by about $5k of value loss. Plan a longer hold.
- At projected returns (-3.0% appreciation + 4.6% rent growth), your $43k cash investment doubles in ~9 years — after that, you're playing with house money.
Negotiation context
- It's been on market 104 days — a 9% lower offer ($141k) is reasonable based on typical stale-listing flexibility.
Questions for the listing agent
- It's been on market 104 days. Have you received any prior offers? Is the seller open to a 9% concession, seller financing, or rate buy-down credit?
- Why hasn't it sold? Are there any deal-killer items the seller is aware of (foundation, flood, title, zoning, code violations)?
- Is there a deadline driving the sale (1031 exchange, divorce, estate, relocation)? That informs how much negotiation room exists.
- Schools are F-rated, which usually means shorter tenancies and higher turnover. Who's the typical renter profile here, and what's been the actual vacancy rate?
- Crime grade is D in this area — have there been break-ins, vandalism, or insurance claims at this property in the last 3 years? What carrier currently insures it and at what premium?
- What's the average days-on-market for RENTAL listings here right now (not sales)? A rising rental-DOM trend means longer vacancies and softer asking-rent achievability than the comps imply.
- What's the recent tenant-quality profile in this submarket — average credit score on applications, eviction rate, late-payment / NSF rate, and stable-employment percentage? A property-management company in the area should have these aggregated.
- How much new for-sale + rental construction is in the pipeline within 1–3 miles? Heavy new supply typically softens prices + rents 12–24 months out; constrained supply supports both.
Investment metrics
- 1% rule
- 1.18% ✓
- Cap rate
- 9.18%
- Cash-on-cash
- 10.32%
- DSCR
- 1.46
- GRM
- 7.1
CMA / ARV
- ARV (on-the-fly)
- $221,652
- Comps found
- 1
Show comp detail 1 sale within ~0.75 mi
| Address | Dist | Beds/Ba | Sqft | Sold | Price | $/sf | Match |
|---|---|---|---|---|---|---|---|
| 1110 N Henness Rd #2199 | 0.00mi | 2/2.0 | 1,274 (+8%) | 6mo | $240,000 | $188 | 82 |
Match score weights: distance 35% · size 25% · config 20% · recency 20%. Top-matched comps best support the ARV.
Projected returns pro-forma
-3.0% appreciation · 4.6% rent growth · sell at horizon
- IRR
- 1.0%
- Equity multiple
- 1.04×
- Total profit
- $1,666
- Equity at exit
- $23,110
- IRR
- 12.2%
- Equity multiple
- 2.03×
- Total profit
- $44,839
- Equity at exit
- $13,401
Cash invested: $43,399 (down + closing). Projections, not guarantees.
Landlord ↔ Tenant lean methodology
- Overall (STATE)
- 87 Strongly Landlord-Friendly
- State Arizona
- 87 Strongly Landlord-Friendly · R+3
- County
- — inherits STATE
- City
- — inherits STATE
ZIP-level market 85122
- Home prices YoY
- -22.4%
- Rents YoY
- 4.6%
- Active inventory
- 628
- Price-to-rent
- 7.1×
Monthly cashflow live
- Estimated rent
- $1,828 high interval (Pro) →
- Mortgage (P&I)
- −$813
- Tax est. 1.5%
- −$194 /mo · $2,325/yr
- Insurance
- −$65
- HOA
- −$0
- Vacancy / Maint / Mgmt
- −$384
- Net cashflow
- $373
Break-even live
UW: 25.0% down · 7.5% · 30yr · 1.5% tax · 5.0% vac · 8.0% maint · 8.0% mgmt
Financing live
Cash to close
- Down payment
- $38,749
- Closing costs
- $4,650
- Reserves months
- —
- Total cash needed
- —
Loan-product check · same deal, 3 products live
Conventional
25% down · 7.5% · 30yr
- Down + closing
- —
- Monthly P&I
- —
- Monthly cashflow
- —
- DSCR
- —
- Eligible?
- —
Personal DTI + credit; lowest rate.
DSCR
20% down · 8.5% · 30yr
- Down + closing
- —
- Monthly P&I
- —
- Monthly cashflow
- —
- DSCR
- —
- Eligible?
- —
No personal income docs; deal must DSCR.
Hard money
10% down · 12.0% · 12mo
- Down + closing
- —
- Monthly P&I
- —
- Monthly cashflow
- —
- DSCR
- —
- Eligible?
- —
Short-term bridge; refi at stabilization.
Rent comps 13 comps
| Address | Beds | Baths | Sqft | Rent | $/sqft | DOM | Units | Dist |
|---|---|---|---|---|---|---|---|---|
| 1110 Henness Rd Casa Grande, AZ | 2.0 | 2.0 | 1166 | $1,599 | $1.37 | 1d | 1 | 0.39mi |
| 1762 E Sycamore Rd Casa Grande, AZ | 3.0 | 2.0 | 1273 | $3,500 | $2.75 | 24d | 1 | 0.65mi |
| 1771 E McMurray Blvd Casa Grande, AZ | 1.0–2.0 | 1.0 | 733 | $1,395 | $1.90 | 1d | 1 | 0.73mi |
| 1565 N Wildflower Dr Casa Grande, AZ | 1.0–3.0 | 1.0–2.0 | 998 | $1,304 | $1.31 | 1d | 9 | 0.78mi |
| 1000 N Arizola Rd Casa Grande, AZ | 2.0 | 1.0–2.0 | 621 | $1,351 | $2.18 | 1d | 10 | 0.79mi |
| 422 N Via Del Cielo Rd Casa Grande, AZ | 1.0–3.0 | 1.0–2.5 | 1090 | $2,172 | $1.99 | 5d | 30 | 0.97mi |
| 1821 E Florence Blvd Casa Grande, AZ | 1.0–3.0 | 1.0–2.0 | 1091 | $2,240 | $2.05 | 1d | 1 | 1.05mi |
| 1620 E Silver Reef Dr Casa Grande, AZ | 3.0 | 2.0 | 1202 | $1,575 | $1.31 | 24d | 1 | 1.11mi |
| 1715 N Peart Rd Casa Grande, AZ | 2.0–4.0 | 1.0–2.0 | 1221 | $1,465 | $1.20 | 2d | 22 | 1.12mi |
| 1450 E Cottonwood Ln Casa Grande, AZ | 1.0–2.0 | 1.0–2.0 | 821 | $1,995 | $2.43 | 1d | 18 | 1.24mi |
| 1650 E Jardin Pl Casa Grande, AZ | 3.0 | 2.0 | 1411 | $1,695 | $1.20 | 24d | 1 | 1.28mi |
| 255 N Camino Mercado Casa Grande, AZ | 1.0–3.0 | 1.0–2.0 | 1041 | $1,735 | $1.67 | 1d | 45 | 1.29mi |
| 1636 E Jardin Pl Casa Grande, AZ | 3.0 | 2.0 | 1411 | $1,999 | $1.42 | 5d | 1 | 1.30mi |
Listing history 15 events
-
2026-06-18days on market $154,995 Active 104 DOM
-
2026-06-17days on market $154,995 Active 103 DOM
-
2026-06-16days on market $154,995 Active 102 DOM
-
2026-06-15days on market $154,995 Active 101 DOM
-
2026-06-13days on market $154,995 Active 99 DOM
-
2026-06-13days on market $154,995 Active 98 DOM
-
2026-06-10price $154,995 Active 95 DOM
-
2026-06-09days on market $189,995 Active 95 DOM
-
2026-06-08days on market $189,995 Active 94 DOM
-
2026-06-07days on market $189,995 Active 93 DOM
-
2026-06-04days on market $189,995 Active 90 DOM
-
2026-06-03days on market $189,995 Active 89 DOM
-
2026-06-02days on market $189,995 Active 88 DOM
-
2026-06-01days on market $189,995 Active 87 DOM
-
2026-05-31days on market $189,995 Active 86 DOM
ⓘ Source: listings_history table (triggers on properties + properties_extension) + one-shot
backfill from property_details.listing_events for pre-trigger history.
Nearby sold comps map
Loading sold comps map…
Walkable amenities ~0.75 mi
Loading nearby amenities…
Taxation est. · year 1
- Rental income
- $21,938
- − Mortgage interest
- −$8,682
- − Property taxes
- −$2,325
- − Insurance
- −$775
- − Repairs & maintenance
- −$1,755
- − Management
- −$1,755
- − Depreciation
- −$4,509
- Taxable income
- $2,137
- Est. tax owed @ 24.0%
- −$513
- After-tax cash flow
- $3,965/yr
For passive investors: Depreciation is non-cash, so a rental often shows a tax loss while cash-flowing — sheltering income. Rental losses are passive: they offset passive income freely, and up to $25,000/yr can offset ordinary (W-2) income if you actively participate and your MAGI is under $100k (phasing out to $0 by $150k); unused losses carry forward. On sale, claimed depreciation is recaptured at up to 25%, and gains may owe capital-gains tax (a 1031 exchange can defer both). Figures are a year-1 estimate at your 24.0% rate — not tax advice; consult a CPA.
Schools (NCES district)
- District
- Casa Grande Union High School District (4453)
- NCES district ID
- 0401740
- Math proficiency
- 14% ▼ -15.00%
- Reading proficiency
- 21% ▼ -10.00%
- Median HH income
- $45,373
- Composite
- 15.38/100
- National rank
- #9319
- State rank
- #193 of 249 in AZ
Livability — Casa Grande
- Score
- 58/100
- State rank
- #220
- US rank
- #21534
Category grades
Schools grade is shown separately in the Schools card above.
Census & demographics
- Census place
- Casa Grande, AZ
- County
- Pinal County · 399,947 people
- City population
- 69,701
- Metro
- Phoenix-Mesa-Chandler, AZ
- Population (ZIP)
- 61,624
- Household income
- $68,443
- Rent vs Own
- Severe rent burden
- 1250.0
Population outlook (Pinal County) Hauer SSP2
- Today (2025)
- 437,574 people
- By 2030
- 446,903 · +2.1%
- By 2040
- 452,589 · +3.4%
- By 2050
- 444,126 · +1.5%
- By 2075
- 430,300 · -1.7%
- By 2100
- 393,536 · -10.1%
Race, ethnicity, and origin ACS 2023
- Neighborhood character
- Diverse neighborhood (Simpson 0.63)
- Race & ethnicity
- Hispanic / Latino 44% White 42% Two or more races 21% Black 4% Native American 4% Asian 1%
- Hispanic origin (detail)
- Mexican 40%
- Common ancestry
- Lithuanian 1% Slovak 1% Portuguese 1%
- Foreign-born
- 12% · Canada
- Languages at home
- 75% English-only · Spanish 23% Tagalog/Filipino 1% Other Indo-European 1%
Political lean MEDSL · Pinal
- 2024 margin
- Strong R (+22.1) · D 38.5% · R 60.6%
- 2008→2024 swing
- -7.6pp toward R · 2008: -14.5pp · 2024: -22.1pp
- All cycles
- 2024: R+22.1 2020: R+17.3 2016: R+19.3 2012: R+17.1 2008: R+14.5
Not yet ingested
- Civics
- —
Market trends
- HPI YoY
- ▼ -67.32%
- Current HPI
- 233.148
- Rent YoY
- ▲ 4.60%
- Metro
- Phoenix-Mesa-Chandler, AZ
- State GDP YoY
- ▲ 4.54%
- F500 in state
- 20
Industry mix (Fortune 500 HQ in AZ)
| Industry | F500 HQs | Revenue |
|---|---|---|
| Technology | 2 | $13B |
|
||
| Mining / Metals | 1 | $23B |
|
||
| Environmental Services | 1 | $16B |
|
||
| Metals / Steel | 1 | $14B |
|
||
| Technology Distribution | 1 | $9B |
|
||
| Homebuilding | 1 | $8B |
|
||
Cash-flow waterfall
monthlySold comps — $/sqft
last 12 mo · ≤1 miLoading sold comps…