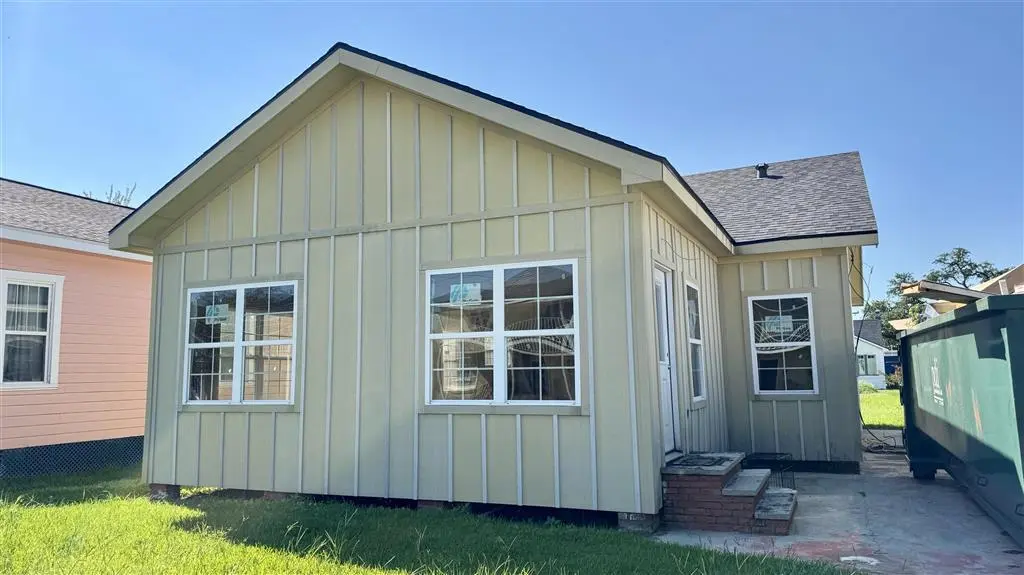
716 Clarence St · Lake Charles, LA
Flood risk 4/10 · Minor
- FEMA flood zone
- X (shaded)
- Chance of flooding over 30 yrs
- 0.13%
- Est. flood insurance / yr
- $507 – $1,088
Fire risk 2/10 · Minimal
- Est. fire insurance / yr
- $1,269 – $2,357
Heat risk 9/10 · Severe
- Hot days now (above 109°F)
- 7 days/yr
- Hot days in 30 yrs
- 22 days/yr
Wind risk 9/10 · Severe
- Chance of severe wind over 30 yrs
- 99.0%
Air-quality risk 2/10 · Minimal
- Unhealthy air days now
- 1 days/yr
- Unhealthy air days in 30 yrs
- 1 days/yr
Risk factors via First Street. Map © Google.
Why this score? — see what drove the B grade
The composite is a weighted blend of 9 inputs, each scored 0–100. Each bar is that input's sub-score; the figure is the points it added to the 100-point composite (weight × sub-score).
- Cash flow +26.5/30.0
- ARV discount +15.0/15.0
- DSCR +9.0/10.0
- 1% rule +7.1/10.0
- Rent growth +4.0/5.0
- Livability +3.4/5.0
- Schools +3.1/10.0
- Condition / age +2.5/5.0
- Appreciation +0.0/10.0
$140,000
🖨 Deal sheet 📄 Offer letter ✓ Due diligence
Listing remarks MLS
INVESTOR SPECIAL - This home has been taken down to the studs and just waiting for you to add some character! All exterior has been changed to board and baton. Windows and doors are all new. New roof and new subfloor. Home has been fully rewired with new panel installed. New AC unit. Plumbing needs to be roughed in then it’s ready for Sheetrock! Seller has vinyl flooring and tile for showers that can be left with the home. Located in Flood Zone X. Seller is also willing to finish the work and sell for a higher price.
Key facts
- Fully rewired
- New doors
- New subfloor
Tags
Neighborhood map
What this means for you Summary
Snapshot
- This is a 3-bed/2.0-bath single-family listed at $140k.
Deal economics
- At list price, monthly cash flow is $369 ($4k/yr) — positive.
- The deal already cash-flows at list — no discount required.
- Meets the 1% rule at list price ($2k rent vs $140k).
- Recommended offer: $132k (6.0% below list) — sets the bar for market timing.
- Cap rate 9.5% vs local median 4.3% in Lake Charles — top-decile yield for the area; either an underpriced asset or a hidden risk that comps aren't pricing in. Stress-test before assuming the spread holds.
Location & tenants
- Location reads 68/100 on livability (#95 in LA) — a middle-class / working-renter tenant base. Strengths: commute A+, cost of living A+, housing A+; Watch: crime F, amenities F, employment D-.
- Calcasieu Parish (other): math 30% / reading 44% proficiency, ranked #29 of 98 in LA (top 30%) — families likely to look elsewhere, expect single-tenant / working-renter base with shorter leases.
- Market conditions: Rents rising fast (+6.2%/yr); 363 active listings in the ZIP; 11 comparable units currently listed for rent nearby; rentals lingering (median 44d on market — plan ~5-8 weeks vacancy on turnover, expect pricing pressure); 55% of comp listings sitting > 30 days — soft ceiling on asking rent; 1,298 units permitted in Calcasieu Parish in 2024 (526 in 5+ unit buildings).
- This rent runs 41% of the median local income ($50k/yr) — at the standard rent-burdened threshold; future hikes will face affordability resistance.
Forward outlook
- Local home prices are declining (-3.0%/yr); year-one equity from $968 of loan paydown is wiped out by about $4k of value loss. Plan a longer hold.
- Calcasieu County population projected at +11% by 2050 — modest demand growth; plan on rents tracking national, not racing it.
- At projected returns (-3.0% appreciation + 6.2% rent growth), your $39k cash investment doubles in ~8 years — after that, you're playing with house money.
Negotiation context
- It's been on market 79 days — a 6% lower offer ($132k) is reasonable based on typical stale-listing flexibility.
- Current owner paid $72k; list at $140k implies a 93% gain — meaningful room to come down on a strong offer.
Risks & watch-outs
- Watch-outs: built in 1940 — expect roof / HVAC / electrical / plumbing capex.
- Climate carrying-cost: severe wind risk, 99% chance of damaging wind over 30y; extreme-heat days projected 7→22/yr by 2055 (HVAC capex compounding) — expect insurance premiums to compound above CPI over the hold.
Questions for the listing agent
- It's been on market 79 days. Have you received any prior offers? Is the seller open to a 6% concession, seller financing, or rate buy-down credit?
- Built in 1940 — when were the roof, HVAC, electrical panel, plumbing, and water heater last replaced?
- Why hasn't it sold? Are there any deal-killer items the seller is aware of (foundation, flood, title, zoning, code violations)?
- Is there a deadline driving the sale (1031 exchange, divorce, estate, relocation)? That informs how much negotiation room exists.
- Schools are B-rated — typically a magnet for longer-tenancy family renters. What's the average tenant stay here, and is there a school-zone premium baked into asking?
- Crime grade is F in this area — have there been break-ins, vandalism, or insurance claims at this property in the last 3 years? What carrier currently insures it and at what premium?
- What's the average days-on-market for RENTAL listings here right now (not sales)? A rising rental-DOM trend means longer vacancies and softer asking-rent achievability than the comps imply.
- What's the recent tenant-quality profile in this submarket — average credit score on applications, eviction rate, late-payment / NSF rate, and stable-employment percentage? A property-management company in the area should have these aggregated.
- How much new for-sale + rental construction is in the pipeline within 1–3 miles? Heavy new supply typically softens prices + rents 12–24 months out; constrained supply supports both.
Investment metrics
- 1% rule
- 1.21% ✓
- Cap rate
- 9.46%
- Cash-on-cash
- 11.31%
- DSCR
- 1.50
- GRM
- 6.9
CMA / ARV
- ARV (median comp)
- $202,880
- List price
- $140,000
- Delta
- -30.99%
- Verdict
- UNDERPRICED
- Comps
- 20 within 1.0 mi
Show comp detail 12 sales within ~0.75 mi
| Address | Dist | Beds/Ba | Sqft | Sold | Price | $/sf | Match |
|---|---|---|---|---|---|---|---|
| 817 5th St | 0.18mi | 3/2.0 | 1,550 (+7%) | 1mo | $180,000 | $116 | 79 |
| 1011 Common St | 0.22mi | 2/2.0 (-1) | 1,274 (-12%) | 2mo | $185,000 | $145 | 63 |
| 637 10th St | 0.50mi | 2/1.0 (-1) | 1,402 (-3%) | 3mo | $87,500 | $62 | 60 |
| 1226 7th St | 0.59mi | 3/1.0 | 1,446 (-0%) | 11mo | $142,000 | $98 | 59 |
| 710 7th St | 0.28mi | 2/1.5 (-1) | 1,271 (-12%) | 1mo | $151,050 | $119 | 58 |
| 408 Burnett St | 0.47mi | 4/2.0 (+1) | 1,358 (-6%) | 6mo | $147,000 | $108 | 57 |
| 1034 Iris St | 0.36mi | 2/2.0 (-1) | 1,350 (-7%) | 13mo | $154,000 | $114 | 56 |
| 1018 7th St | 0.43mi | 2/2.0 (-1) | 1,332 (-8%) | 8mo | $170,000 | $128 | 55 |
| 1713 Moss St | 0.39mi | 3/1.5 | 1,635 (+13%) | 4mo | $206,000 | $126 | 55 |
| 720 Pine St | 0.69mi | 2/2.0 (-1) | 1,485 (+2%) | 9mo | $125,000 | $84 | 51 |
| 713 Drew St | 0.48mi | 2/2.0 (-1) | 1,300 (-10%) | 12mo | $84,888 | $65 | 46 |
| 1313 10th St | 0.74mi | 2/2.0 (-1) | 1,370 (-6%) | 8mo | $150,000 | $109 | 45 |
Match score weights: distance 35% · size 25% · config 20% · recency 20%. Top-matched comps best support the ARV.
Projected returns pro-forma
-3.0% appreciation · 6.18% rent growth · sell at horizon
- IRR
- 4.1%
- Equity multiple
- 1.16×
- Total profit
- $6,453
- Equity at exit
- $20,874
- IRR
- 16.4%
- Equity multiple
- 2.54×
- Total profit
- $60,493
- Equity at exit
- $12,105
Cash invested: $39,200 (down + closing). Projections, not guarantees.
Landlord ↔ Tenant lean methodology
- Overall (STATE)
- 90 Strongly Landlord-Friendly
- State Louisiana
- 90 Strongly Landlord-Friendly · R+12
- County
- — inherits STATE
- City
- — inherits STATE
ZIP-level market 70601
- Rents YoY
- 6.2%
- Active inventory
- 363
- Price-to-rent
- 6.9×
Monthly cashflow live
- Estimated rent
- $1,692 high interval (Pro) →
- Mortgage (P&I)
- −$734
- Tax est. 1.5%
- −$175 /mo · $2,100/yr
- Insurance
- −$58
- HOA
- −$0
- Vacancy / Maint / Mgmt
- −$355
- Net cashflow
- $369
Break-even live
UW: 25.0% down · 7.5% · 30yr · 1.5% tax · 5.0% vac · 8.0% maint · 8.0% mgmt
Financing live
Cash to close
- Down payment
- $35,000
- Closing costs
- $4,200
- Reserves months
- —
- Total cash needed
- —
Loan-product check · same deal, 3 products live
Conventional
25% down · 7.5% · 30yr
- Down + closing
- —
- Monthly P&I
- —
- Monthly cashflow
- —
- DSCR
- —
- Eligible?
- —
Personal DTI + credit; lowest rate.
DSCR
20% down · 8.5% · 30yr
- Down + closing
- —
- Monthly P&I
- —
- Monthly cashflow
- —
- DSCR
- —
- Eligible?
- —
No personal income docs; deal must DSCR.
Hard money
10% down · 12.0% · 12mo
- Down + closing
- —
- Monthly P&I
- —
- Monthly cashflow
- —
- DSCR
- —
- Eligible?
- —
Short-term bridge; refi at stabilization.
Rent comps 11 comps
| Address | Beds | Baths | Sqft | Rent | $/sqft | DOM | Units | Dist |
|---|---|---|---|---|---|---|---|---|
| 1710 Granger St Lake Charles, LA | 3.0 | 2.5 | 1450 | $1,900 | $1.31 | 43d | 1 | 0.50mi |
| 628 Division St Lake Charles, LA | 2.0 | 1.0 | 1007 | $1,250 | $1.24 | 43d | 1 | 0.51mi |
| 125 East St Lake Charles, LA | 3.0 | 2.0 | 1138 | $3,850 | $3.38 | 43d | 1 | 0.66mi |
| 1731 Elms St Lake Charles, LA | 3.0 | 2.0 | 1575 | $2,000 | $1.27 | 43d | 1 | 0.69mi |
| 1505 7th St Lake Charles, LA | 2.0 | 1.0 | 1054 | $900 | $0.85 | 43d | 1 | 0.77mi |
| 1812 Ethel St Lake Charles, LA | 3.0 | 2.0 | 1589 | $3,850 | $2.42 | 43d | 1 | 0.84mi |
| 1915 Legion St Lake Charles, LA | 3.0 | 1.0 | 966 | $950 | $0.98 | 13d | 1 | 1.17mi |
| 1300 16th St Lake Charles, LA | 2.0 | 1.5 | 1344 | $1,295 | $0.96 | 21d | 1 | 1.18mi |
| 2116 Creole St Lake Charles, LA | 4.0 | 2.0 | 1305 | $1,500 | $1.15 | 21d | 1 | 1.26mi |
| 2002 13th St Lake Charles, LA | 4.0 | 2.0 | 1560 | $1,700 | $1.09 | 21d | 1 | 1.43mi |
| 2700 Ernest St Lake Charles, LA | 1.0–3.0 | 1.0–2.0 | 1054 | $1,598 | $1.52 | 13d | 1 | 1.46mi |
Listing history 19 events
-
2026-06-19days on market $140,000 Active 79 DOM
-
2026-06-18days on market $140,000 Active 78 DOM
-
2026-06-17days on market $140,000 Active 77 DOM
-
2026-06-16days on market $140,000 Active 76 DOM
-
2026-06-15days on market $140,000 Active 75 DOM
-
2026-06-14days on market $140,000 Active 73 DOM
-
2026-06-13days on market $140,000 Active 72 DOM
-
2026-06-10days on market $140,000 Active 70 DOM
-
2026-06-09days on market $140,000 Active 69 DOM
-
2026-06-08days on market $140,000 Active 68 DOM
-
2026-06-07days on market $140,000 Active 67 DOM
-
2026-06-05days on market $140,000 Active 64 DOM
-
2026-06-02days on market $140,000 Active 62 DOM
-
2026-06-01days on market $140,000 Active 61 DOM
-
2026-05-31days on market $140,000 Active 60 DOM
-
2026-05-30days on market $140,000 Active 59 DOM
-
2026-05-04price $145,000 528-char remark
Show marketing remark (528 chars)
INVESTOR SPECIAL - This home has been taken down to the studs and just waiting for you to add some character! All exterior has been changed to board and baton. Windows and doors are all new. New roof and new subfloor. Home has been fully rewired with new panel installed. New AC unit. Plumbing needs to be roughed in then it’s ready for Sheetrock! Seller has vinyl flooring and tile for showers that can be left with the home. Located in Flood Zone X. Seller is also willing to finish the work and sell for a higher price.
-
2026-04-02$149,000 Active 528-char remark
Show marketing remark (528 chars)
INVESTOR SPECIAL - This home has been taken down to the studs and just waiting for you to add some character! All exterior has been changed to board and baton. Windows and doors are all new. New roof and new subfloor. Home has been fully rewired with new panel installed. New AC unit. Plumbing needs to be roughed in then it’s ready for Sheetrock! Seller has vinyl flooring and tile for showers that can be left with the home. Located in Flood Zone X. Seller is also willing to finish the work and sell for a higher price.
-
2001-04-17soldstatus $72,500
ⓘ Source: listings_history table (triggers on properties + properties_extension) + one-shot
backfill from property_details.listing_events for pre-trigger history.
Climate risk First Street
- Flood 4/10 Moderate FEMA zone X (shaded) · 13% chance over 30 yrs
- Wildfire 2/10 Low
- Heat 9/10 Extreme 7 d/yr ≥109°F today · 22 d/yr by 30 yrs out
- Wind 9/10 Extreme 99% chance of damaging wind over 30 yrs
- Air quality 2/10 Low 1 unhealthy d/yr today · 1 by 30 yrs out
Nearby sold comps map
Loading sold comps map…
Walkable amenities ~0.75 mi
Loading nearby amenities…
Taxation est. · year 1
- Rental income
- $20,307
- − Mortgage interest
- −$7,842
- − Property taxes
- −$2,100
- − Insurance
- −$700
- − Repairs & maintenance
- −$1,625
- − Management
- −$1,625
- − Depreciation
- −$4,073
- Taxable income
- $2,343
- Est. tax owed @ 24.0%
- −$562
- After-tax cash flow
- $3,870/yr
For passive investors: Depreciation is non-cash, so a rental often shows a tax loss while cash-flowing — sheltering income. Rental losses are passive: they offset passive income freely, and up to $25,000/yr can offset ordinary (W-2) income if you actively participate and your MAGI is under $100k (phasing out to $0 by $150k); unused losses carry forward. On sale, claimed depreciation is recaptured at up to 25%, and gains may owe capital-gains tax (a 1031 exchange can defer both). Figures are a year-1 estimate at your 24.0% rate — not tax advice; consult a CPA.
Schools (NCES district)
- District
- Calcasieu Parish
- NCES district ID
- 2200330
- Math proficiency
- 30% ▼ -39.00%
- Reading proficiency
- 44% ▼ -33.00%
- Median HH income
- $44,700
- Composite
- 31.45/100
- National rank
- #5979
- State rank
- #29 of 98 in LA
Livability — Lake Charles
- Score
- 68/100
- State rank
- #95
- US rank
- #9820
Category grades
Schools grade is shown separately in the Schools card above.
Census & demographics
- Census place
- Lake Charles, LA
- County
- Calcasieu Parish · 170,889 people
- City population
- 133,538
- Metro
- Lake Charles, LA
- Population (ZIP)
- 30,872
- Household income
- $49,992
- Rent vs Own
- Severe rent burden
- 1304.0
Population outlook (Calcasieu County) Hauer SSP2
- Today (2025)
- 212,179 people
- By 2030
- 218,199 · +2.8%
- By 2040
- 228,486 · +7.7%
- By 2050
- 236,208 · +11.3%
- By 2075
- 251,696 · +18.6%
- By 2100
- 247,848 · +16.8%
Race, ethnicity, and origin ACS 2023
- Neighborhood character
- Diverse neighborhood (Simpson 0.55)
- Race & ethnicity
- Black 59% White 31% Two or more races 7% Hispanic / Latino 5%
- Common ancestry
- Lithuanian 7% Iranian 1% Serbian 1%
- Foreign-born
- 3% · Canada
- Languages at home
- 95% English-only · Spanish 2% French/Haitian/Cajun 1%
Political lean MEDSL · Calcasieu
- 2024 margin
- Solid R (+39.6) · D 29.5% · R 69.0% · Other 1.5%
- 2008→2024 swing
- -15.0pp toward R · 2008: -24.6pp · 2024: -39.6pp
- All cycles
- 2024: R+39.6 2020: R+35.2 2016: R+33.3 2012: R+28.7 2008: R+24.6
Not yet ingested
- Civics
- —
Market trends
- HPI YoY
- ▼ -109.32%
- Current HPI
- 55.6127
- Rent YoY
- ▲ 6.18%
- Metro
- Lake Charles, LA
- State GDP YoY
- ▲ 3.29%
- F500 in state
- 10
Industry mix (Fortune 500 HQ in LA)
| Industry | F500 HQs | Revenue |
|---|---|---|
| Telecommunications | 2 | $23B |
|
||
| Utilities | 1 | $12B |
|
||
| Wholesale / Distribution | 1 | $5B |
|
||
| Advertising | 1 | $2B |
|
||
Price history
+100.0% since first listed3 events — show timeline
- 2026-05-04 Price Changed $145,000 SWLAR
- 2026-04-02 Listed $149,000 SWLAR
- 2001-04-17 Sold (Public Records) $72,500 Public Records
Property tax history
-16.3%/yrLatest (2025): $85 · +4.4% YoY. Source: county tax records.
Cash-flow waterfall
monthlySold comps — $/sqft
last 12 mo · ≤1 miLoading sold comps…