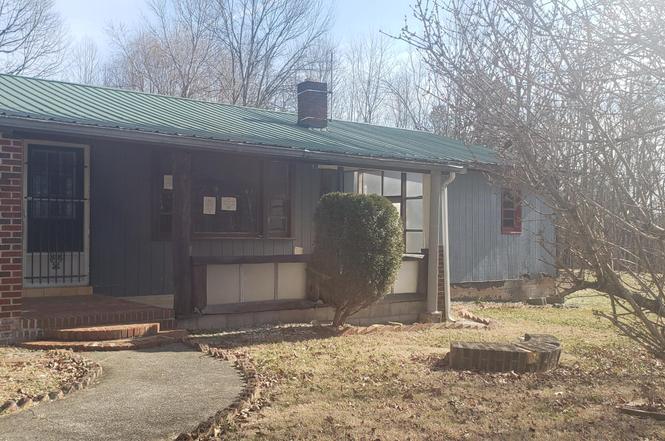
232 Crank Rd #1 · Annville, KY
Flood risk 1/10 · Minimal
- FEMA flood zone
- X (unshaded)
- Chance of flooding over 30 yrs
- 0.0%
- Est. flood insurance / yr
- $507 – $1,088
Fire risk 8/10 · Major
- Est. fire insurance / yr
- $839 – $1,559
Heat risk 3/10 · Minor
- Hot days now (above 98°F)
- 7 days/yr
- Hot days in 30 yrs
- 19 days/yr
Wind risk 2/10 · Minimal
- Chance of severe wind over 30 yrs
- 4.0%
Air-quality risk 1/10 · Minimal
- Unhealthy air days now
- 0 days/yr
- Unhealthy air days in 30 yrs
- 0 days/yr
Risk factors via First Street. Map © Google.
Why this score? — see what drove the B grade
The composite is a weighted blend of 9 inputs, each scored 0–100. Each bar is that input's sub-score; the figure is the points it added to the 100-point composite (weight × sub-score).
- Cash flow +30.0/30.0
- 1% rule +10.0/10.0
- DSCR +10.0/10.0
- ARV discount +7.5/15.0
- Livability +3.2/5.0
- Schools +2.6/10.0
- Rent growth +2.5/5.0
- Condition / age +2.5/5.0
- Appreciation +2.0/10.0
$39,900
🖨 Deal sheet 📄 Offer letter ✓ Due diligence
Listing remarks
Under FinCens new RRE Rule, transfers will be subject to reporting when buyers use entities or trusts to take title to residential real estate, when the transaction is all cash, privately financed or HELOC. This property is now active in an online auction. All offers must be submitted through the property's listing page on www. auction.com. The sale will be subject to a 5% buyer's premium pursuant to the Auction Terms and Conditions (minimums may apply). All auction bids will be processed subject to seller approval.
Key facts
- 0.5 acre lot
- Garage
- Listed 179 days
Neighborhood map
What this means for you Summary
Snapshot
- This is a 3-bed/1.0-bath single-family listed at $40k.
Deal economics
- At list price, monthly cash flow is $445 ($5k/yr) — positive.
- The deal already cash-flows at list — no discount required.
- Meets the 1% rule at list price ($913 rent vs $40k).
- Recommended offer: $35k (12.0% below list) — sets the bar for market timing.
Location & tenants
- Location reads 65/100 on livability (#270 in KY) — a middle-class / working-renter tenant base. Strengths: cost of living A+, housing A+; Watch: health & safety D+, employment D, amenities F.
- Jackson County (rural): math 24% / reading 40% proficiency, ranked #101 of 165 in KY (top 61%) — families likely to look elsewhere, expect single-tenant / working-renter base with shorter leases; 68% free/reduced lunch — lower-income household profile, screen leases tightly.
- Zoned schools: Tyner Elementary School (math 22% / reading 42%, grade F, #348 of 676 statewide, top 55%, 439 students, 72% FRL); Jackson County Middle School (math 14% / reading 34%, grade F, #194 of 217 statewide, top 90%, 401 students, 70% FRL); Jackson County High School (math 22% / reading 37%, grade F, #127 of 254 statewide, top 58%, 546 students, 65% FRL) — zoned schools at 69% FRL track the district average.
- Market conditions: 19 active listings in the ZIP.
Forward outlook
- Local home prices are declining (-3.0%/yr); year-one equity from $276 of loan paydown is wiped out by about $1k of value loss. Plan a longer hold.
- Jackson County population projected at -22% by 2050 — secular population decline; favor cash flow + early exit over multi-decade hold.
- At projected returns (-3.0% appreciation + 3.0% rent growth), your $11k cash investment doubles in ~3 years — after that, you're playing with house money.
Negotiation context
- It's been on market 179 days — a 12% lower offer ($35k) is reasonable based on typical stale-listing flexibility.
Risks & watch-outs
- Climate carrying-cost: severe wildfire risk — expect insurance premiums to compound above CPI over the hold.
Questions for the listing agent
- It's been on market 179 days. Have you received any prior offers? Is the seller open to a 12% concession, seller financing, or rate buy-down credit?
- Why hasn't it sold? Are there any deal-killer items the seller is aware of (foundation, flood, title, zoning, code violations)?
- Is there a deadline driving the sale (1031 exchange, divorce, estate, relocation)? That informs how much negotiation room exists.
- Schools are D-rated, which usually means shorter tenancies and higher turnover. Who's the typical renter profile here, and what's been the actual vacancy rate?
- What's the average days-on-market for RENTAL listings here right now (not sales)? A rising rental-DOM trend means longer vacancies and softer asking-rent achievability than the comps imply.
- What's the recent tenant-quality profile in this submarket — average credit score on applications, eviction rate, late-payment / NSF rate, and stable-employment percentage? A property-management company in the area should have these aggregated.
- How much new for-sale + rental construction is in the pipeline within 1–3 miles? Heavy new supply typically softens prices + rents 12–24 months out; constrained supply supports both.
Investment metrics
- 1% rule
- 2.29% ✓
- Cap rate
- 19.69%
- Cash-on-cash
- 47.83%
- DSCR
- 3.13
- GRM
- 3.6
CMA / ARV
No comps found within radius.
Projected returns pro-forma
-3.0% appreciation · 3.0% rent growth · sell at horizon
- IRR
- 45.3%
- Equity multiple
- 2.96×
- Total profit
- $21,911
- Equity at exit
- $5,949
- IRR
- 51.2%
- Equity multiple
- 5.98×
- Total profit
- $55,657
- Equity at exit
- $3,450
Cash invested: $11,172 (down + closing). Projections, not guarantees.
Landlord ↔ Tenant lean methodology
- Overall (STATE)
- 83 Strongly Landlord-Friendly
- State Kentucky
- 83 Strongly Landlord-Friendly · R+16
- County
- — inherits STATE
- City
- — inherits STATE
ZIP-level market 40486
- Home prices YoY
- -7.2%
- Active inventory
- 19
- Price-to-rent
- 3.6×
Monthly cashflow live
- Estimated rent
- $913 medium interval (Pro) →
- Mortgage (P&I)
- −$209
- Tax est. 1.5%
- −$50 /mo · $598/yr
- Insurance
- −$17
- HOA
- −$0
- Vacancy / Maint / Mgmt
- −$192
- Net cashflow
- $445
Break-even live
UW: 25.0% down · 7.5% · 30yr · 1.5% tax · 5.0% vac · 8.0% maint · 8.0% mgmt
Financing live
Cash to close
- Down payment
- $9,975
- Closing costs
- $1,197
- Reserves months
- —
- Total cash needed
- —
Loan-product check · same deal, 3 products live
Conventional
25% down · 7.5% · 30yr
- Down + closing
- —
- Monthly P&I
- —
- Monthly cashflow
- —
- DSCR
- —
- Eligible?
- —
Personal DTI + credit; lowest rate.
DSCR
20% down · 8.5% · 30yr
- Down + closing
- —
- Monthly P&I
- —
- Monthly cashflow
- —
- DSCR
- —
- Eligible?
- —
No personal income docs; deal must DSCR.
Hard money
10% down · 12.0% · 12mo
- Down + closing
- —
- Monthly P&I
- —
- Monthly cashflow
- —
- DSCR
- —
- Eligible?
- —
Short-term bridge; refi at stabilization.
Listing history 7 events
-
2026-04-21status Pending
-
2026-04-11price $39,900
-
2026-03-03price $49,900
-
2026-02-10price $59,900
-
2025-12-28price $74,900
-
2025-11-28price $89,900
-
2025-10-24$99,900 Active
ⓘ Source: listings_history table (triggers on properties + properties_extension) + one-shot
backfill from property_details.listing_events for pre-trigger history.
Climate risk First Street
- Flood 1/10 Low FEMA zone X (unshaded) · 0% chance over 30 yrs
- Wildfire 8/10 Severe
- Heat 3/10 Moderate 7 d/yr ≥98°F today · 19 d/yr by 30 yrs out
- Wind 2/10 Low 4% chance of damaging wind over 30 yrs
- Air quality 1/10 Low 0 unhealthy d/yr today · 0 by 30 yrs out
Nearby sold comps map
Loading sold comps map…
Walkable amenities ~0.75 mi
Loading nearby amenities…
Taxation est. · year 1
- Rental income
- $10,953
- − Mortgage interest
- −$2,235
- − Property taxes
- −$598
- − Insurance
- −$200
- − Repairs & maintenance
- −$876
- − Management
- −$876
- − Depreciation
- −$1,161
- Taxable income
- $5,007
- Est. tax owed @ 24.0%
- −$1,202
- After-tax cash flow
- $4,142/yr
For passive investors: Depreciation is non-cash, so a rental often shows a tax loss while cash-flowing — sheltering income. Rental losses are passive: they offset passive income freely, and up to $25,000/yr can offset ordinary (W-2) income if you actively participate and your MAGI is under $100k (phasing out to $0 by $150k); unused losses carry forward. On sale, claimed depreciation is recaptured at up to 25%, and gains may owe capital-gains tax (a 1031 exchange can defer both). Figures are a year-1 estimate at your 24.0% rate — not tax advice; consult a CPA.
Schools (NCES district)
- District
- Jackson County
- NCES district ID
- 2102940
- Math proficiency
- 24% ▼ -15.00%
- Reading proficiency
- 40% ▼ -17.00%
- Median HH income
- $27,446
- Composite
- 25.64/100
- National rank
- #7402
- State rank
- #101 of 165 in KY
Livability — Annville
- Score
- 65/100
- State rank
- #270
- US rank
- #13162
Category grades
Schools grade is shown separately in the Schools card above.
Census & demographics
- Population (ZIP)
- 2,774
Population outlook (Jackson County) Hauer SSP2
- Today (2025)
- 12,772 people
- By 2030
- 12,285 · -3.8%
- By 2040
- 11,129 · -12.9%
- By 2050
- 9,933 · -22.2%
- By 2075
- 7,419 · -41.9%
- By 2100
- 5,555 · -56.5%
Race, ethnicity, and origin ACS 2023
- Neighborhood character
- Predominantly White (96%)
- Race & ethnicity
- White 96% Two or more races 3% Native American 1%
- Common ancestry
- Scotch-Irish 1% Portuguese 1% Scottish 1%
Political lean MEDSL · Jackson
- 2024 margin
- Solid R (+81.8) · D 8.5% · R 90.3% · Other 1.2%
- 2008→2024 swing
- -11.6pp toward R · 2008: -70.1pp · 2024: -81.8pp
- All cycles
- 2024: R+81.8 2020: R+79.3 2016: R+80.2 2012: R+74.2 2008: R+70.1
Not yet ingested
- Civics
- —
Market trends
- HPI YoY
- ▼ -5.96%
- Current HPI
- 76.6127
- Rent YoY
- —
- Metro
- —
- State GDP YoY
- ▲ 1.81%
- F500 in state
- 4
Industry mix (Fortune 500 HQ in KY)
| Industry | F500 HQs | Revenue |
|---|---|---|
| Healthcare | 1 | $118B |
|
||
| Food / Beverage | 1 | $7B |
|
||
Price history
-60.1% since first listed7 events — show timeline
- 2026-04-21 Pending — ImagineMLS
- 2026-04-11 Price Changed $39,900 ImagineMLS
- 2026-03-03 Price Changed $49,900 ImagineMLS
- 2026-02-10 Price Changed $59,900 ImagineMLS
- 2025-12-28 Price Changed $74,900 ImagineMLS
- 2025-11-28 Price Changed $89,900 ImagineMLS
- 2025-10-24 Listed $99,900 ImagineMLS
Cash-flow waterfall
monthlySold comps — $/sqft
last 12 mo · ≤1 miLoading sold comps…