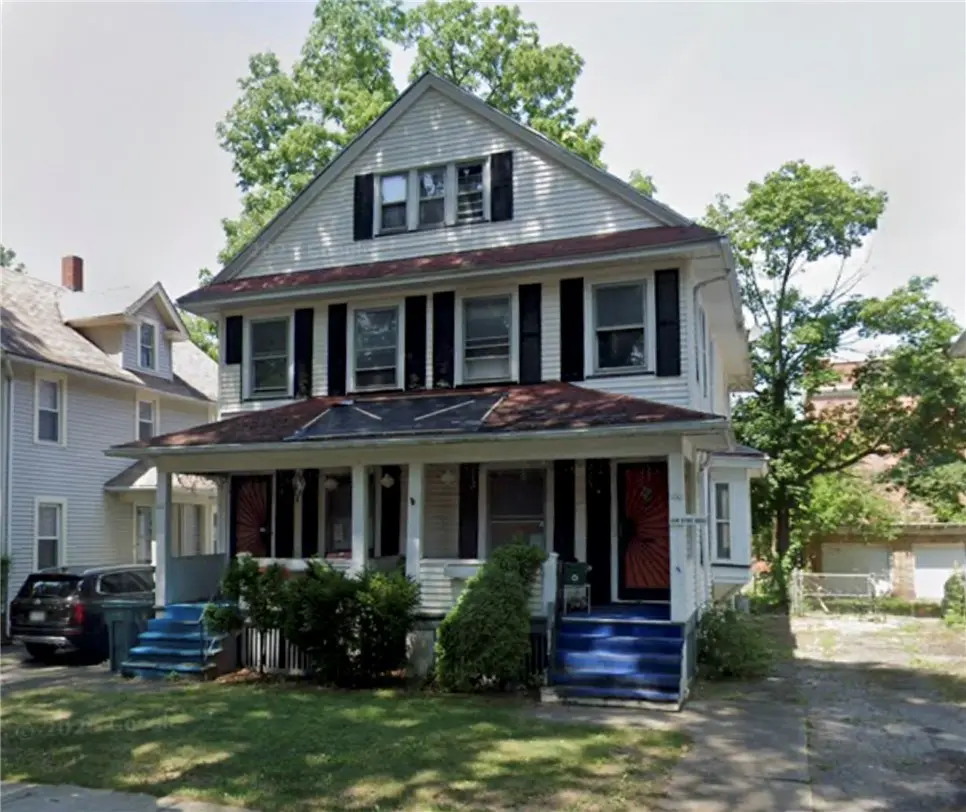
100-102 Ravenwood Ave · Rochester, NY
Flood risk 1/10 · Minimal
- FEMA flood zone
- X (unshaded)
- Chance of flooding over 30 yrs
- 0.0%
- Est. flood insurance / yr
- $473 – $860
Fire risk 1/10 · Minimal
- Est. fire insurance / yr
- $691 – $1,283
Heat risk 2/10 · Minimal
- Hot days now (above 96°F)
- 7 days/yr
- Hot days in 30 yrs
- 15 days/yr
Wind risk 1/10 · Minimal
- Chance of severe wind over 30 yrs
- —
Air-quality risk 2/10 · Minimal
- Unhealthy air days now
- 1 days/yr
- Unhealthy air days in 30 yrs
- 1 days/yr
Risk factors via First Street. Map © Google.
Why this score? — see what drove the B grade
The composite is a weighted blend of 9 inputs, each scored 0–100. Each bar is that input's sub-score; the figure is the points it added to the 100-point composite (weight × sub-score).
- Cash flow +30.0/30.0
- ARV discount +10.9/15.0
- 1% rule +10.0/10.0
- DSCR +10.0/10.0
- Livability +3.8/5.0
- Rent growth +2.5/5.0
- Condition / age +2.5/5.0
- Schools +1.9/10.0
- Appreciation +0.0/10.0
$129,900
🖨 Deal sheet 📄 Offer letter ✓ Due diligence
Listing remarks
* * * 19TH WARD CASH COW * * * listed @ $55/SQ. FT - CLASSIC DUPLEX OFFERING INCREDIBLE ROI POTENTIAL (market rents $1300 +/- per month ——> DO THE MATH). BOTH THREE BEDROOM UNITS FEATURE: IMPRESSIVE FOYER with HIGH CEILINGS and GRAND STAIRCASE, * * * HARDWOOD FLOORS THROUGHOUT * * * , LIGHT FILLED LIVING AREAS with OVERSIZED BAY WINDOW, EAT-IN KITCHEN with DIRECT ACCESS to PRIVATE BACKYARD, * * * COZY SLEEPING PORCH * * * off PRIMARY BEDROOM for those HOT SUMMER NIGHTS, FULL WALK-UP ATTIC for storage or ADDITIONAL LIVING SPACE. SEPARATE UTILITIES, LOW MAINTENANCE VINYL SIDING, FULL BASEMENT with GLASS BLOCK WINDOWS and LAUNDRY HOOK-UPS. Estate sale - property so
Key facts
- Impressive foyer
- Grand staircase
- Oversized bay window
Tags
Property features AI
Finance
- Other: Lot is rectangular with road frontage on a city street; Lot dimensions approximately 40 x 142; Lot area ~0.1307 acres
- Financial info: Multi-unit property with 2 total units; Separate gas and electric meters for each unit; Operating expense details: see remarks; Owner pays / rent includes: see remarks
- HOA & community: No HOA information listed
Exterior
- Parking: On-street parking
- Security: No security features listed
- Utilities: Electricity connected; High-speed internet available; Sewer connected; Public water available
- Home design: 2-story building; Residential 2-unit zoning; Resale property
- Construction: Vinyl siding; Asphalt roof; Block foundation; Existing (no recent new construction noted)
- Exterior features: Balcony; Fence (partial)
Interior
- Kitchen: No kitchen appliance list provided
- Bedrooms: Not specified
- Flooring: Hardwood; Tile; Varies
- Bathrooms: 2 full bathrooms
- Heating & cooling: Gas heating; Forced air heating
- Interior features: Natural woodwork; Some areas vary in flooring; See remarks (additional interior details)
- Laundry & utility: Gas water heater
Neighborhood map
What this means for you Summary
Snapshot
- This is a 6-bed/2.5-bath townhouse listed at $130k.
Deal economics
- At list price, monthly cash flow is $736 ($9k/yr) — positive.
- The deal already cash-flows at list — no discount required.
- Meets the 1% rule at list price ($2k rent vs $130k).
- Cap rate 13.1% vs local median 9.3% in Rochester — top-decile yield for the area; either an underpriced asset or a hidden risk that comps aren't pricing in. Stress-test before assuming the spread holds.
Location & tenants
- Location reads 76/100 on livability (#222 in NY, #3,482 nationally) — a middle-class / working-renter tenant base. Strengths: commute A+, cost of living A+, housing A+; Watch: schools D+, crime F, employment F.
- Rochester City School District (urban): math 21% / reading 26% proficiency, ranked #589 of 590 in NY (top 100%) — low school quality limits family demand, transient renter base, plan for 1-2y turnover; 82% free/reduced lunch — lower-income household profile, screen leases tightly.
- Market conditions: 48 active listings in the ZIP; 1,169 units permitted in Monroe County in 2024 (591 in 5+ unit buildings).
Forward outlook
- Local home prices are declining (-3.0%/yr); year-one equity from $898 of loan paydown is wiped out by about $4k of value loss. Plan a longer hold.
- Monroe County population projected to shrink 6% by 2050 — rents likely to lag national; underwrite the cash flow, not the appreciation.
- At projected returns (-3.0% appreciation + 3.0% rent growth), your $36k cash investment doubles in ~5 years — after that, you're playing with house money.
Negotiation context
- Only 10 days on market — expect competitive offers; lowballing is unlikely to land.
Risks & watch-outs
- Watch-outs: built in 1880 — expect roof / HVAC / electrical / plumbing capex.
Questions for the listing agent
- Built in 1880 — when were the roof, HVAC, electrical panel, plumbing, and water heater last replaced?
- Is there a deadline driving the sale (1031 exchange, divorce, estate, relocation)? That informs how much negotiation room exists.
- Schools are D-rated, which usually means shorter tenancies and higher turnover. Who's the typical renter profile here, and what's been the actual vacancy rate?
- Crime grade is F in this area — have there been break-ins, vandalism, or insurance claims at this property in the last 3 years? What carrier currently insures it and at what premium?
- What's the average days-on-market for RENTAL listings here right now (not sales)? A rising rental-DOM trend means longer vacancies and softer asking-rent achievability than the comps imply.
- What's the recent tenant-quality profile in this submarket — average credit score on applications, eviction rate, late-payment / NSF rate, and stable-employment percentage? A property-management company in the area should have these aggregated.
- How much new for-sale + rental construction is in the pipeline within 1–3 miles? Heavy new supply typically softens prices + rents 12–24 months out; constrained supply supports both.
Investment metrics
- 1% rule
- 1.54% ✓
- Cap rate
- 13.10%
- Cash-on-cash
- 24.29%
- DSCR
- 2.08
- GRM
- 5.4
CMA / ARV
- ARV (on-the-fly)
- $140,420
- Comps found
- 12
Show comp detail 12 sales within ~0.75 mi
| Address | Dist | Beds/Ba | Sqft | Sold | Price | $/sf | Match |
|---|---|---|---|---|---|---|---|
| 187 Elmdorf Ave | 0.41mi | 6/2.0 | 2,260 (-5%) | 6mo | $150,000 | $66 | 65 |
| 29-33 Westgate Ter | 0.46mi | 6/3.0 | 2,290 (-4%) | 6mo | $196,500 | $86 | 65 |
| 111 Enterprise St | 0.34mi | 6/2.0 | 2,178 (-8%) | 6mo | $115,000 | $53 | 63 |
| 171 Wellington Ave | 0.59mi | 6/2.0 | 2,490 (+5%) | 3mo | $140,000 | $56 | 60 |
| 188 Warwick Ave | 0.52mi | 6/3.0 | 2,480 (+4%) | 15mo | $185,000 | $75 | 54 |
| 343 West Ave | 0.75mi | 6/2.0 | 2,470 (+4%) | 8mo | $145,000 | $59 | 50 |
| 257 Barton St St | 0.73mi | 5/2.0 (-1) | 2,517 (+6%) | 1mo | $260,000 | $103 | 48 |
| 73-75 Somerset St | 0.68mi | 7/2.0 (+1) | 2,192 (-8%) | 4mo | $250,000 | $114 | 45 |
| 104 Hobart St | 0.61mi | 7/2.0 (+1) | 2,637 (+11%) | 4mo | $149,900 | $57 | 43 |
| 457-459 Chili Ave | 0.47mi | 7/2.0 (+1) | 2,034 (-14%) | 6mo | $97,000 | $48 | 42 |
| 422 Magnolia St | 0.73mi | 6/2.0 | 2,148 (-10%) | 18mo | $70,000 | $33 | 32 |
| 101 Superior St | 0.66mi | 5/2.0 (-1) | 2,032 (-15%) | 12mo | $85,000 | $42 | 28 |
Match score weights: distance 35% · size 25% · config 20% · recency 20%. Top-matched comps best support the ARV.
Projected returns pro-forma
-3.0% appreciation · 3.0% rent growth · sell at horizon
- IRR
- 17.6%
- Equity multiple
- 1.71×
- Total profit
- $25,845
- Equity at exit
- $19,369
- IRR
- 26.0%
- Equity multiple
- 3.28×
- Total profit
- $82,876
- Equity at exit
- $11,231
Cash invested: $36,372 (down + closing). Projections, not guarantees.
Landlord ↔ Tenant lean methodology
- Overall (STATE)
- 15 Strongly Tenant-Friendly
- State New York
- 15 Strongly Tenant-Friendly · D+10
- County
- — inherits STATE
- City
- — inherits STATE
ZIP-level market 14619
- Home prices YoY
- -10.0%
- Active inventory
- 48
- Price-to-rent
- 5.4×
Monthly cashflow live
- Estimated rent
- $1,997 medium interval (Pro) →
- Mortgage (P&I)
- −$681
- Tax from tax record
- −$106 /mo · $1,269/yr
- Insurance
- −$54
- HOA
- −$0
- Vacancy / Maint / Mgmt
- −$419
- Net cashflow
- $736
Break-even live
UW: 25.0% down · 7.5% · 30yr · 1.5% tax · 5.0% vac · 8.0% maint · 8.0% mgmt
Financing live
Cash to close
- Down payment
- $32,475
- Closing costs
- $3,897
- Reserves months
- —
- Total cash needed
- —
Loan-product check · same deal, 3 products live
Conventional
25% down · 7.5% · 30yr
- Down + closing
- —
- Monthly P&I
- —
- Monthly cashflow
- —
- DSCR
- —
- Eligible?
- —
Personal DTI + credit; lowest rate.
DSCR
20% down · 8.5% · 30yr
- Down + closing
- —
- Monthly P&I
- —
- Monthly cashflow
- —
- DSCR
- —
- Eligible?
- —
No personal income docs; deal must DSCR.
Hard money
10% down · 12.0% · 12mo
- Down + closing
- —
- Monthly P&I
- —
- Monthly cashflow
- —
- DSCR
- —
- Eligible?
- —
Short-term bridge; refi at stabilization.
Listing history 8 events
-
2026-06-13statusdays on market $129,900 Pending 10 DOM
-
2026-06-10days on market $129,900 Active 8 DOM
-
2026-06-09days on market $129,900 Active 7 DOM
-
2026-06-09days on market $129,900 Active 6 DOM
-
2026-06-07days on market $129,900 Active 5 DOM
-
2026-06-05days on market $129,900 Active 2 DOM
-
2026-06-03remarks 684-char remark
-
2026-06-03$129,900 Active 1 DOM
ⓘ Source: listings_history table (triggers on properties + properties_extension) + one-shot
backfill from property_details.listing_events for pre-trigger history.
Tax reassessment forecast NY · Partial reset (capped growth)
- Current annual tax
- $1,269 · $106/mo
- Projected year-2 tax
- $1,732 · $144/mo
- Expected delta
- +$463/yr (+$39/mo · 36.5%)
ⓘ Screening estimate from a state-policy table — verify with the county assessor before closing.
Climate risk First Street
- Flood 1/10 Low FEMA zone X (unshaded) · 0% chance over 30 yrs
- Wildfire 1/10 Low
- Heat 2/10 Low 7 d/yr ≥96°F today · 15 d/yr by 30 yrs out
- Wind 1/10 Low
- Air quality 2/10 Low 1 unhealthy d/yr today · 1 by 30 yrs out
Nearby sold comps map
Loading sold comps map…
Walkable amenities ~0.75 mi
Loading nearby amenities…
Taxation est. · year 1
- Rental income
- $23,961
- − Mortgage interest
- −$7,276
- − Property taxes
- −$1,269
- − Insurance
- −$650
- − Repairs & maintenance
- −$1,917
- − Management
- −$1,917
- − Depreciation
- −$3,779
- Taxable income
- $7,154
- Est. tax owed @ 24.0%
- −$1,717
- After-tax cash flow
- $7,119/yr
For passive investors: Depreciation is non-cash, so a rental often shows a tax loss while cash-flowing — sheltering income. Rental losses are passive: they offset passive income freely, and up to $25,000/yr can offset ordinary (W-2) income if you actively participate and your MAGI is under $100k (phasing out to $0 by $150k); unused losses carry forward. On sale, claimed depreciation is recaptured at up to 25%, and gains may owe capital-gains tax (a 1031 exchange can defer both). Figures are a year-1 estimate at your 24.0% rate — not tax advice; consult a CPA.
Schools (NCES district)
- District
- Rochester City School District
- NCES district ID
- 3624750
- Math proficiency
- 21% ▬ 0.00%
- Reading proficiency
- 26% ▲ 4.00%
- Median HH income
- $30,923
- Composite
- 18.98/100
- National rank
- #8850
- State rank
- #589 of 590 in NY
Livability — Rochester
- Score
- 76/100
- State rank
- #222
- US rank
- #3482
Category grades
Schools grade is shown separately in the Schools card above.
Census & demographics
- Census place
- Rochester, NY
- City population
- 432,803
- Population (ZIP)
- 14,223
Population outlook (Monroe County) Hauer SSP2
- Today (2025)
- 759,460 people
- By 2030
- 757,154 · -0.3%
- By 2040
- 740,644 · -2.5%
- By 2050
- 714,443 · -5.9%
- By 2075
- 645,883 · -15.0%
- By 2100
- 547,084 · -28.0%
Race, ethnicity, and origin ACS 2023
- Neighborhood character
- Predominantly Black (66%)
- Race & ethnicity
- Black 66% White 20% Two or more races 8% Hispanic / Latino 6% Asian 1%
- Hispanic origin (detail)
- Puerto Rican 5%
- Common ancestry
- Romanian 2% Swedish 1% Lithuanian 1%
- Foreign-born
- 8% · Canada
- Languages at home
- 92% English-only · Spanish 3% Arabic 1% French/Haitian/Cajun 1%
Political lean MEDSL · Monroe
- 2024 margin
- D (+19.1) · D 59.5% · R 40.5%
- 2008→2024 swing
- +1.4pp toward D · 2008: 17.7pp · 2024: 19.1pp
- All cycles
- 2024: D+19.1 2020: D+21.0 2016: D+14.1 2012: D+17.4 2008: D+17.7
Not yet ingested
- Civics
- —
Market trends
- HPI YoY
- ▼ -30.67%
- Current HPI
- 276.3851
- Rent YoY
- —
- Metro
- —
- State GDP YoY
- ▲ 2.60%
- F500 in state
- 92
Industry mix (Fortune 500 HQ in NY)
| Industry | F500 HQs | Revenue |
|---|---|---|
| Financial Services | 10 | $950B |
|
||
| Consumer Goods | 9 | $162B |
|
||
| Insurance | 4 | $225B |
|
||
| Telecommunications | 2 | $144B |
|
||
| Pharmaceuticals | 2 | $112B |
|
||
| Media / Entertainment | 2 | $69B |
|
||
Price history
1 event — show timeline
- 2026-06-02 Listed $129,900 UNYREIS
Property tax history
+0.6%/yrLatest (2025): $1,269 · +0.0% YoY. Source: county tax records.
Cash-flow waterfall
monthlySold comps — $/sqft
last 12 mo · ≤1 miLoading sold comps…